San Francisco real estate report cover with the Golden Gate Bridge emerging from fog.

San Francisco Home Prices, Market Conditions & Trends July 2025

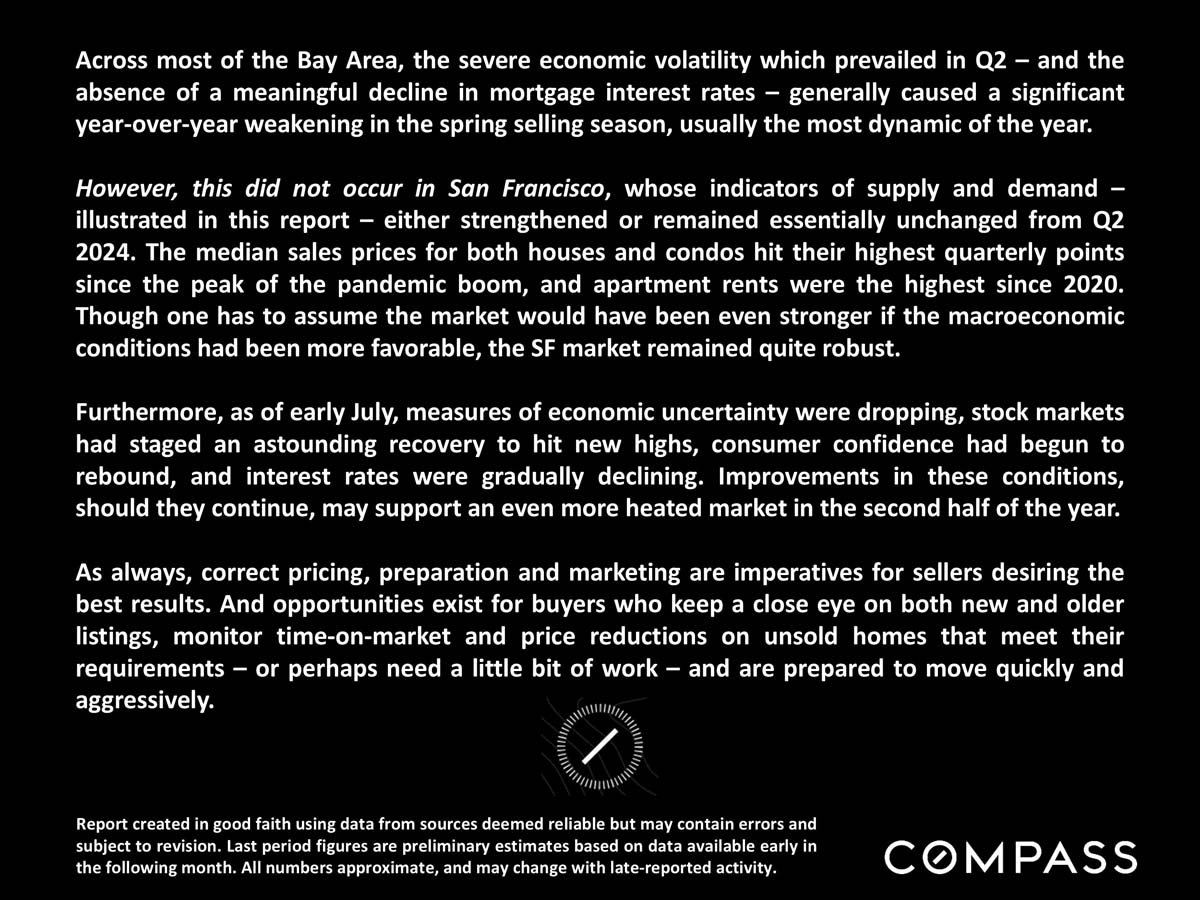
Across most of the Bay Area, the severe economic volatility which prevailed in Q2 – and the absence of a meaningful decline in mortgage interest rates – generally caused a significant year-over-year weakening in the spring selling season, usually the most dynamic of the year.

 
San Francisco Real Estate July 2025 Report cover with the Golden Gate Bridge rising above fog.
 
San Francisco housing market summary discussing prices, rents, and economic conditions, with Compass branding.
 
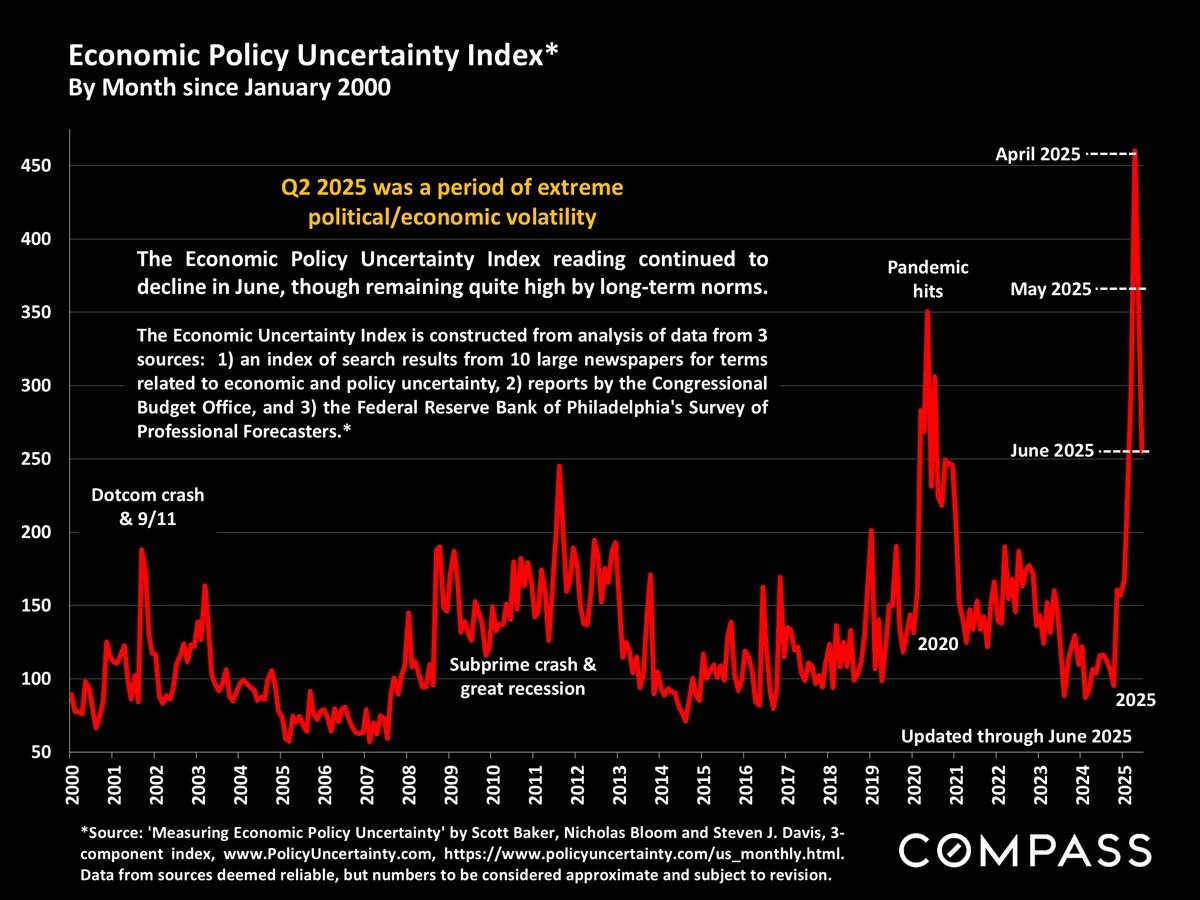
Economic Policy Uncertainty Index chart, with a sharp spike in April 2025 and readings through June 2025.
 
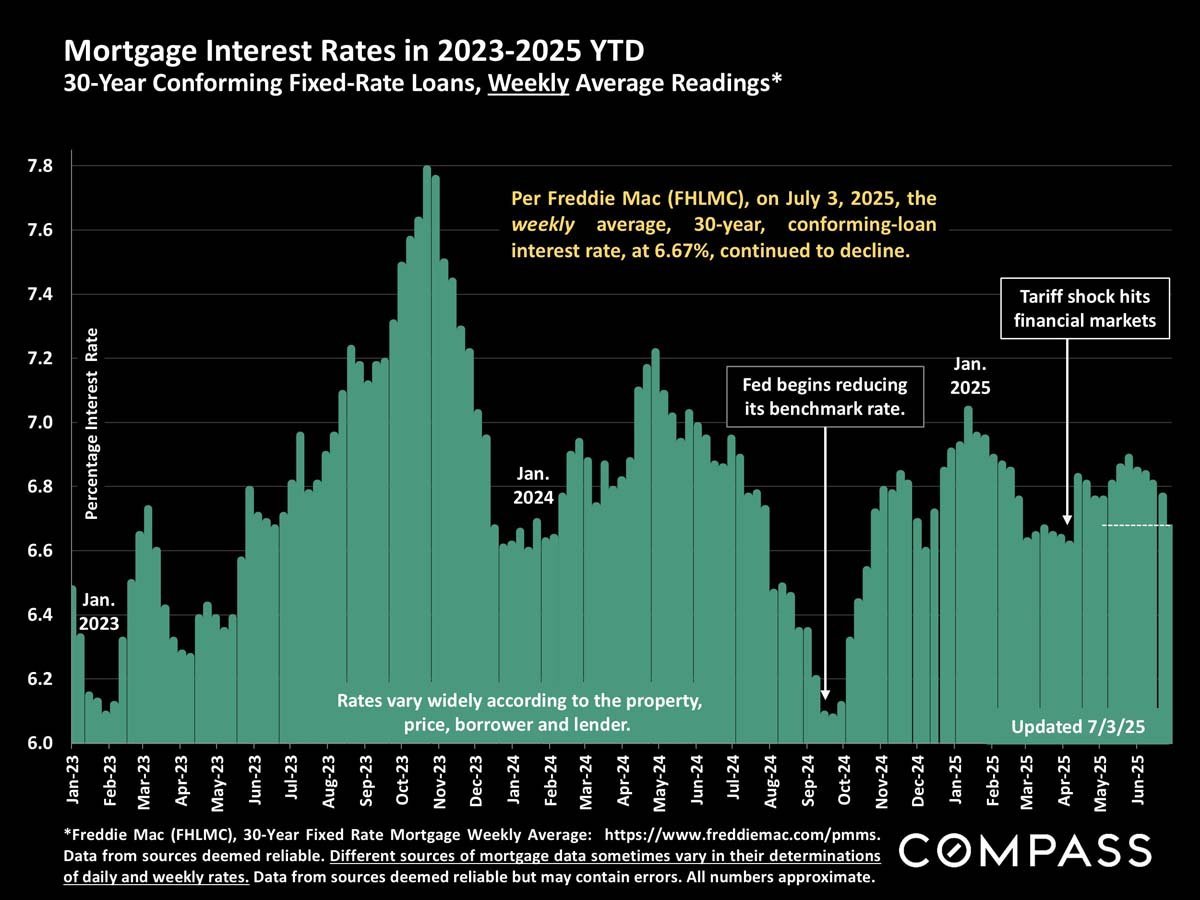
Chart of weekly 30-year mortgage rates from 2023 to 2025, with the latest rate at 6.67%.
 
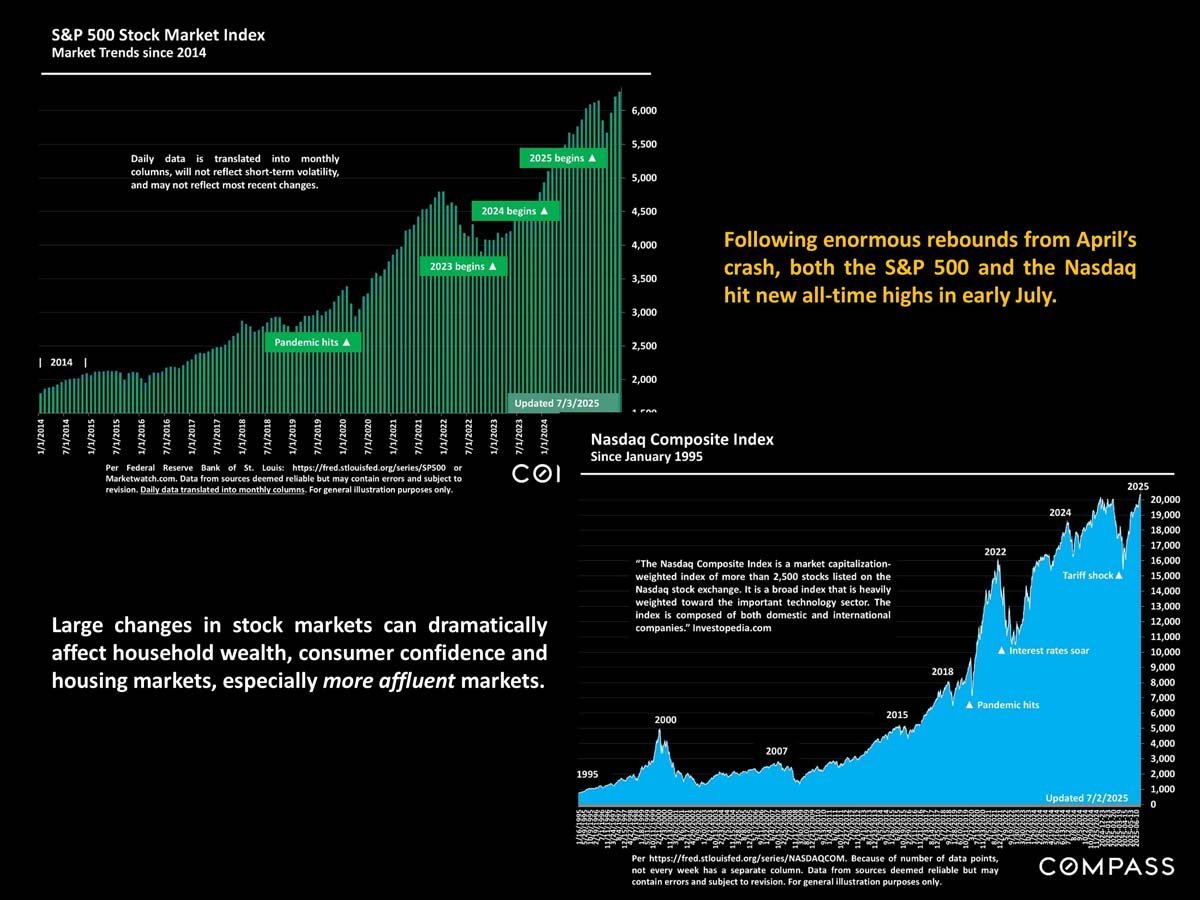
Infographic charts S&P 500 and Nasdaq indexes rising to new highs in July 2025 and discusses effects on housing markets.
 
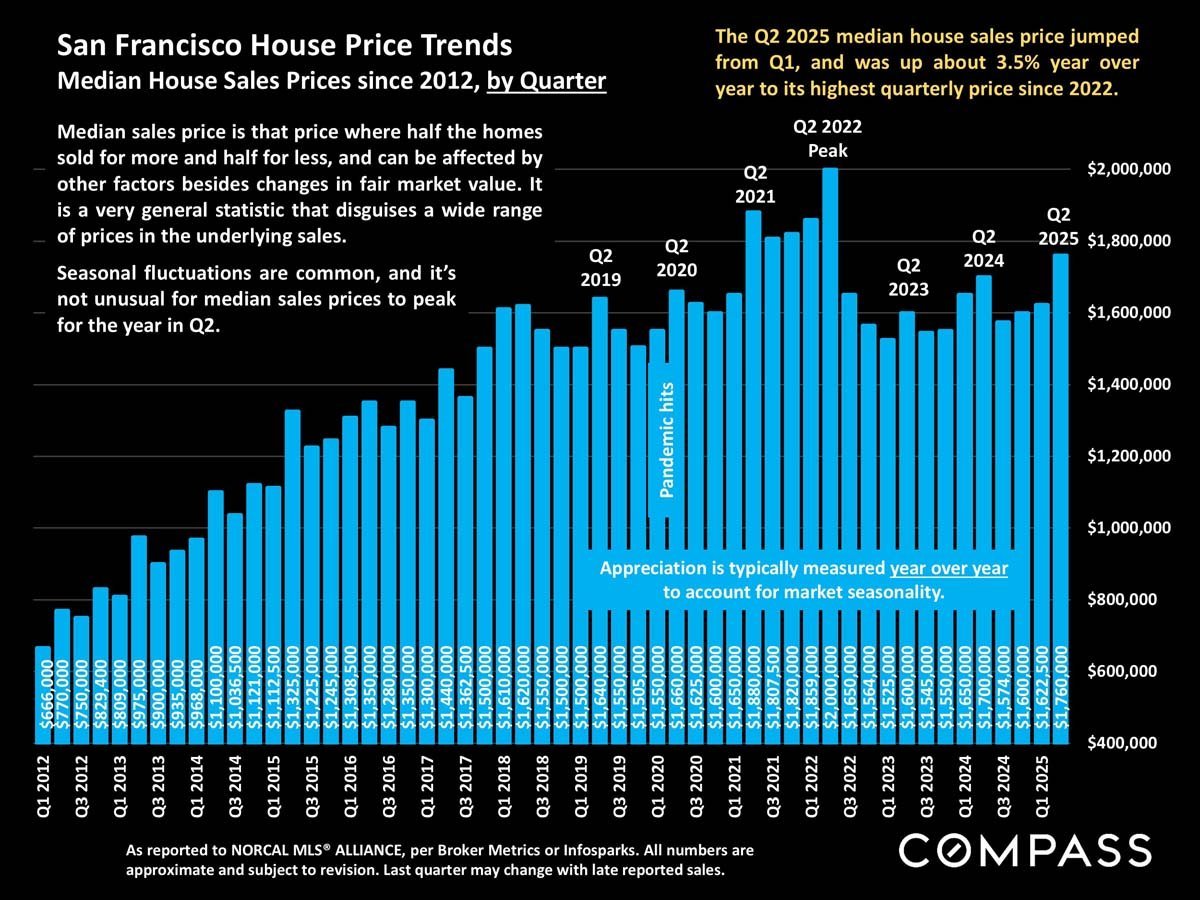
Chart of San Francisco quarterly median home sale prices, 2012–2025, showing a $2 million peak in Q2 2022.
 
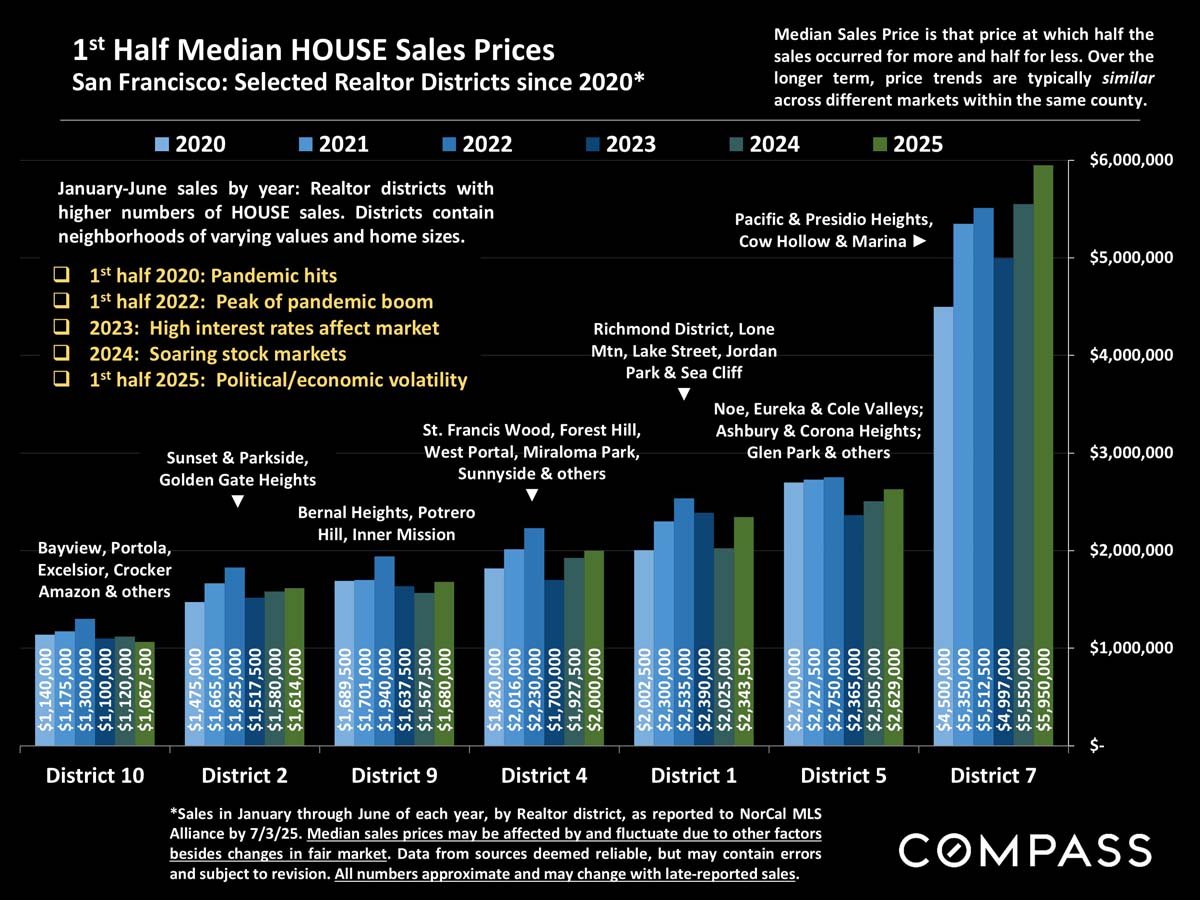
Chart of first-half median house prices across seven San Francisco districts, 2020–2025, with neighborhood labels.
 
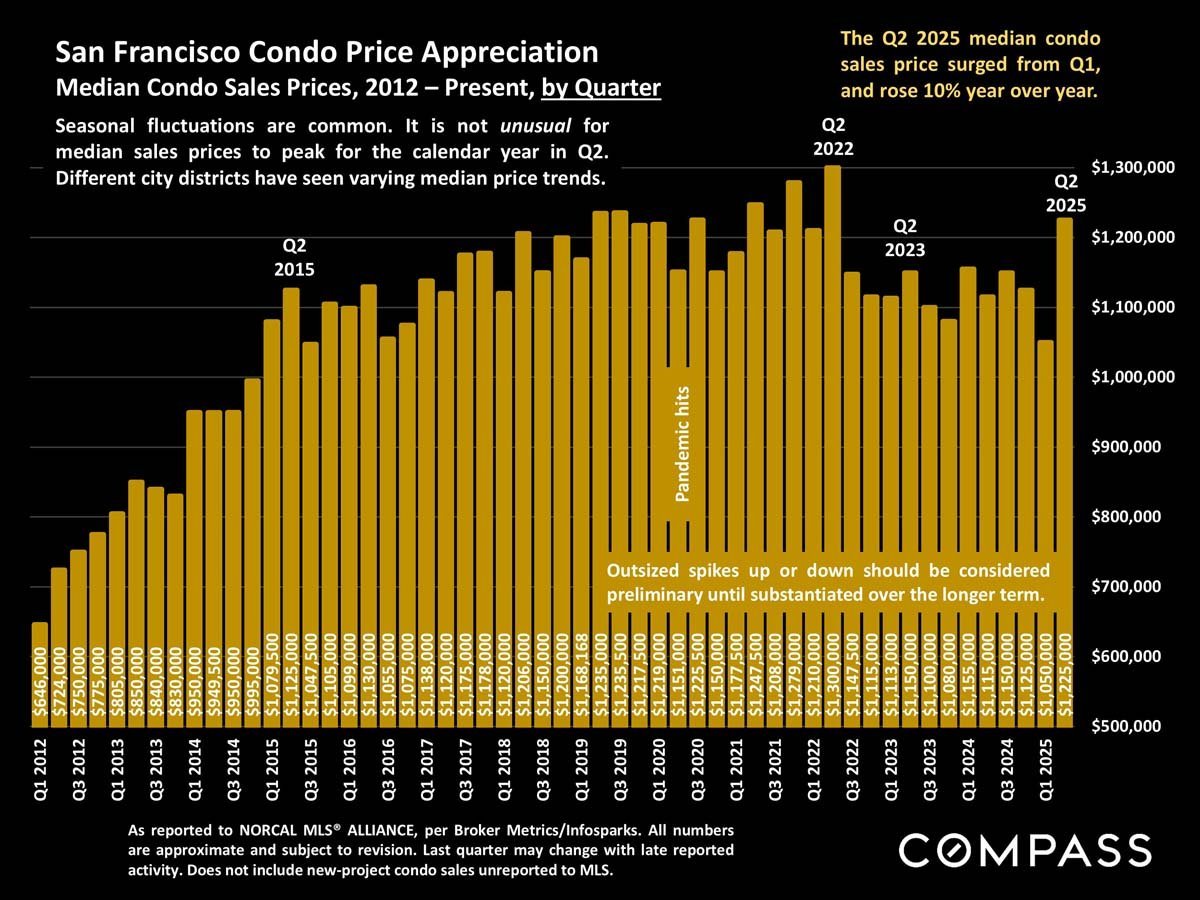
Chart of San Francisco condo prices by quarter, 2012–2025, with gold bars on a black background.
 
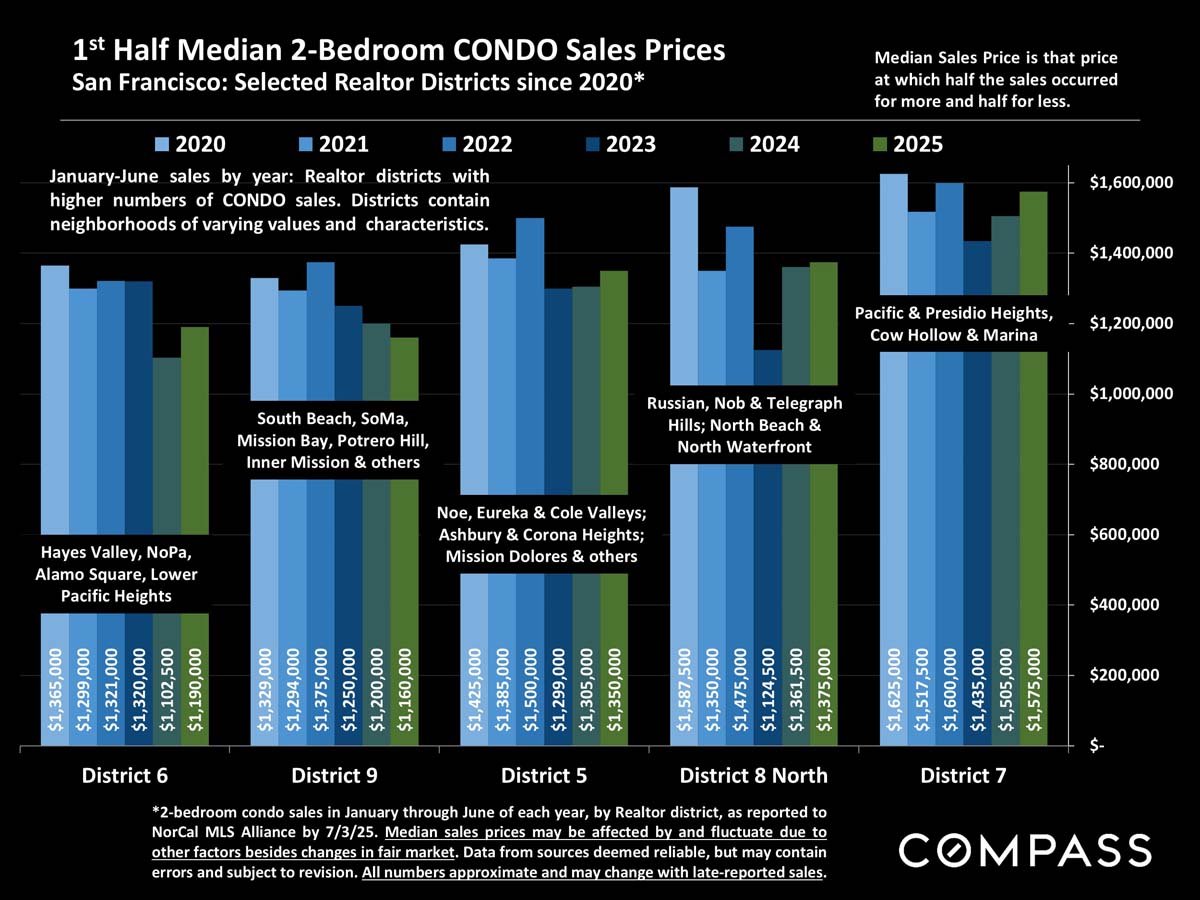
Chart comparing first-half two-bedroom condo sale prices across five San Francisco districts from 2020 to 2025.
 
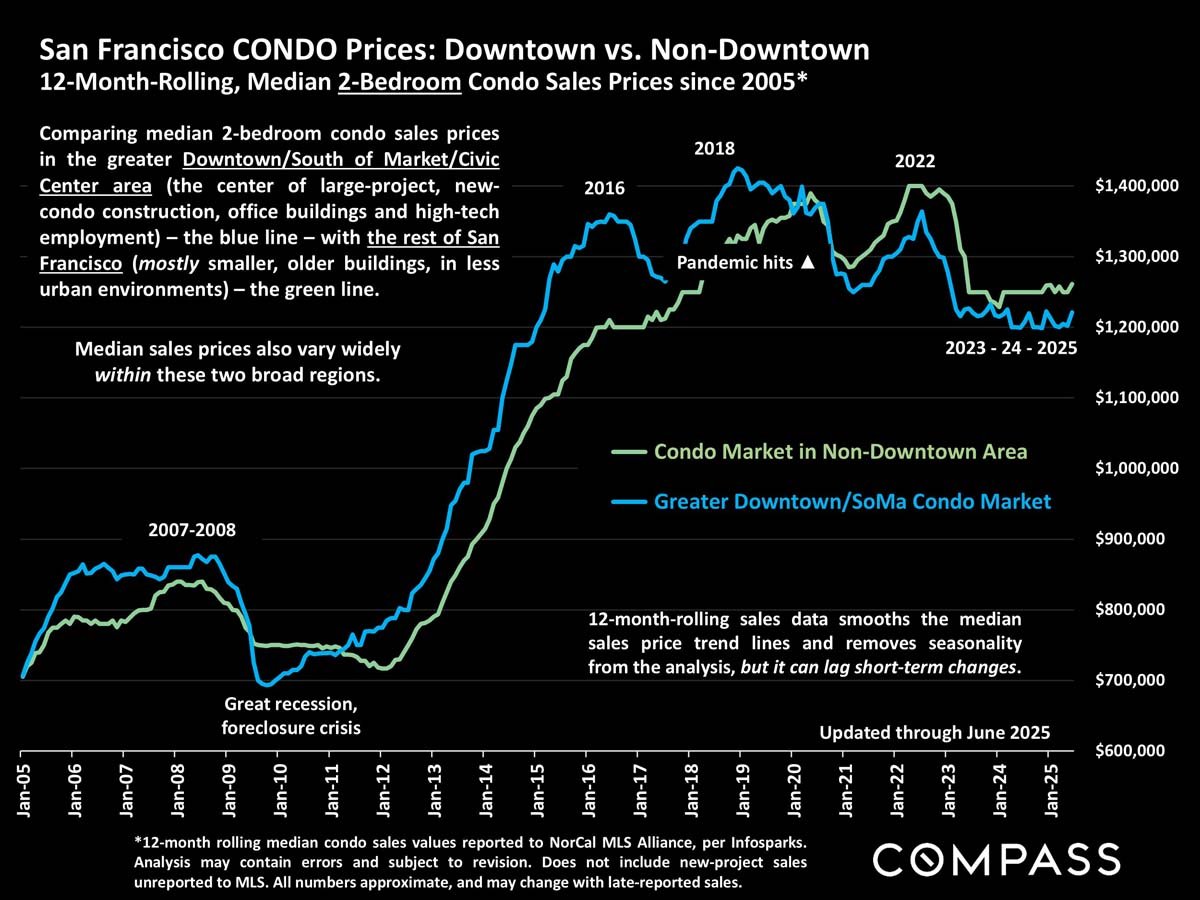
Chart compares San Francisco two-bedroom condo prices downtown and elsewhere, with trends from 2005 through June 2025.
 
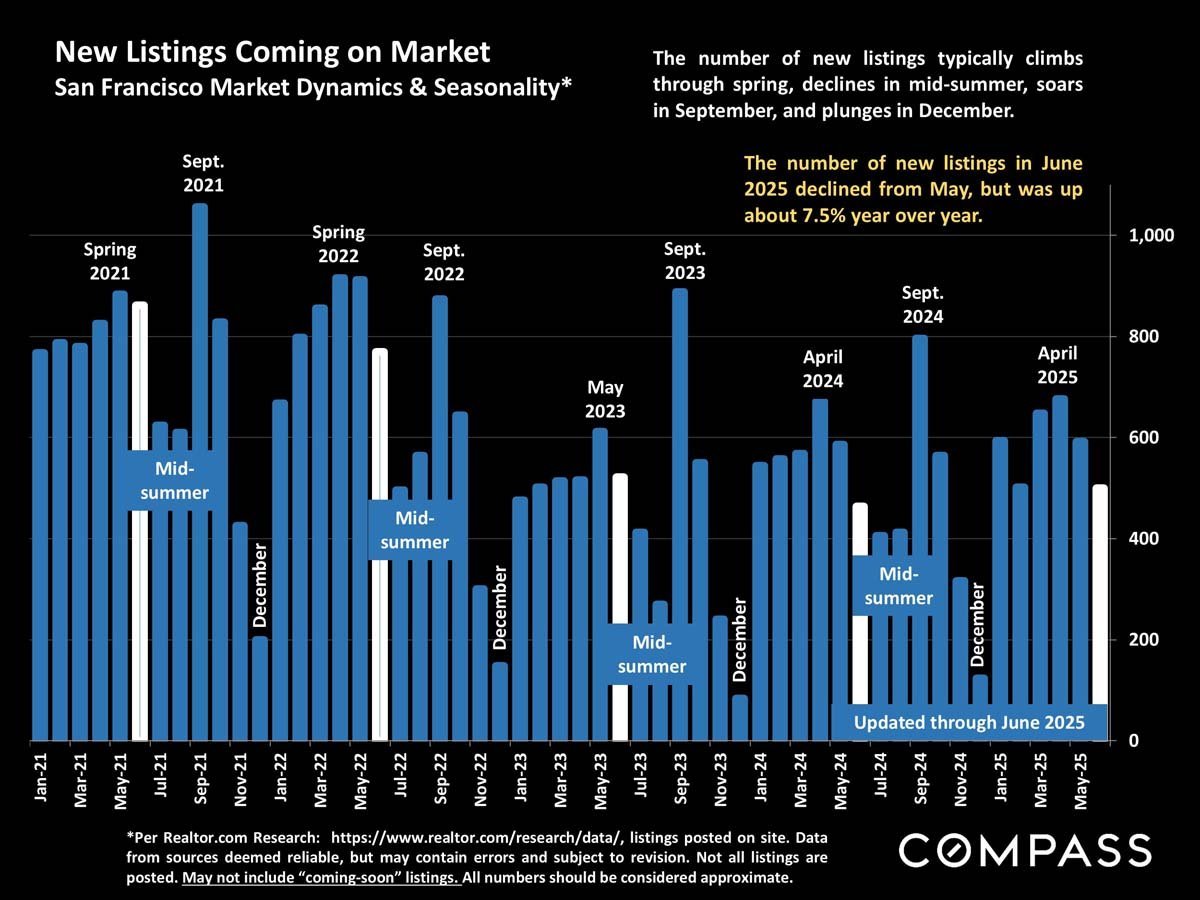
Bar chart of San Francisco new listings from 2021 to June 2025, showing seasonal peaks and a 7.5% year-over-year increase.
 
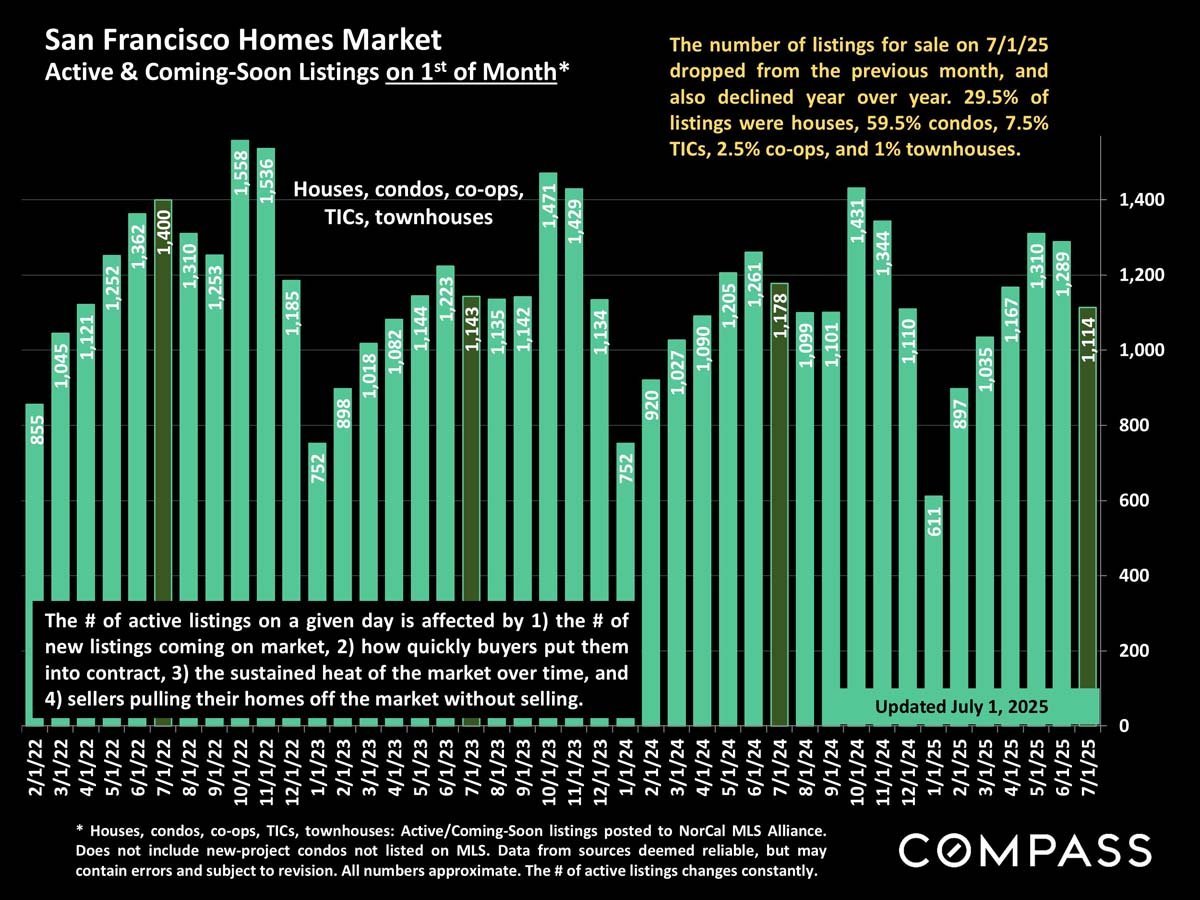
Chart of San Francisco active and coming-soon home listings by month, with July 2025 counts and listing composition.
 
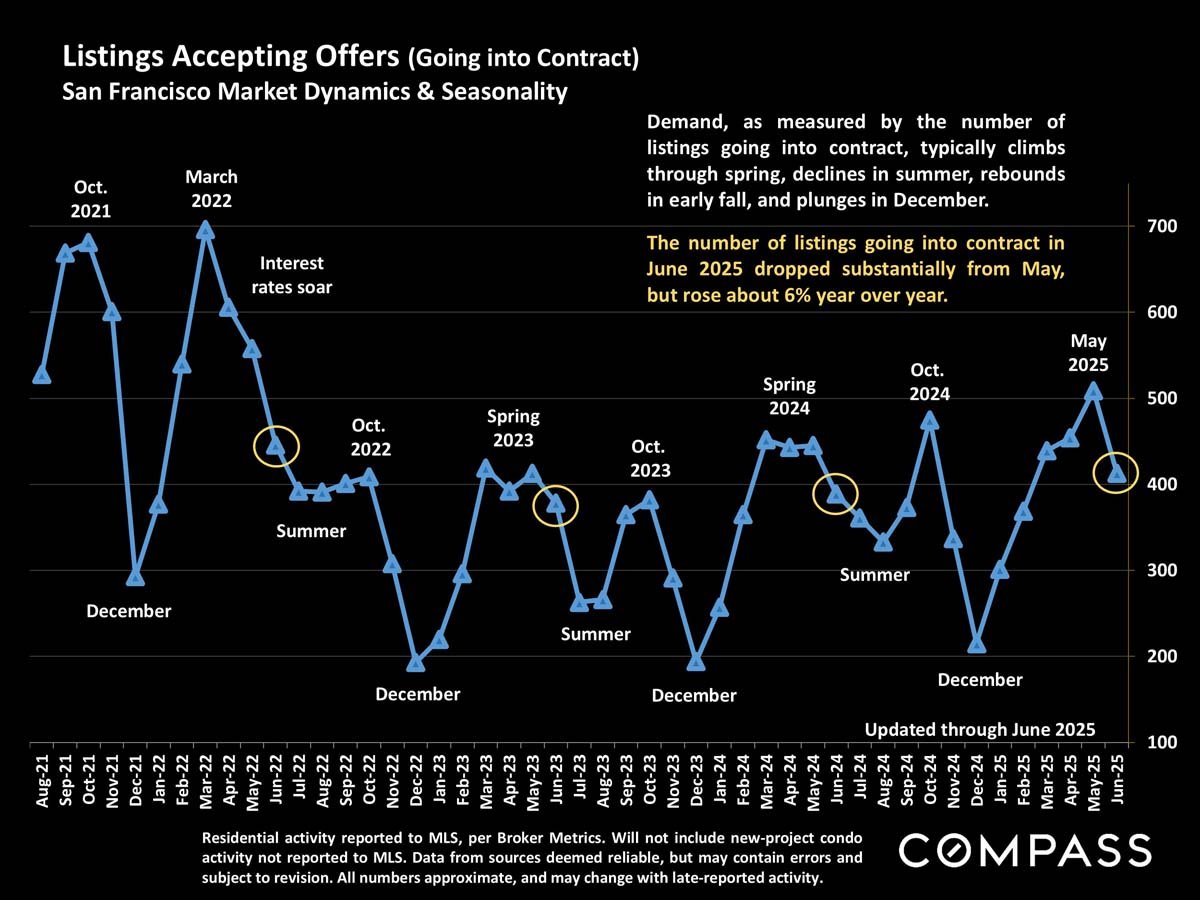
Chart of San Francisco listings going into contract, showing seasonal trends from August 2021 through June 2025.
 
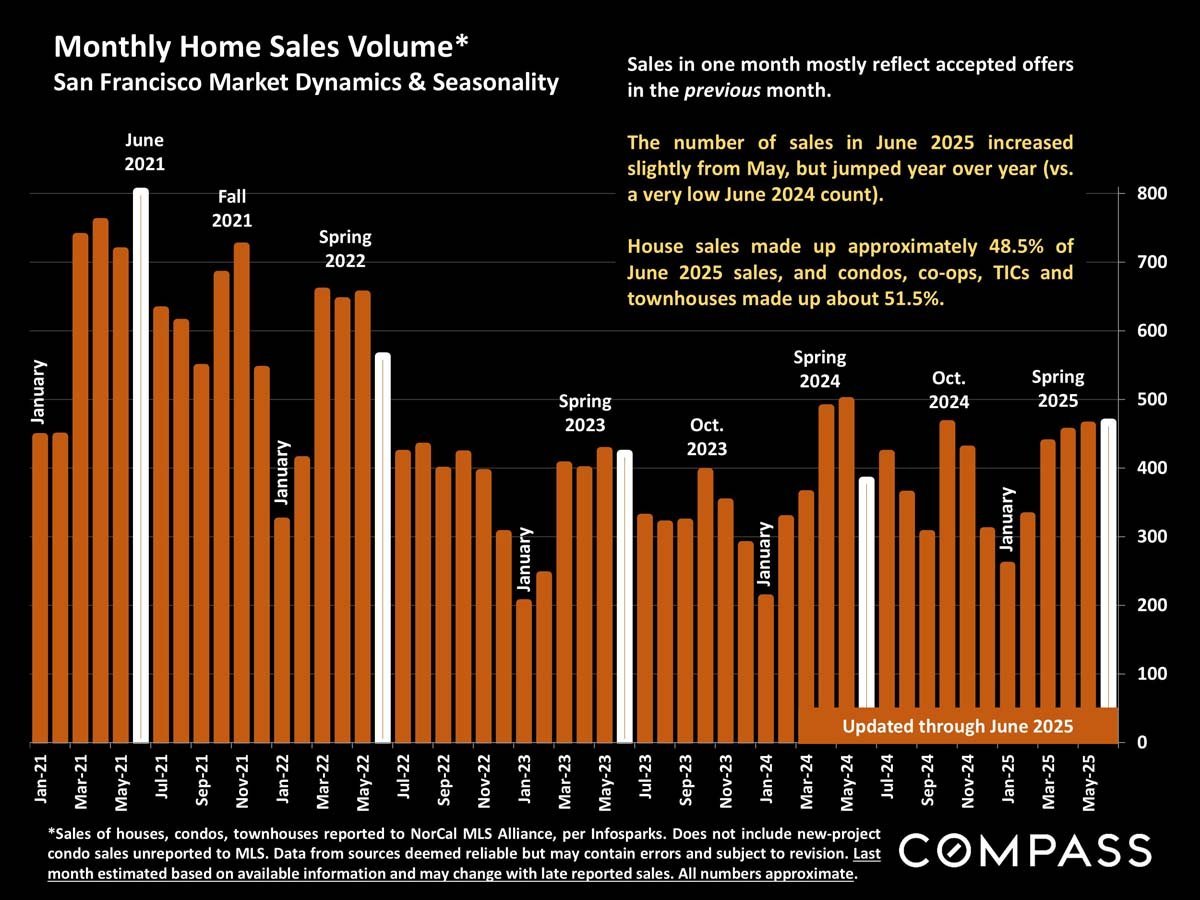
Chart of San Francisco monthly home sales, January 2021–June 2025, with seasonal trends and June 2025 sales breakdown.
 
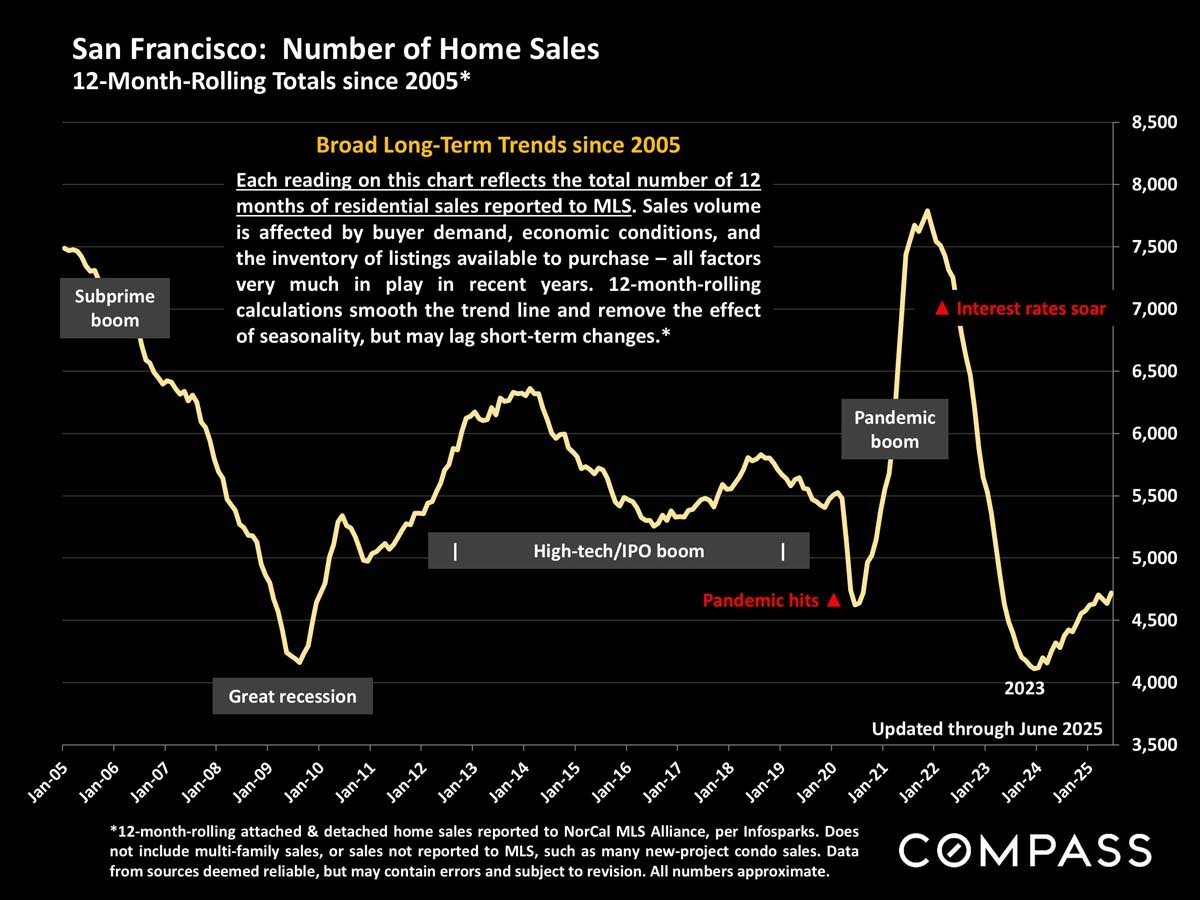
Chart of San Francisco home sales from 2005 to June 2025, with a pandemic-era peak and subsequent decline.
 
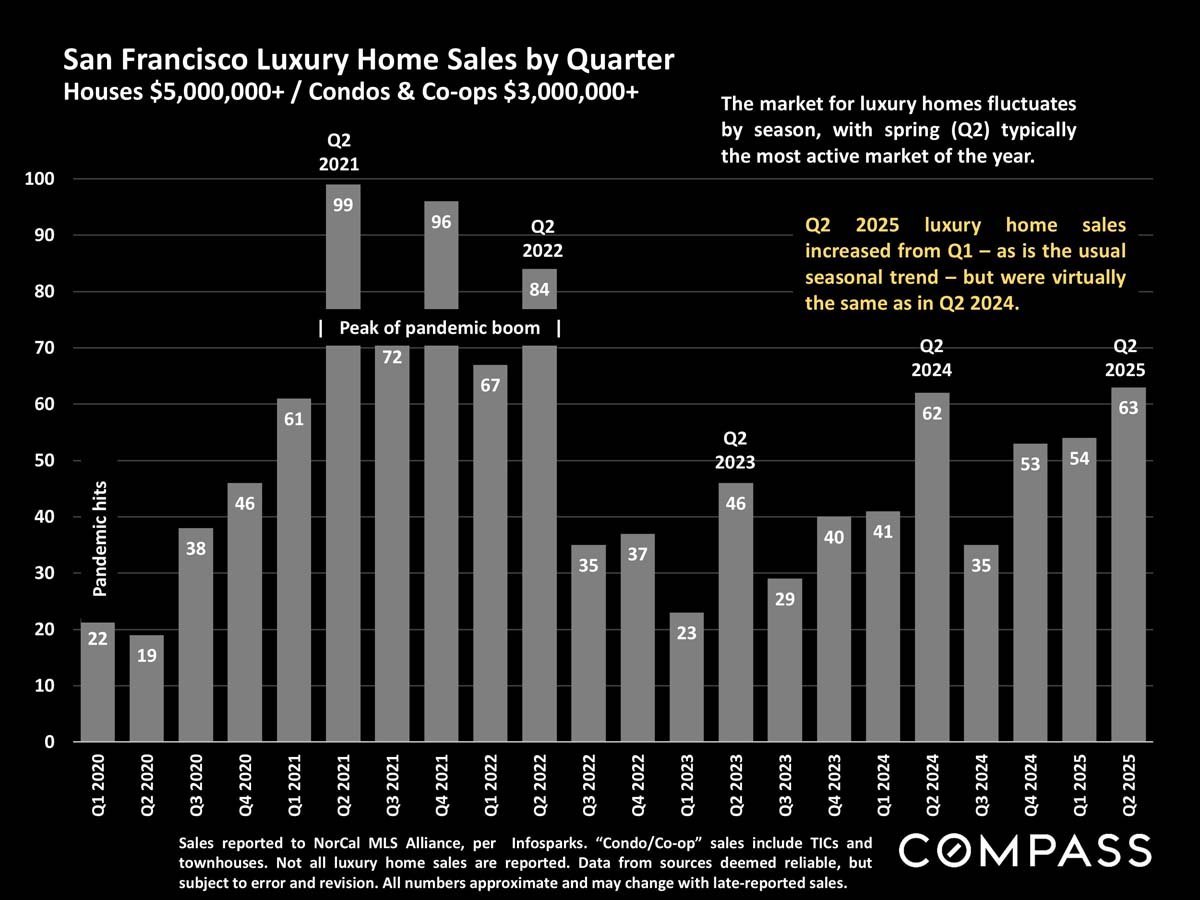
Chart of San Francisco luxury home sales by quarter from Q1 2020 through Q2 2025, with a pandemic-era peak.
 
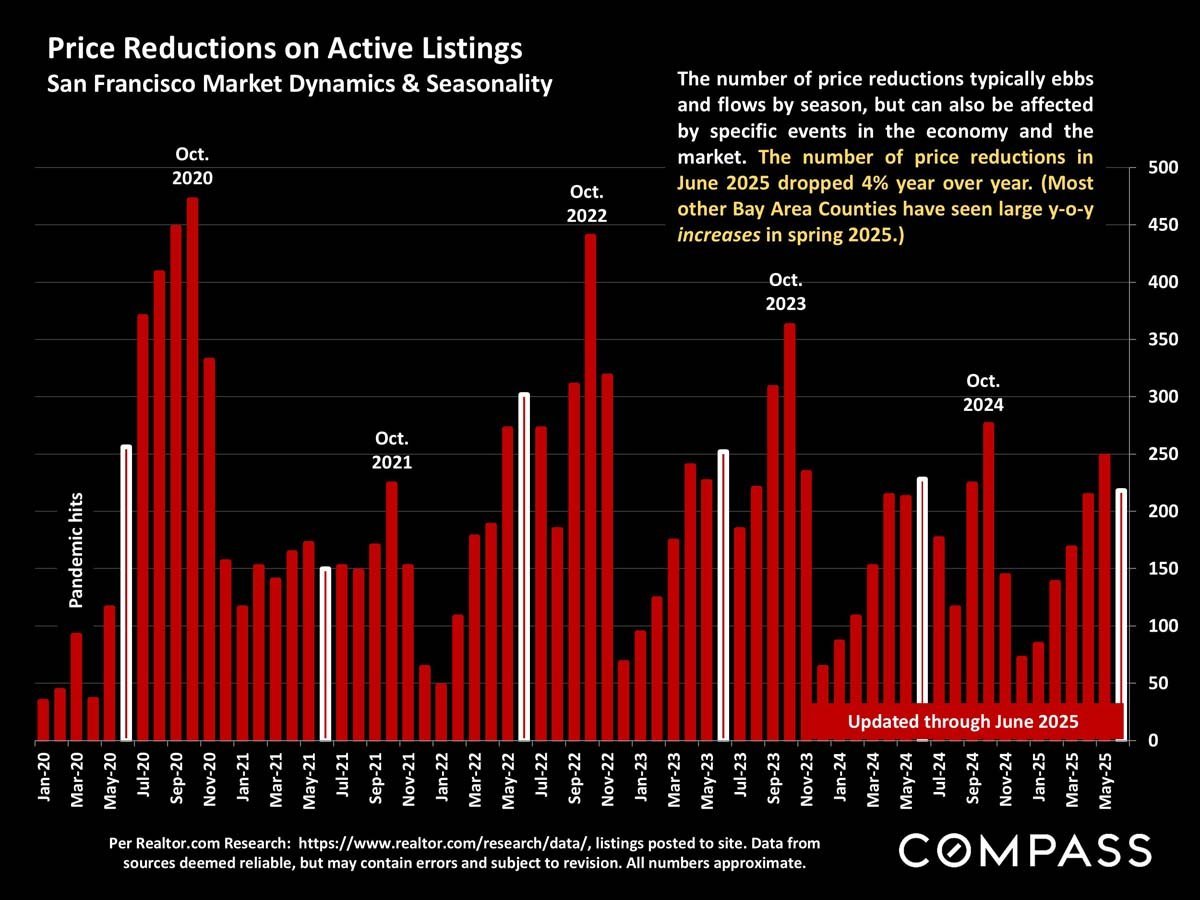
Bar chart of San Francisco active-listing price reductions, with seasonal peaks and a 4% year-over-year decline in June 2025.
 
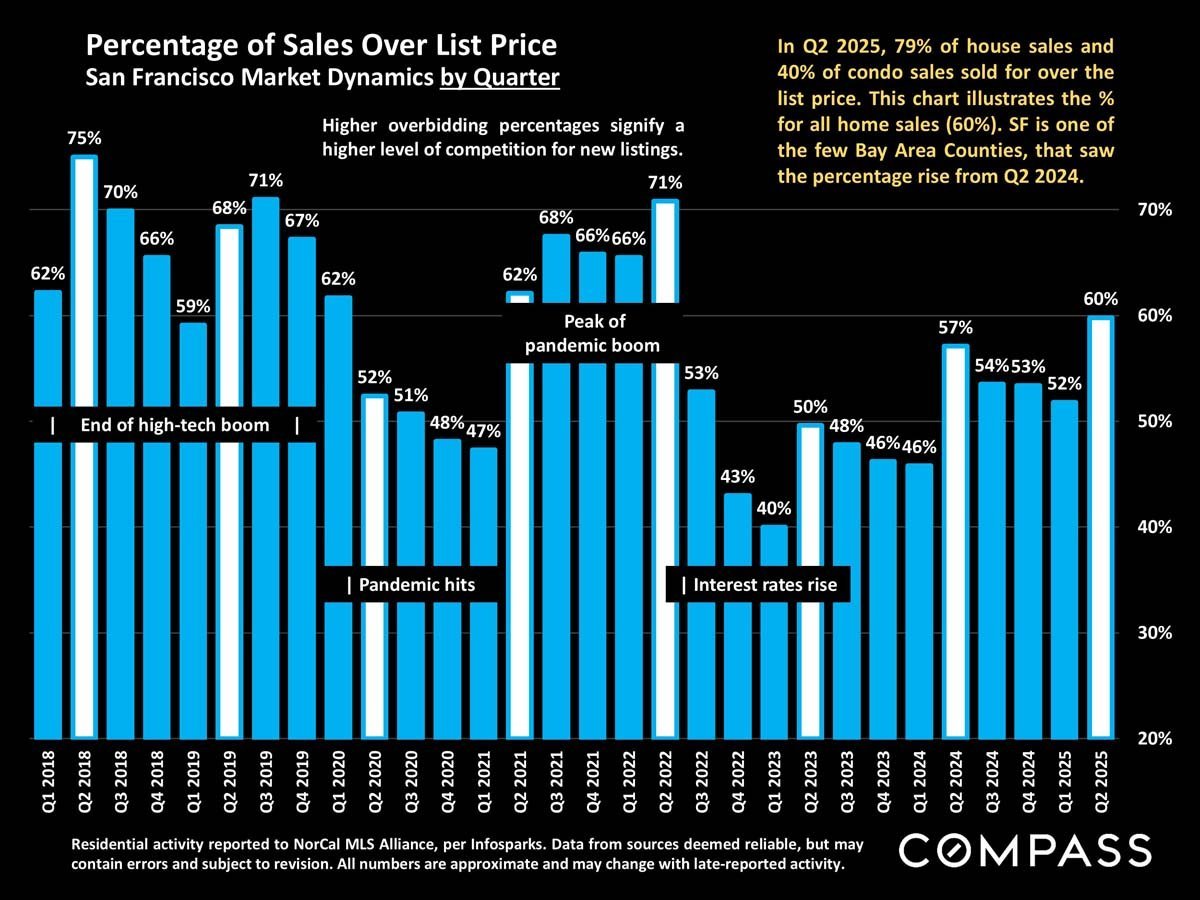
San Francisco quarterly chart of home sales over list price, showing 60% in Q2 2025.
 
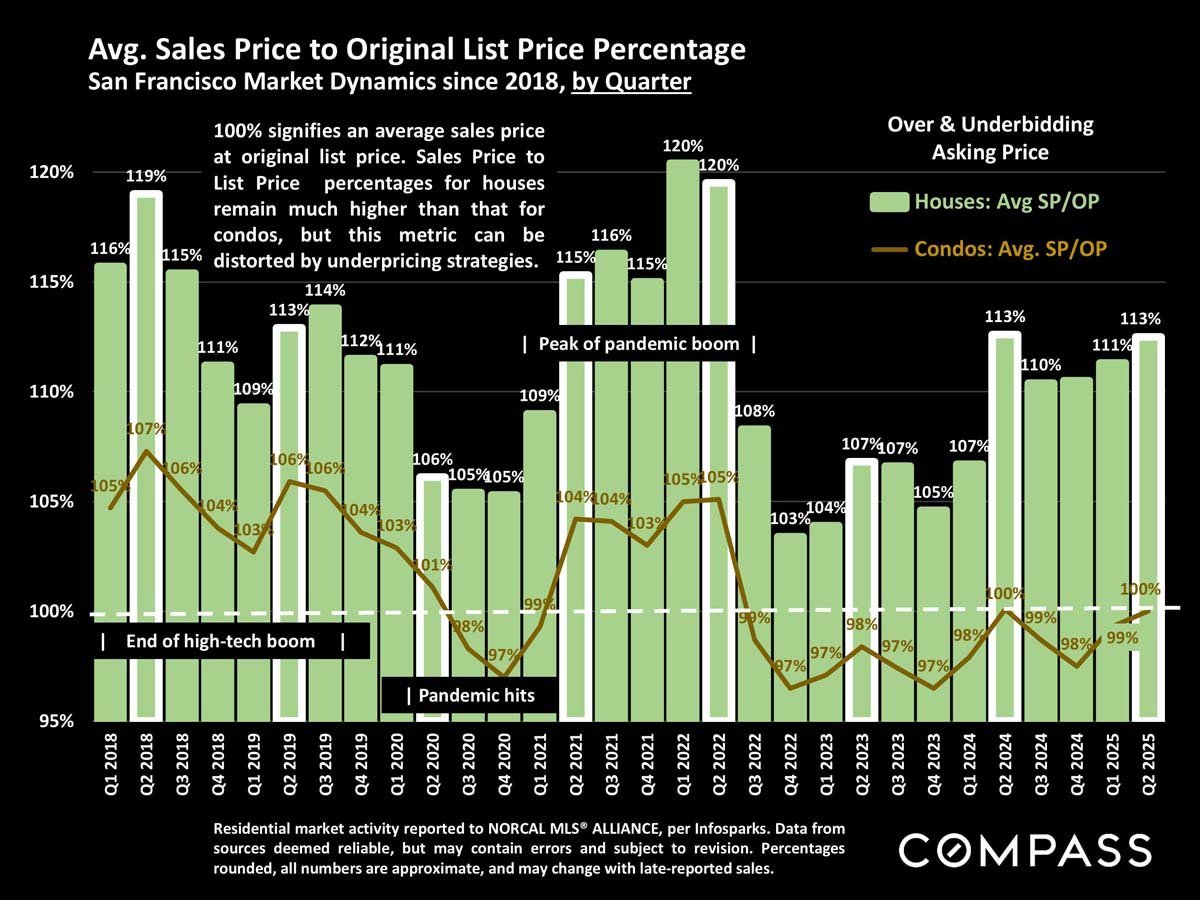
Chart of San Francisco sale-to-list price percentages for houses and condos by quarter, 2018–2025.
 
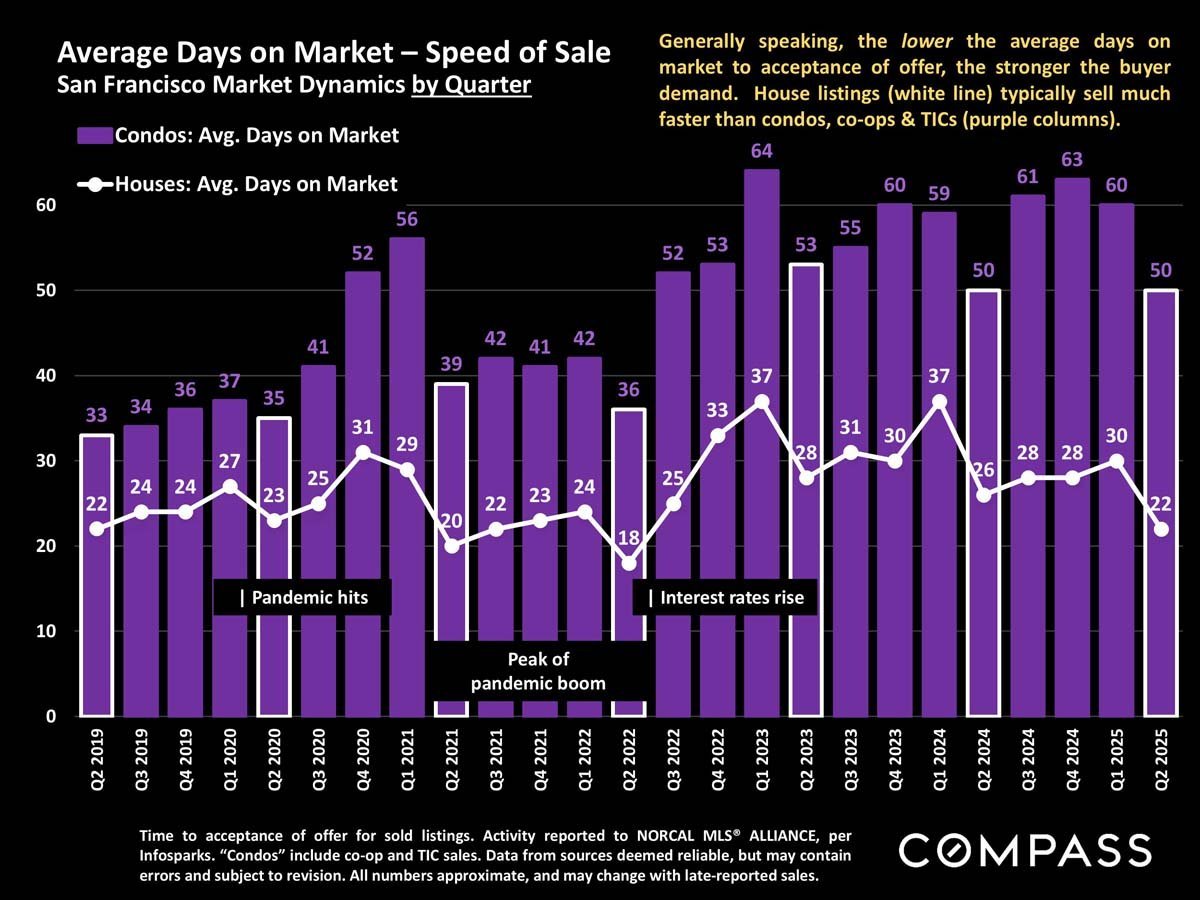
Chart comparing average days on market for San Francisco condos and houses by quarter, 2019–2025.
 
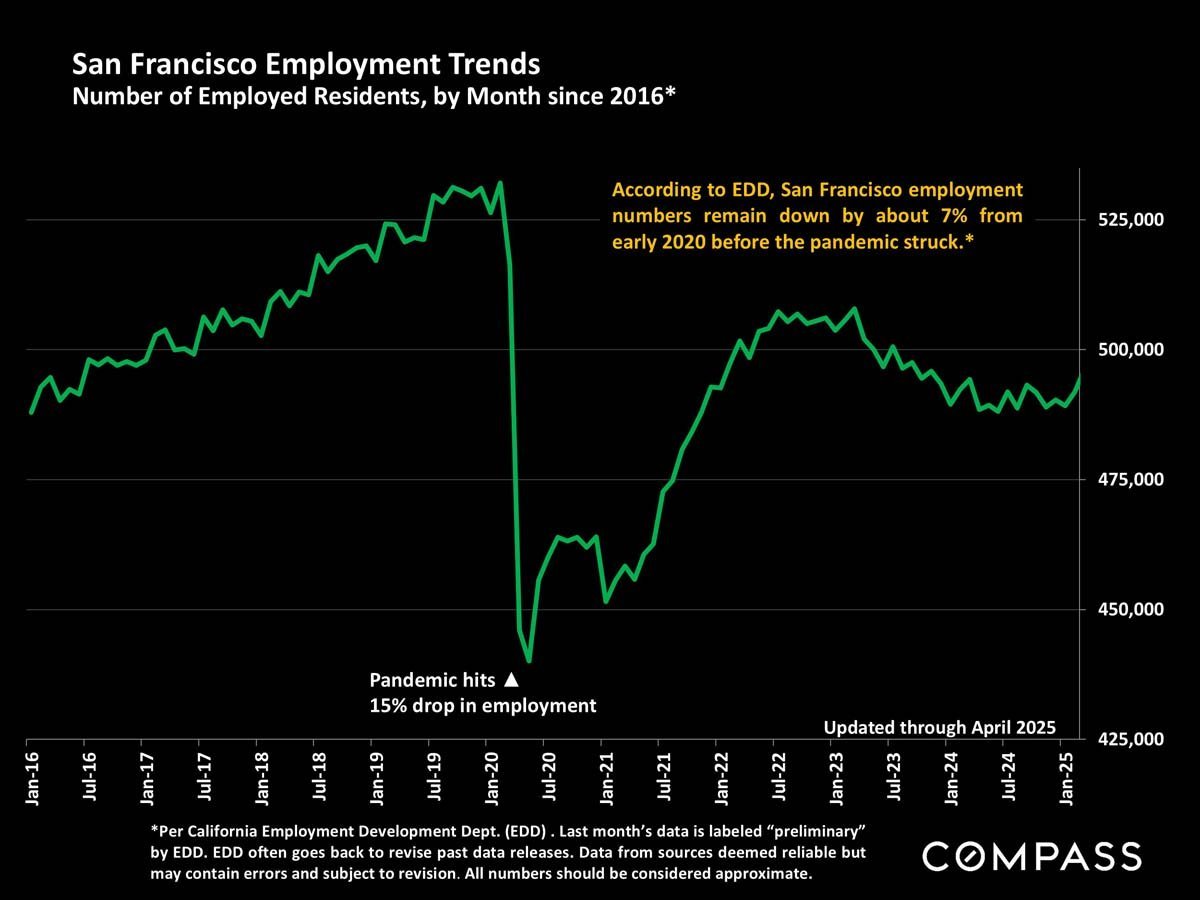
Chart of San Francisco employment from 2016 to April 2025, including a sharp pandemic-era drop and subsequent recovery.
 
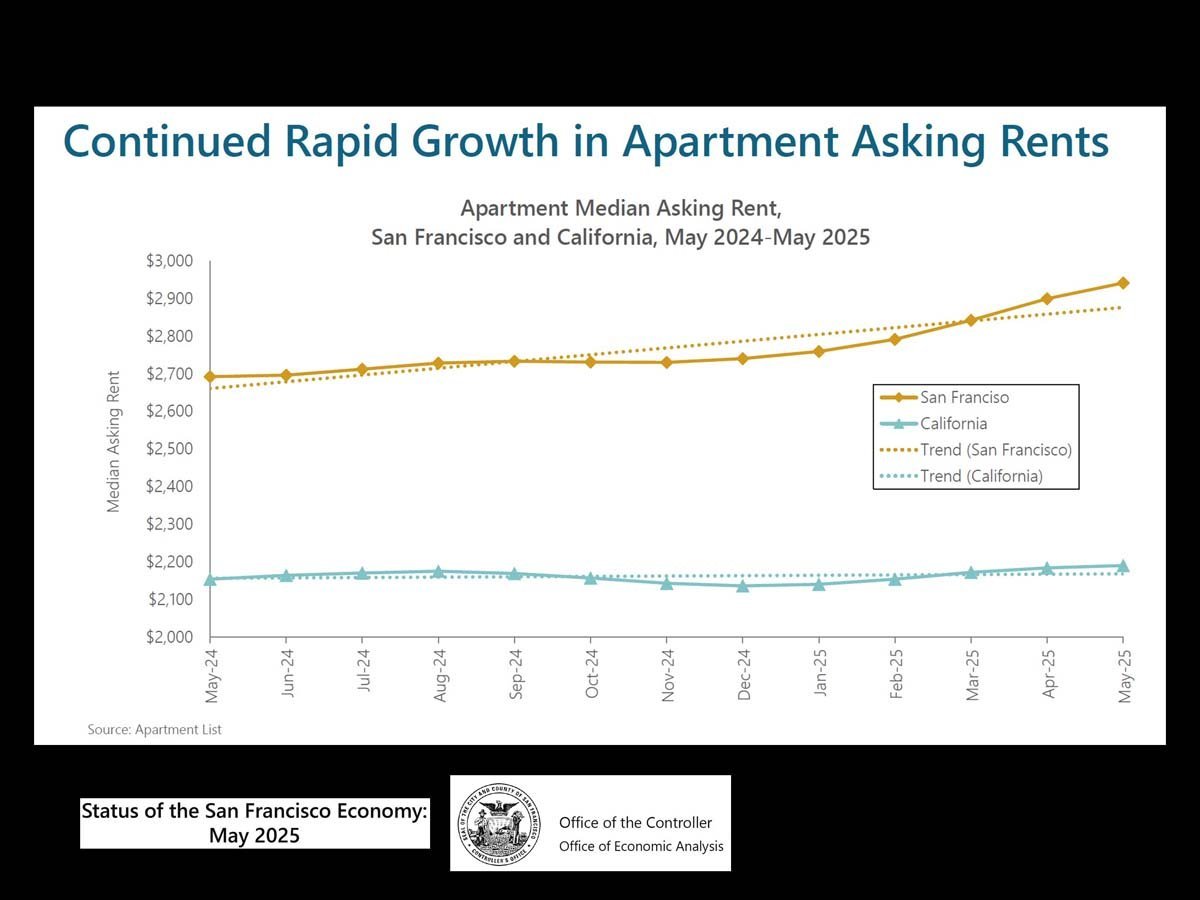
Line chart comparing San Francisco and California apartment asking rents, May 2024–May 2025; San Francisco rents rise sharply.
 
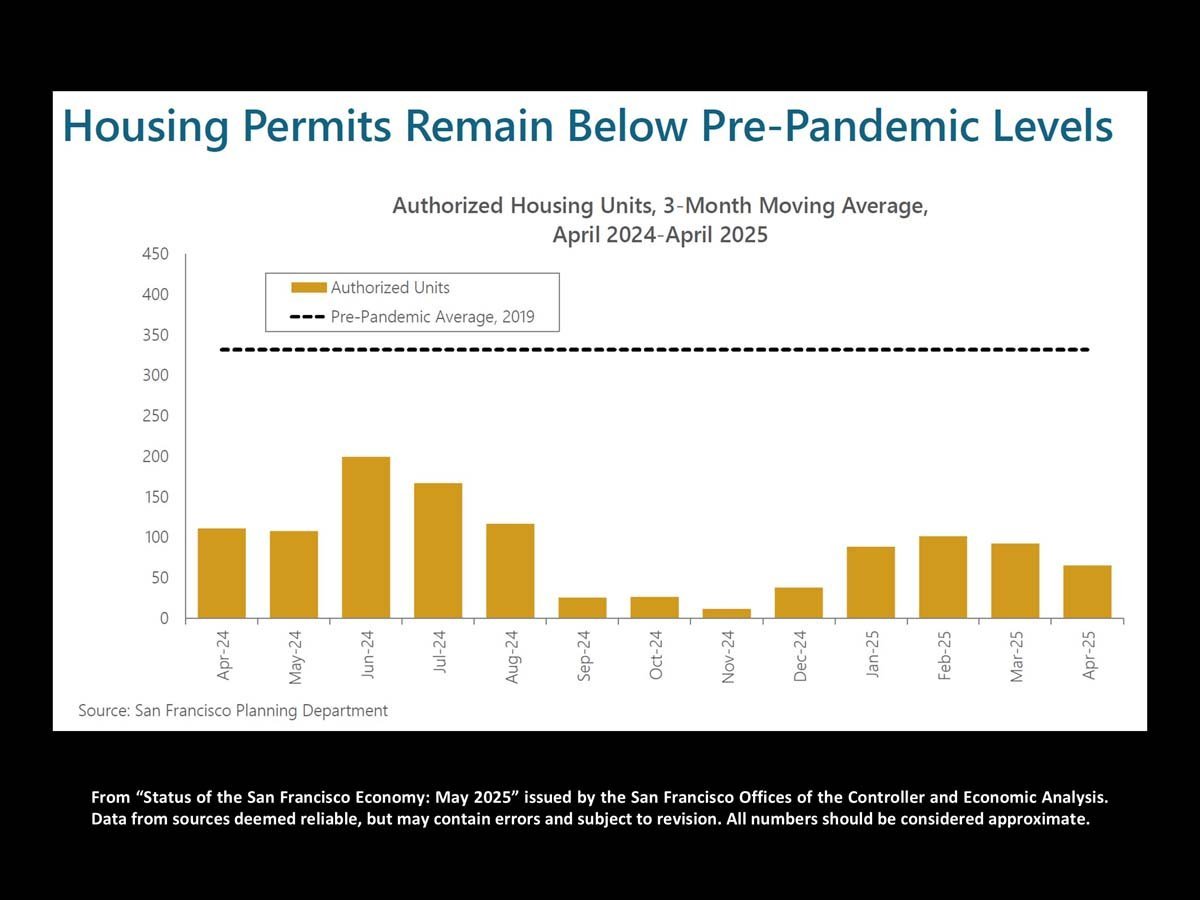
Chart showing San Francisco housing permits below the 2019 pre-pandemic average from April 2024 to April 2025.
 
Real estate market statistics disclaimer, definitions, Creative Commons photo notice, and Compass legal disclaimer.

Work With Jane

Get assistance in determining the current property value, crafting a competitive offer, writing and negotiating a contract, and much more. Contact me today.

Follow Me on Instagram