San Francisco real estate November 2025 report cover, featuring an aerial city and bay view.

San Francisco Home Prices, Market Conditions & Trends November 2025

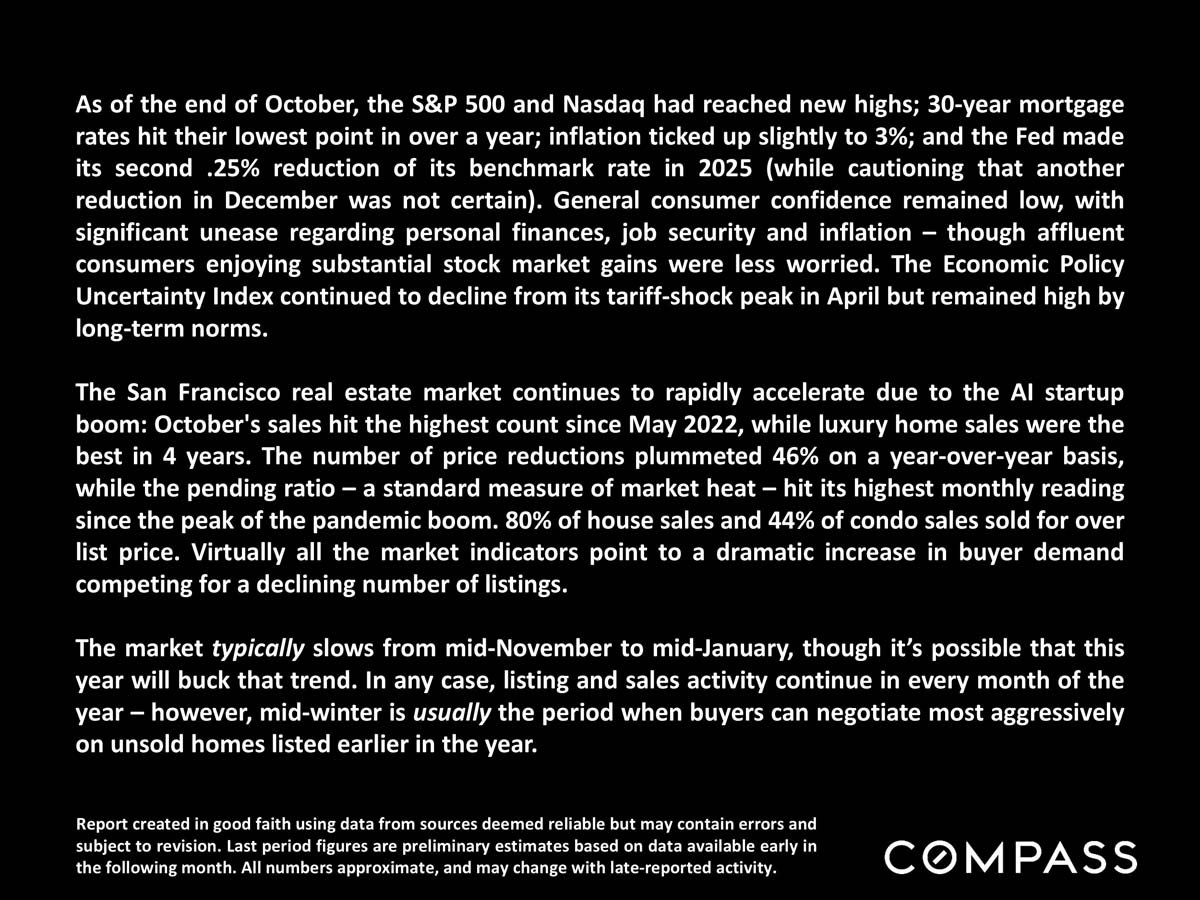
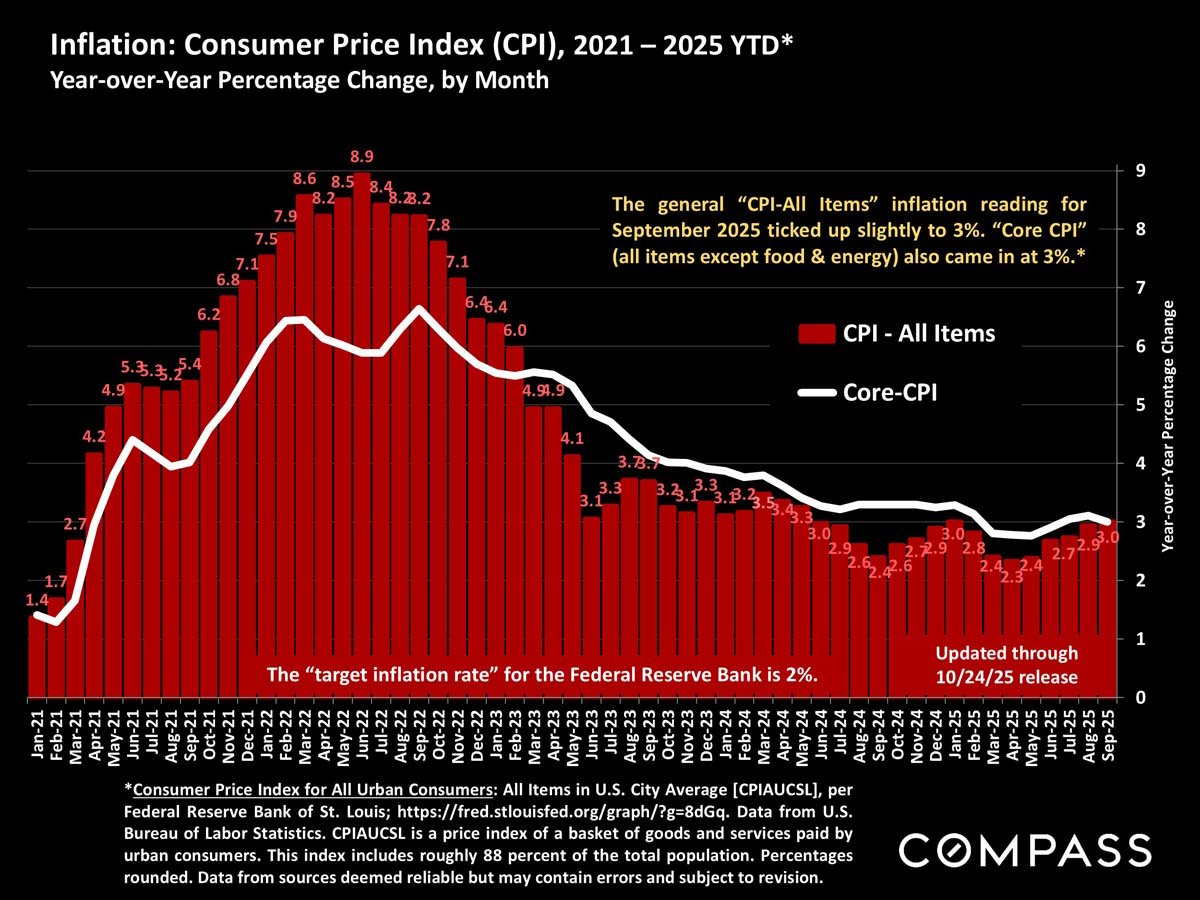
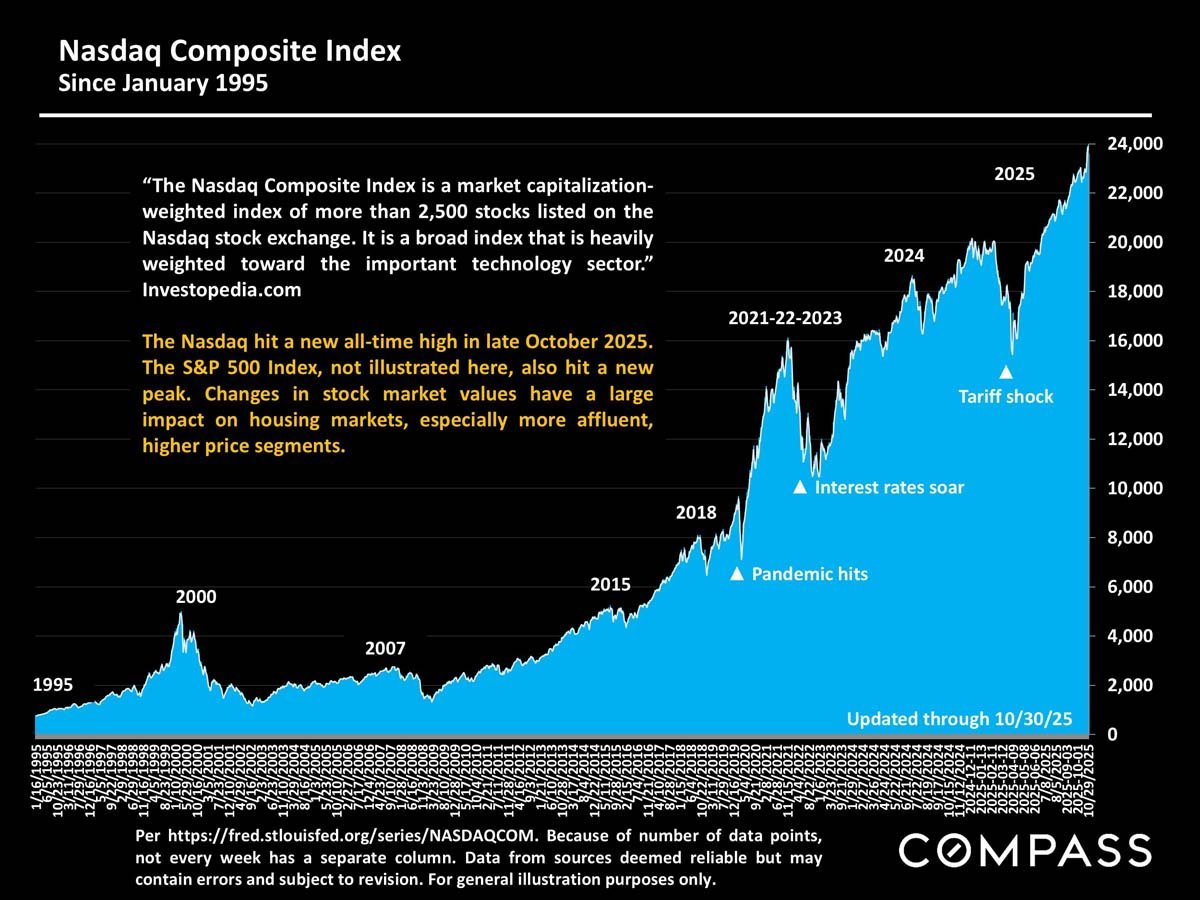
As of the end of October, the S&P 500 and Nasdaq had reached new highs; 30-year mortgage rates hit their lowest point in over a year; inflation ticked up slightly to 3%; and the Fed made its second .25% reduction of its benchmark rate in 2025 (while cautioning that another reduction in December was not certain).


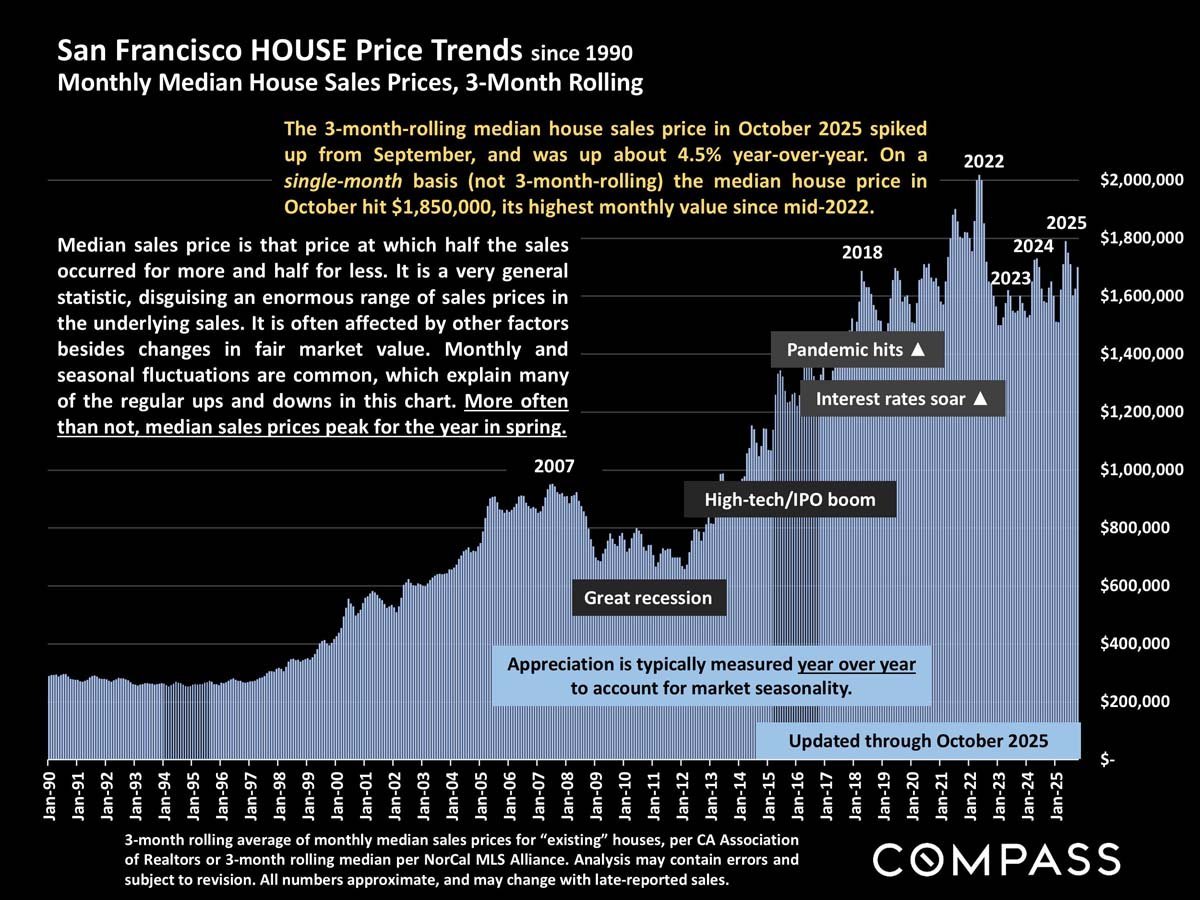
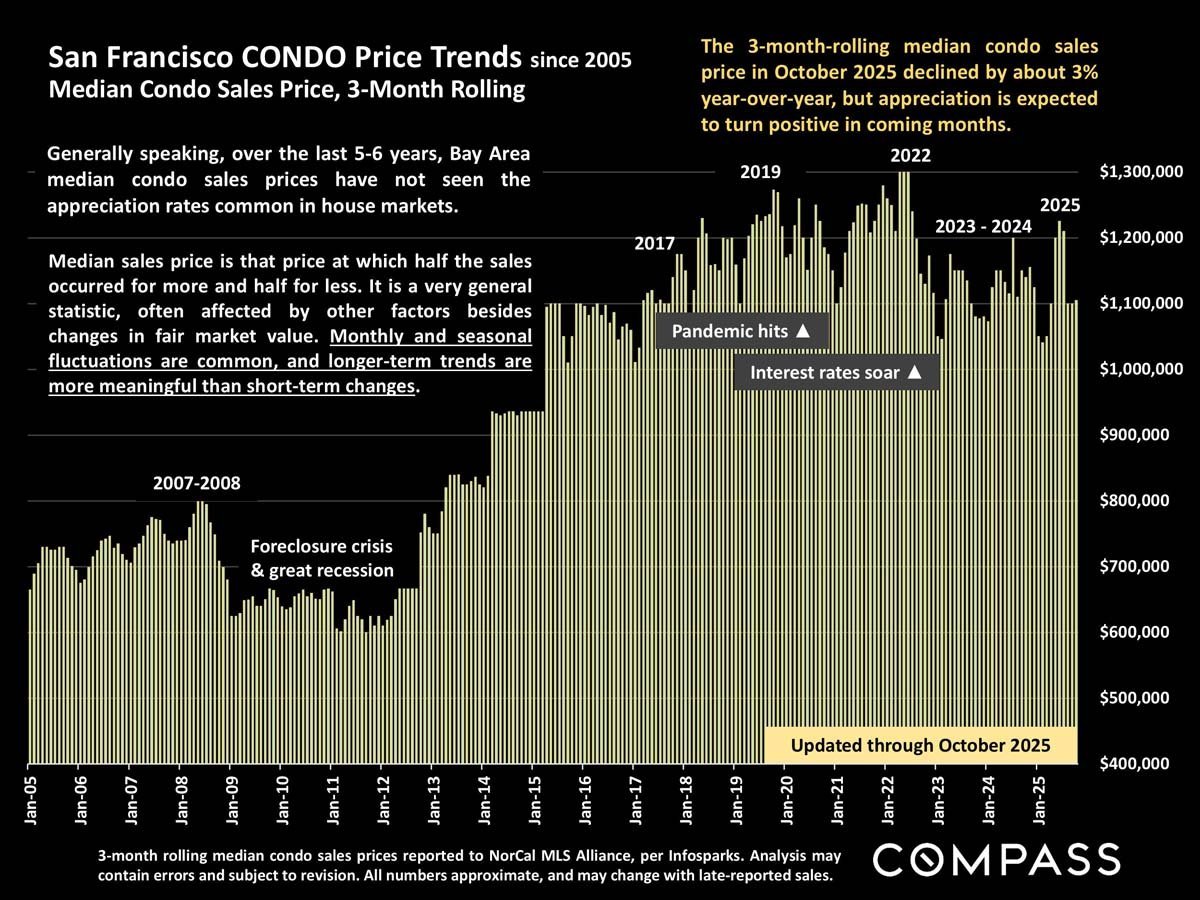
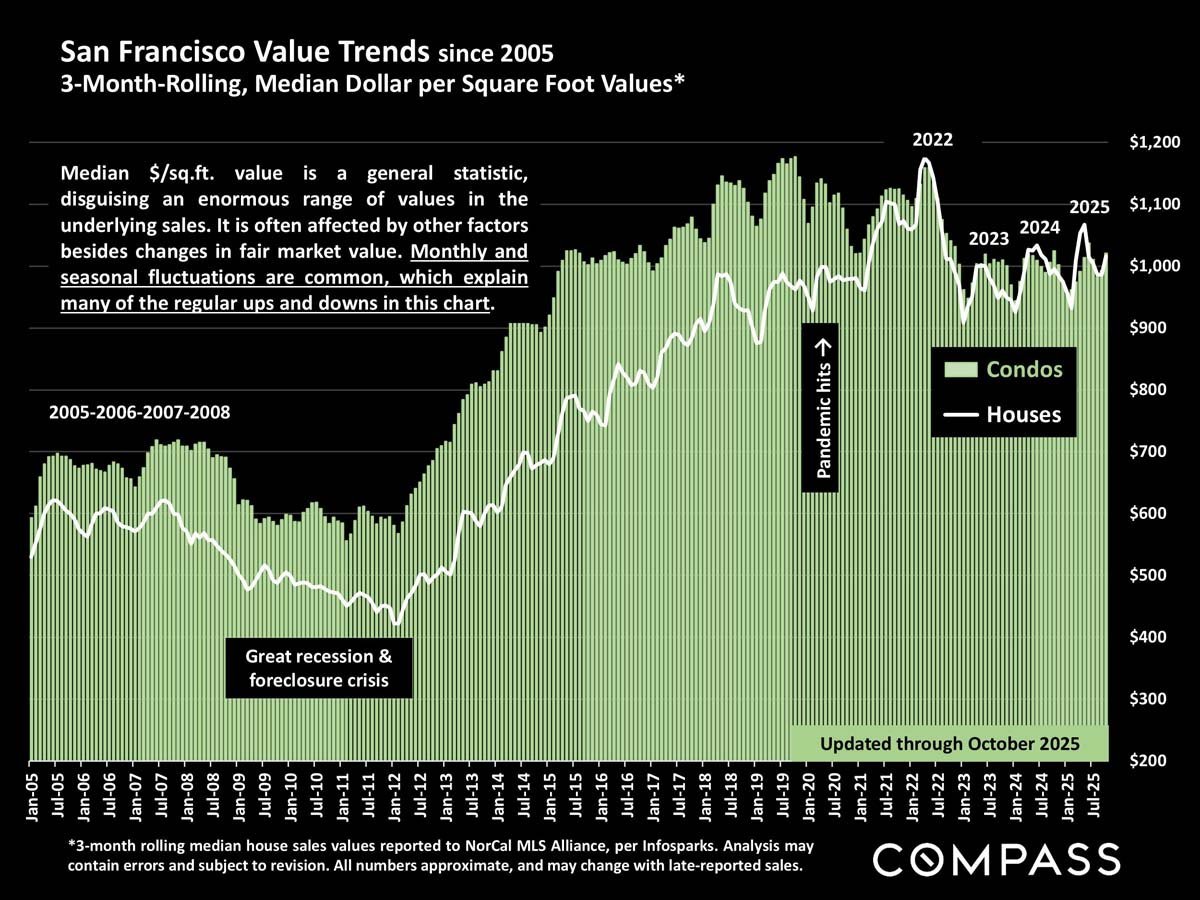
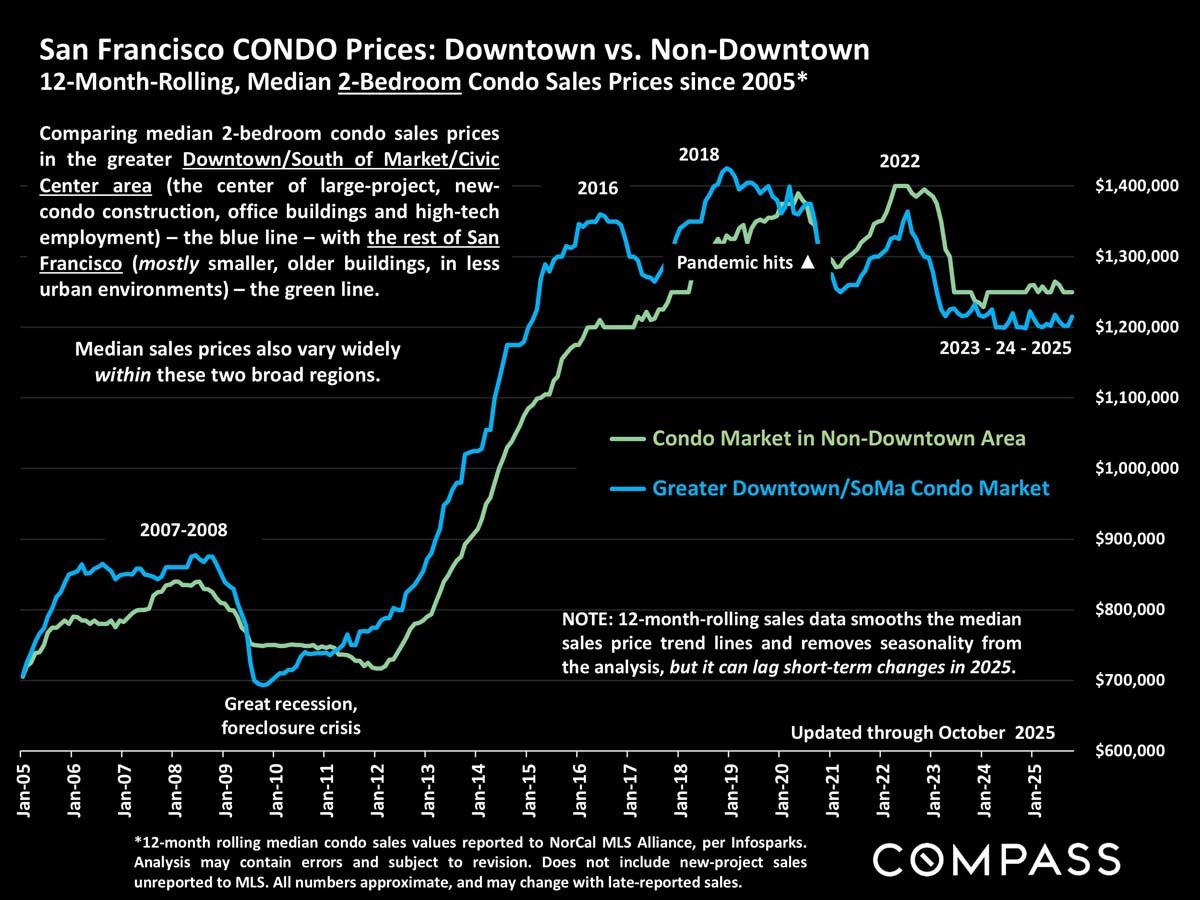
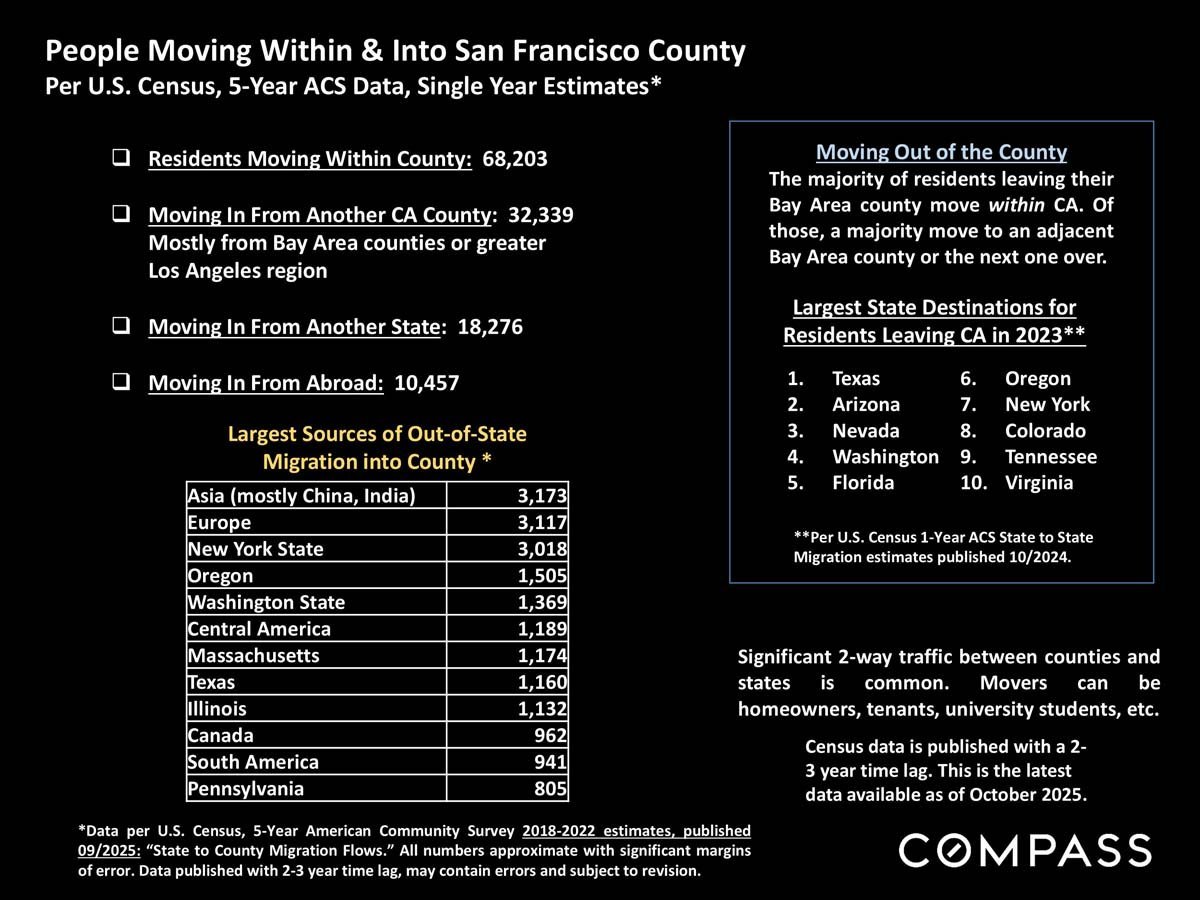
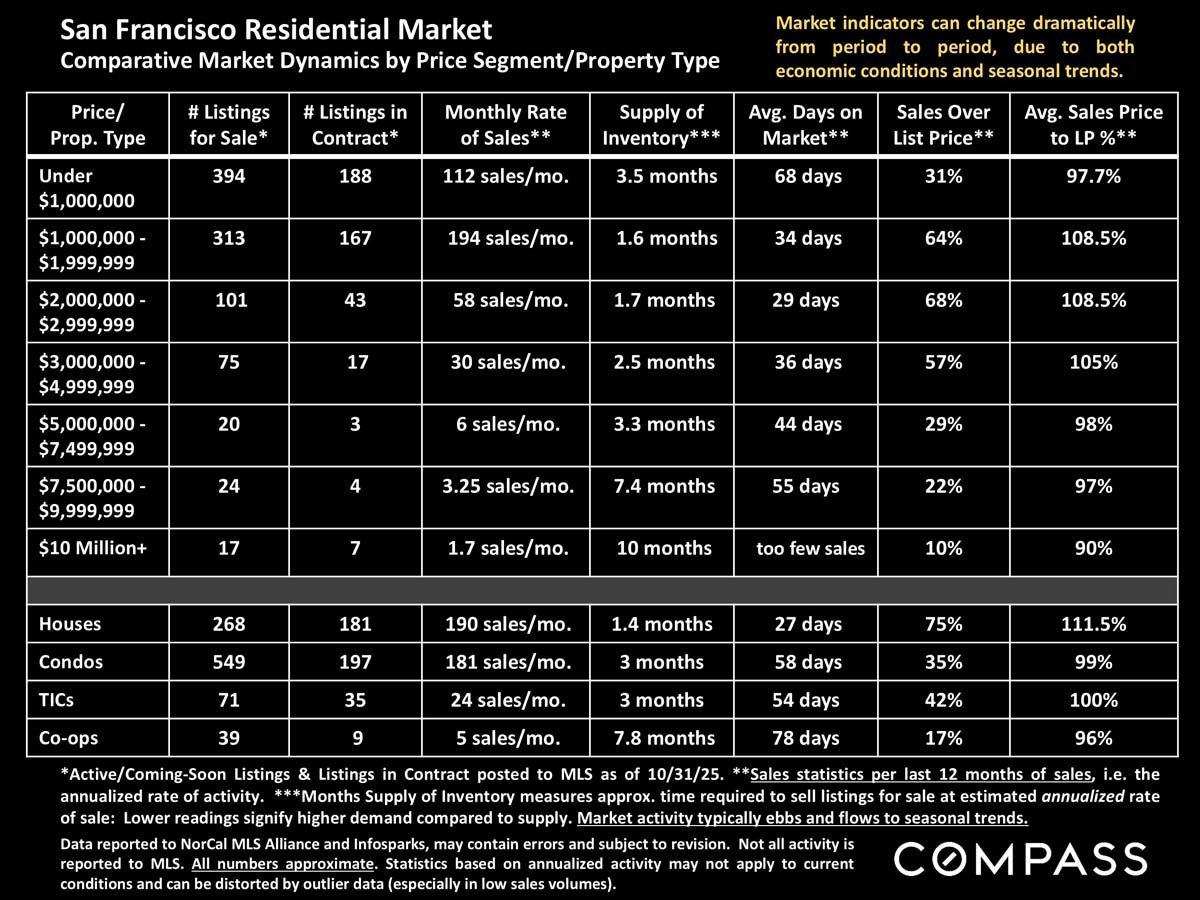
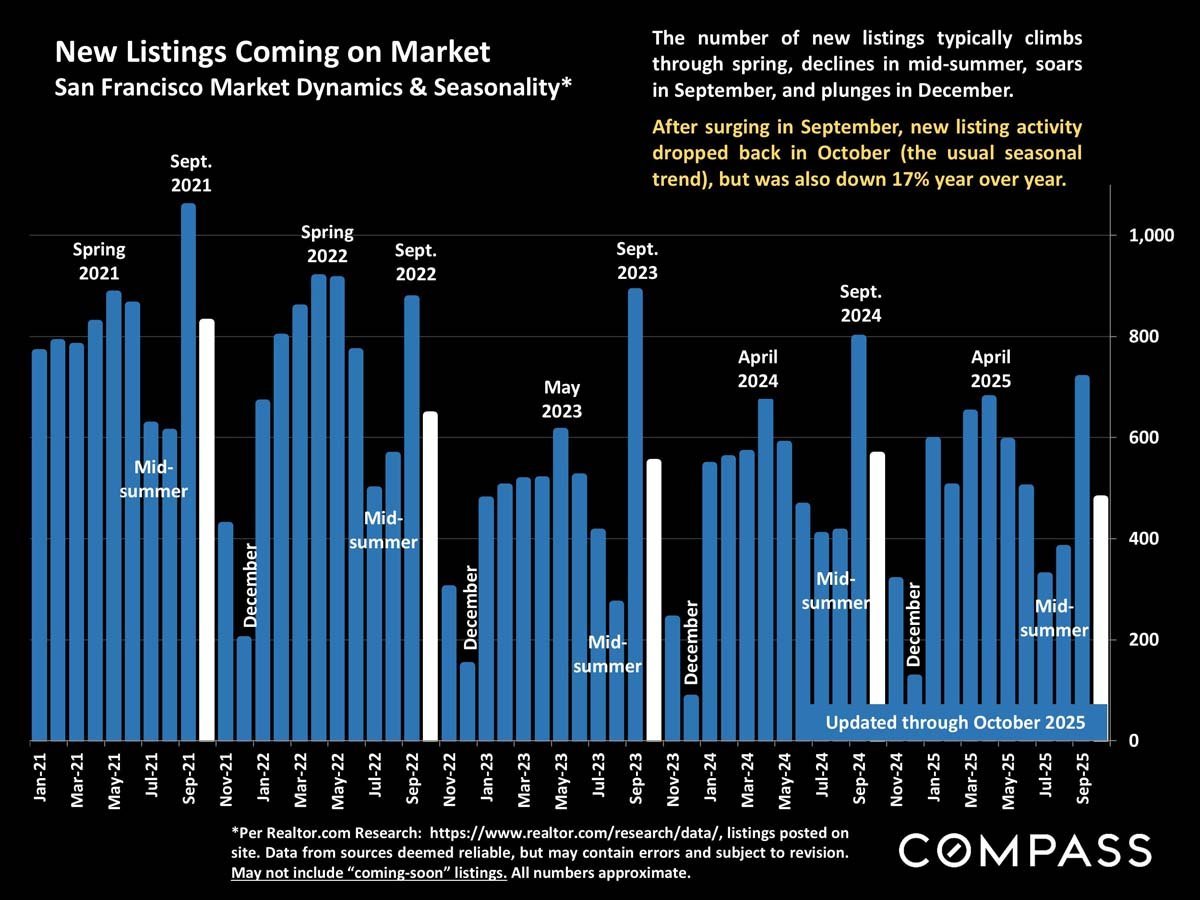
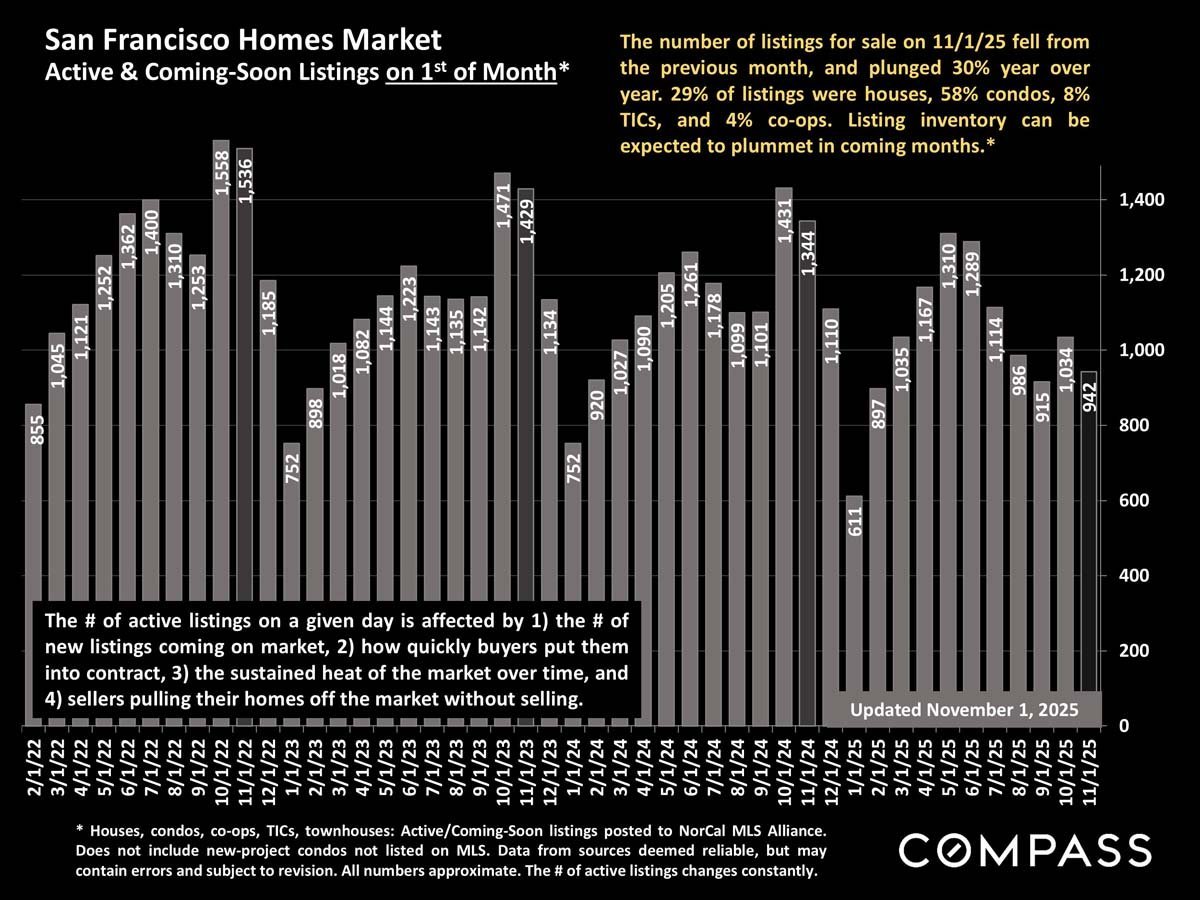
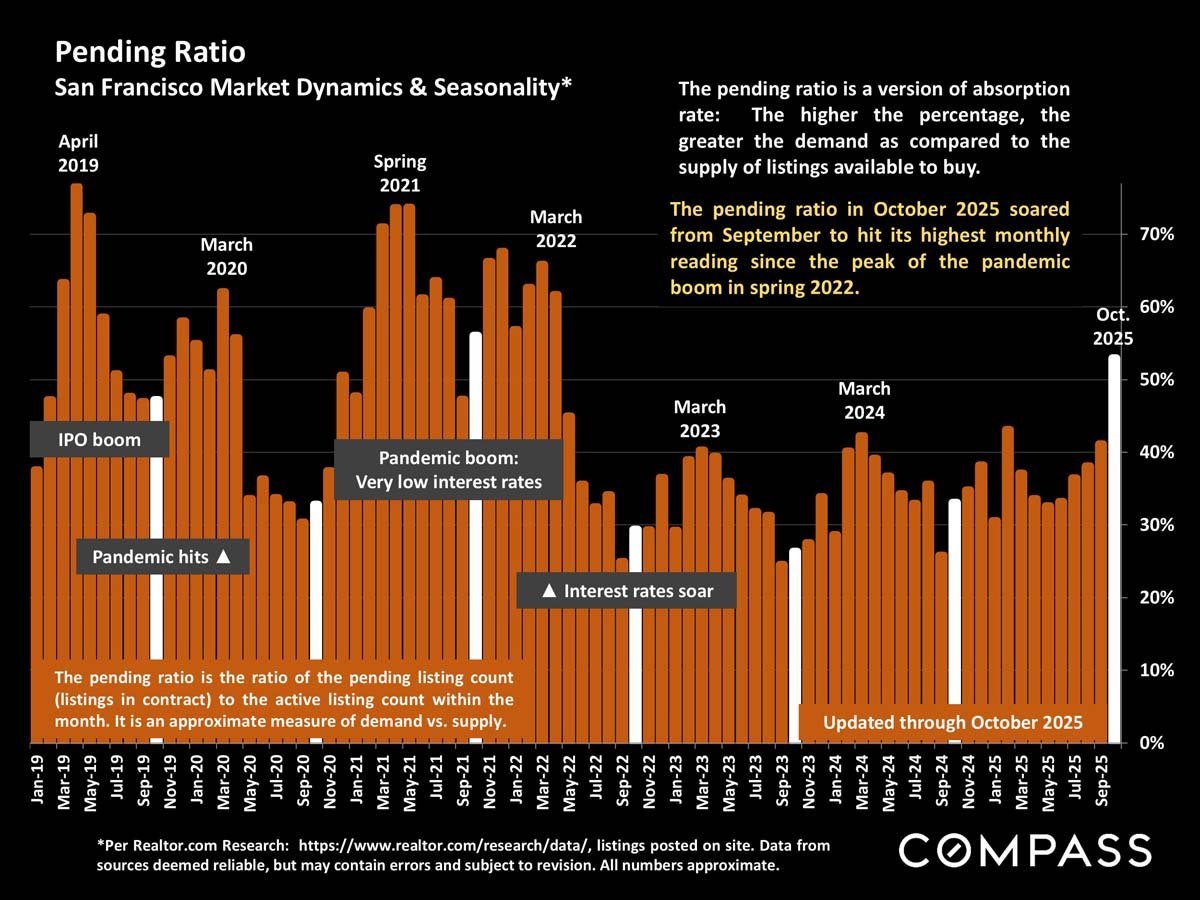
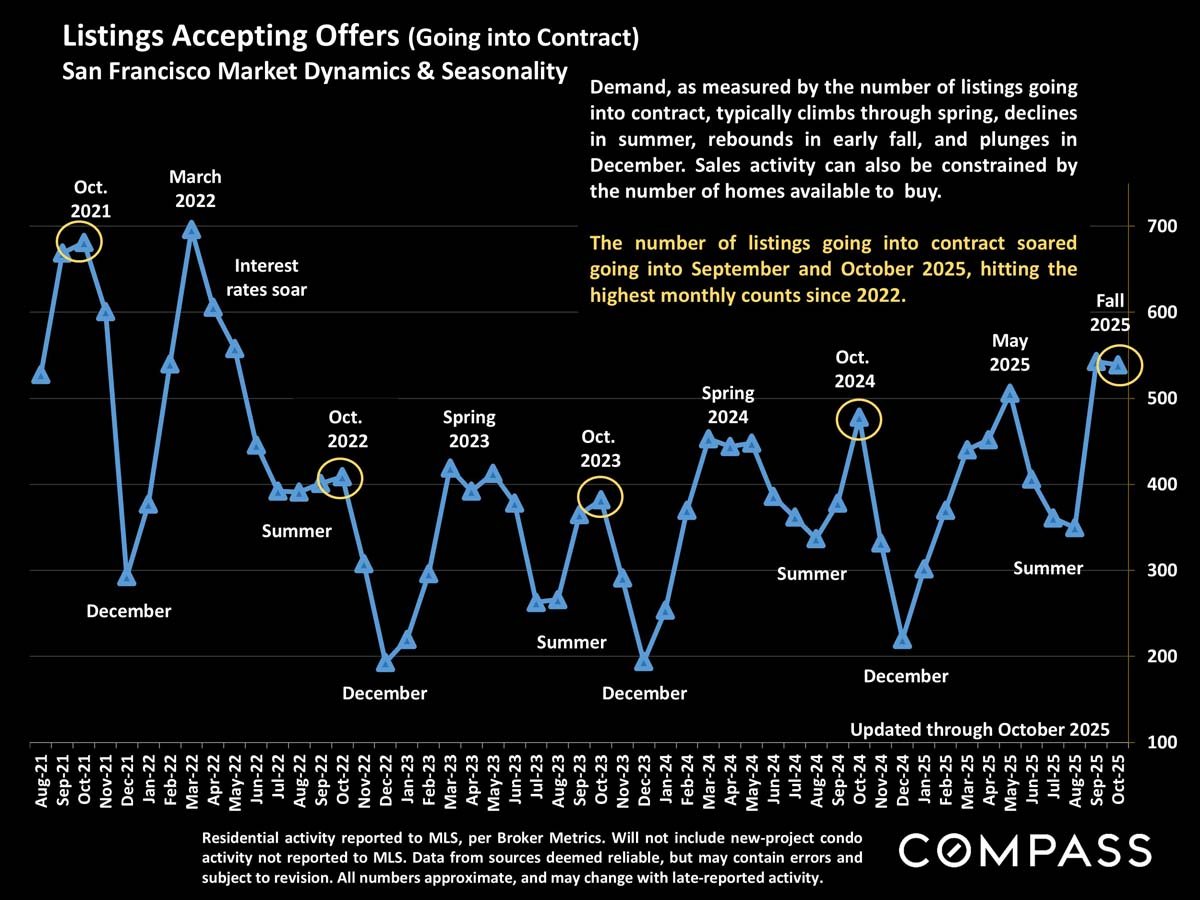
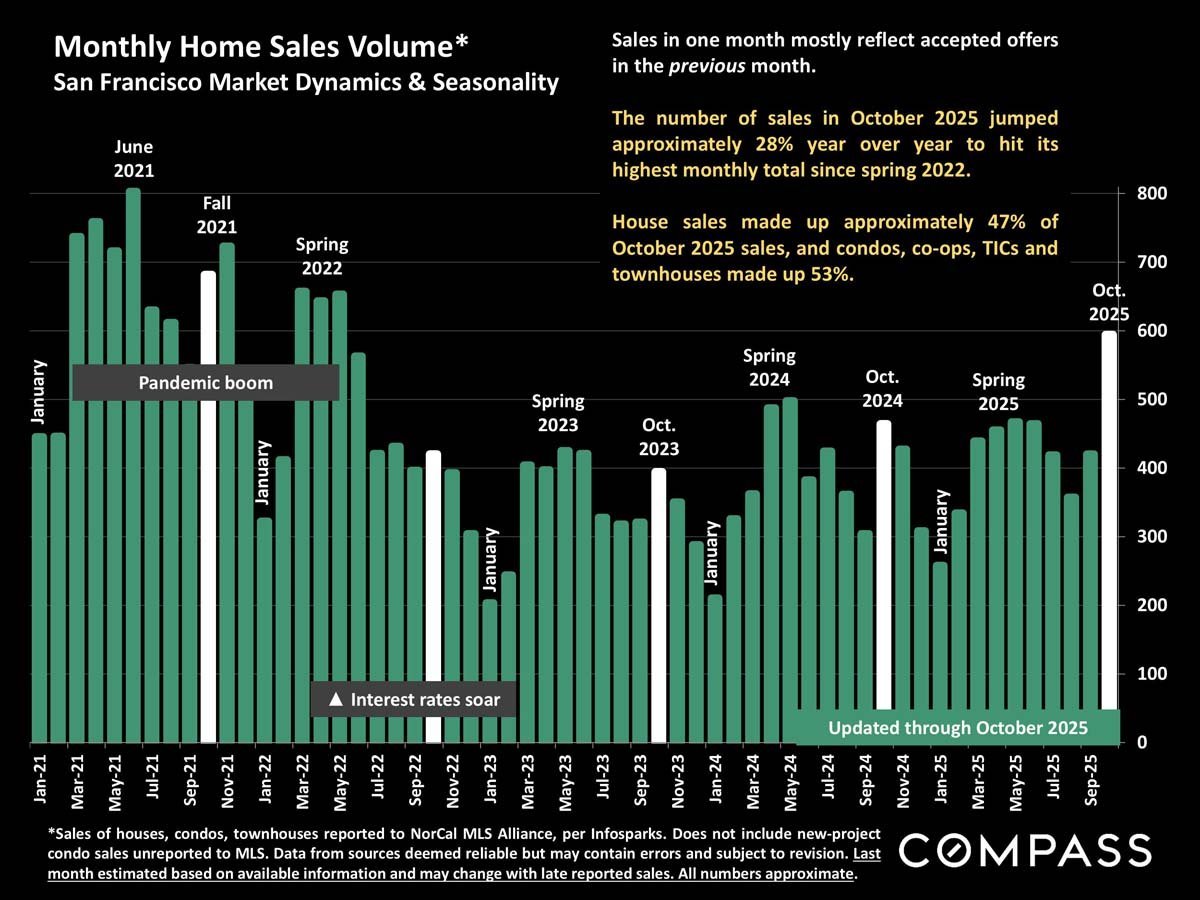
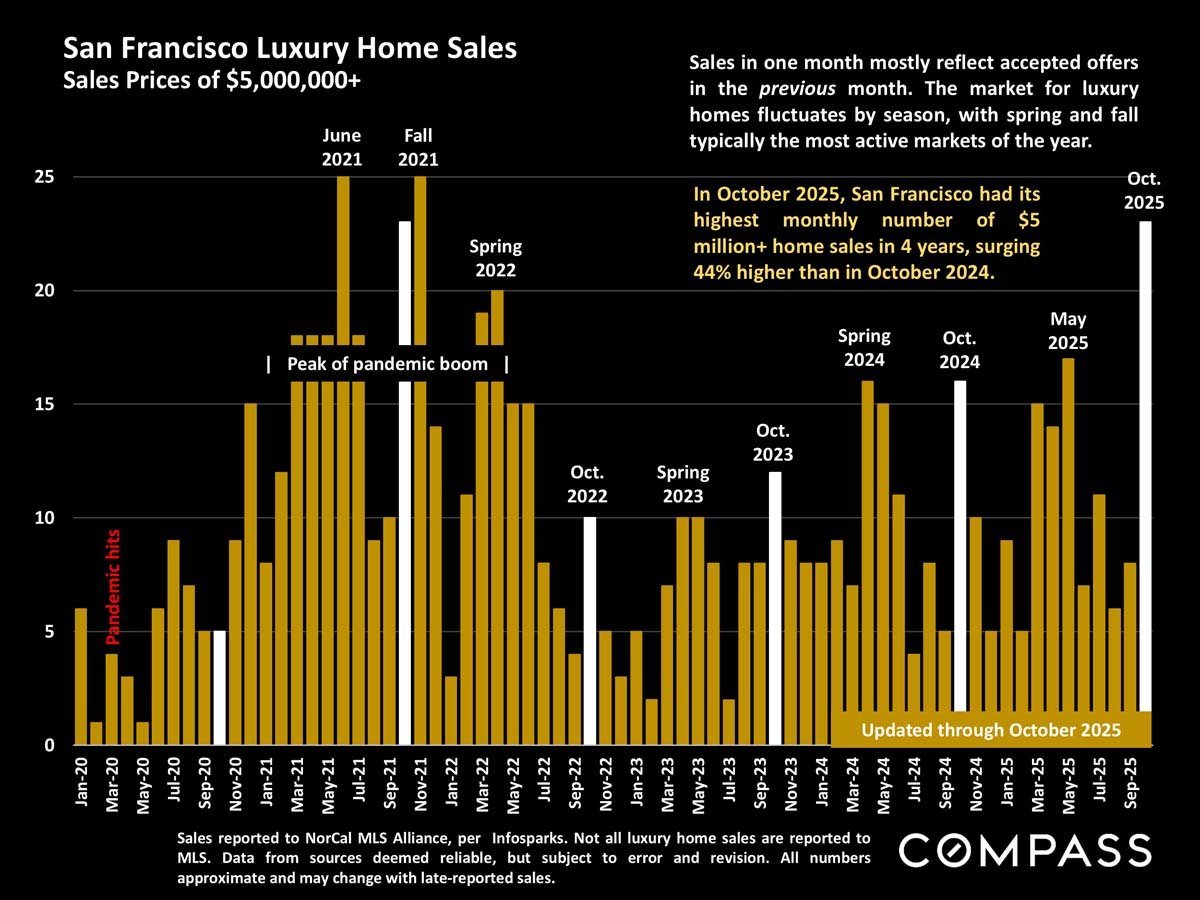
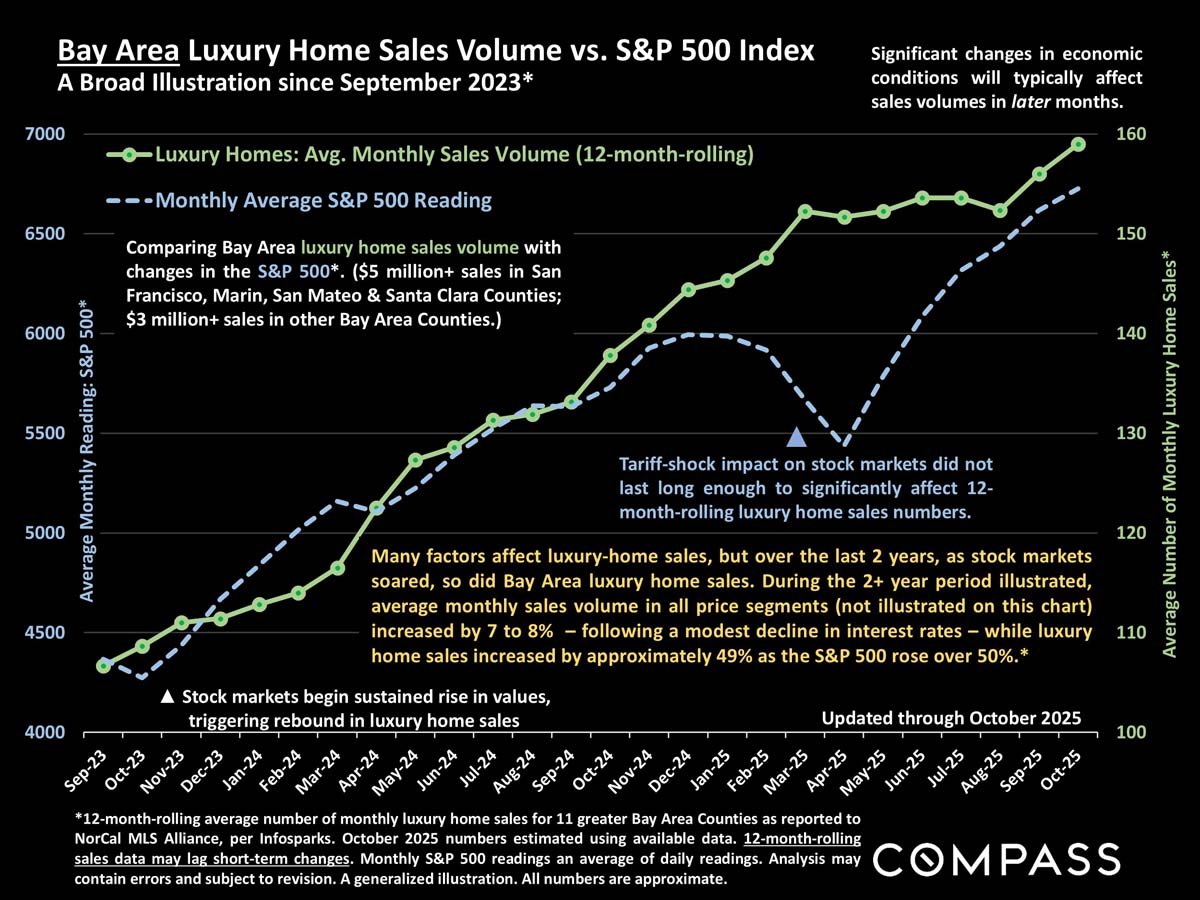
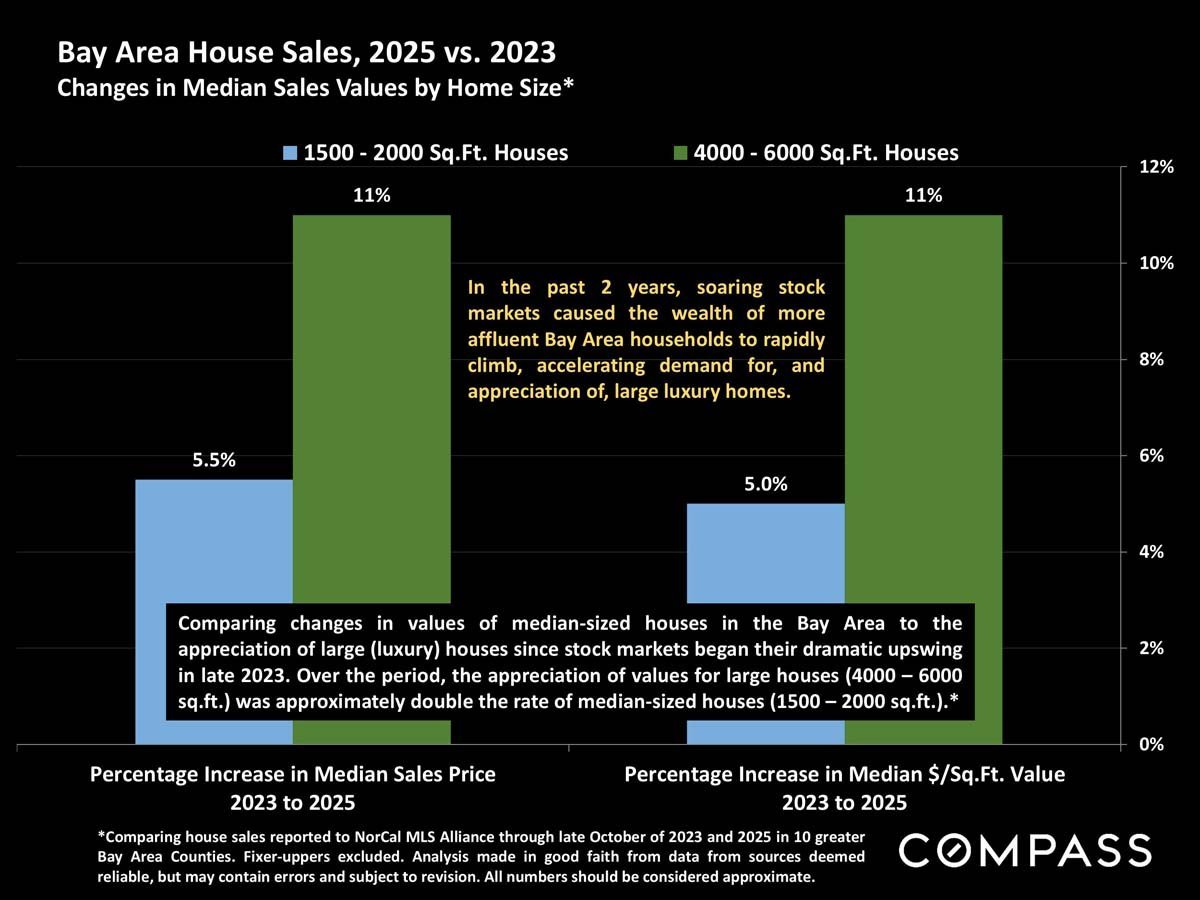
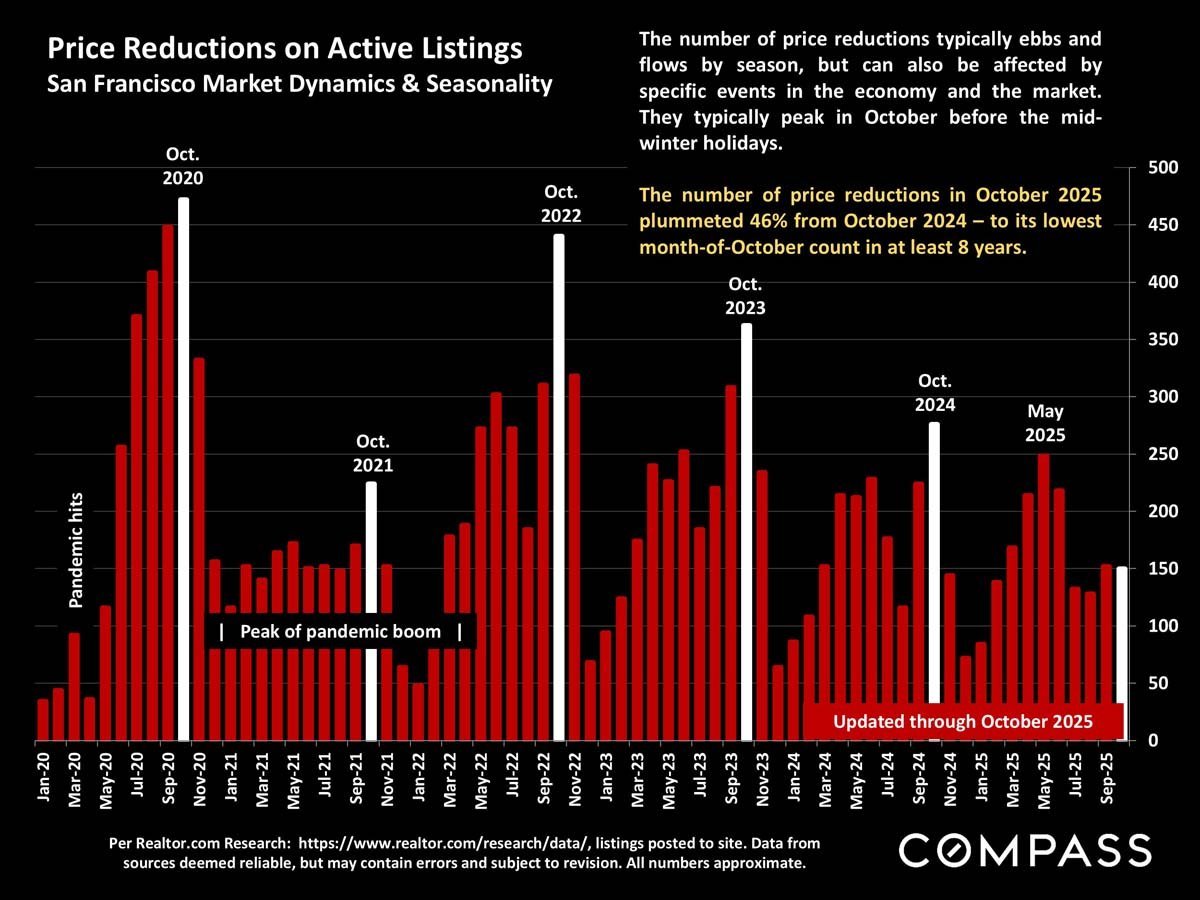
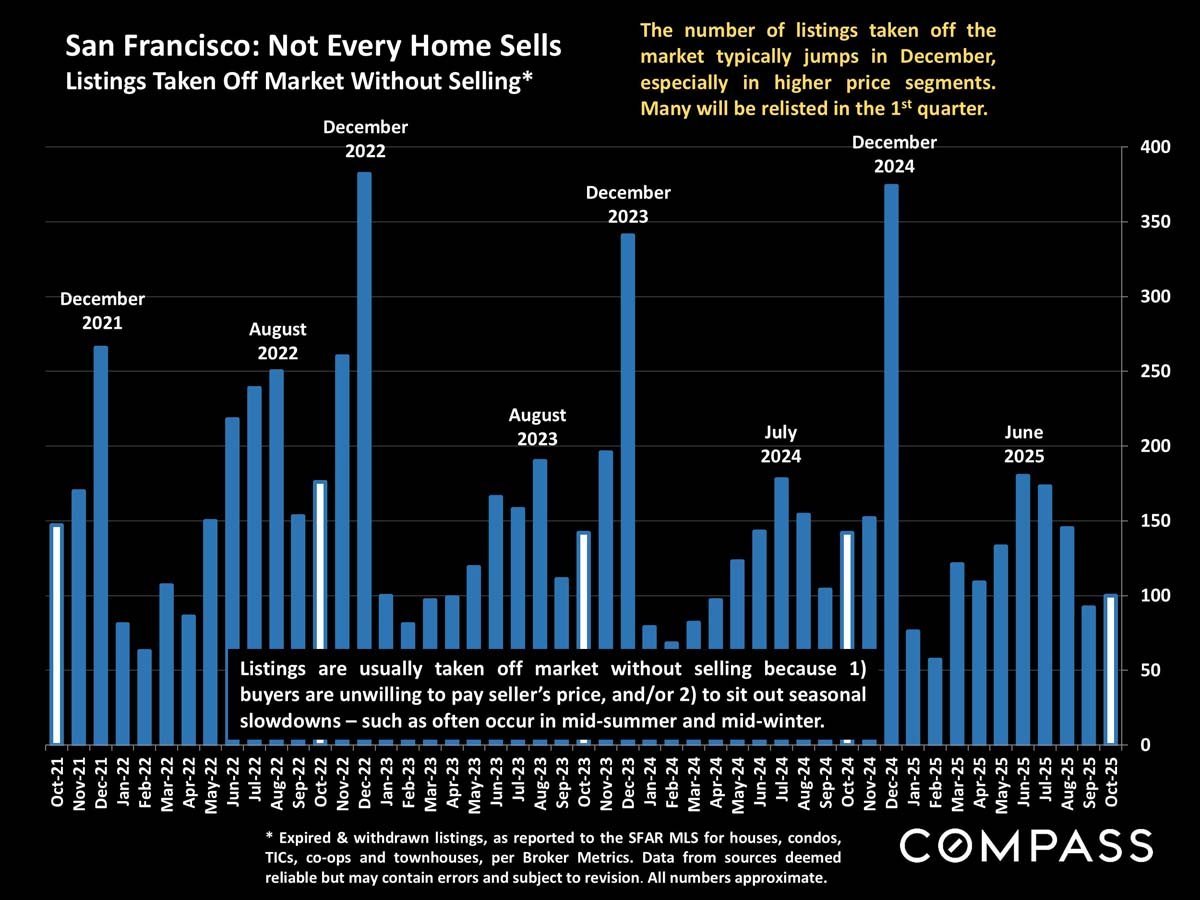
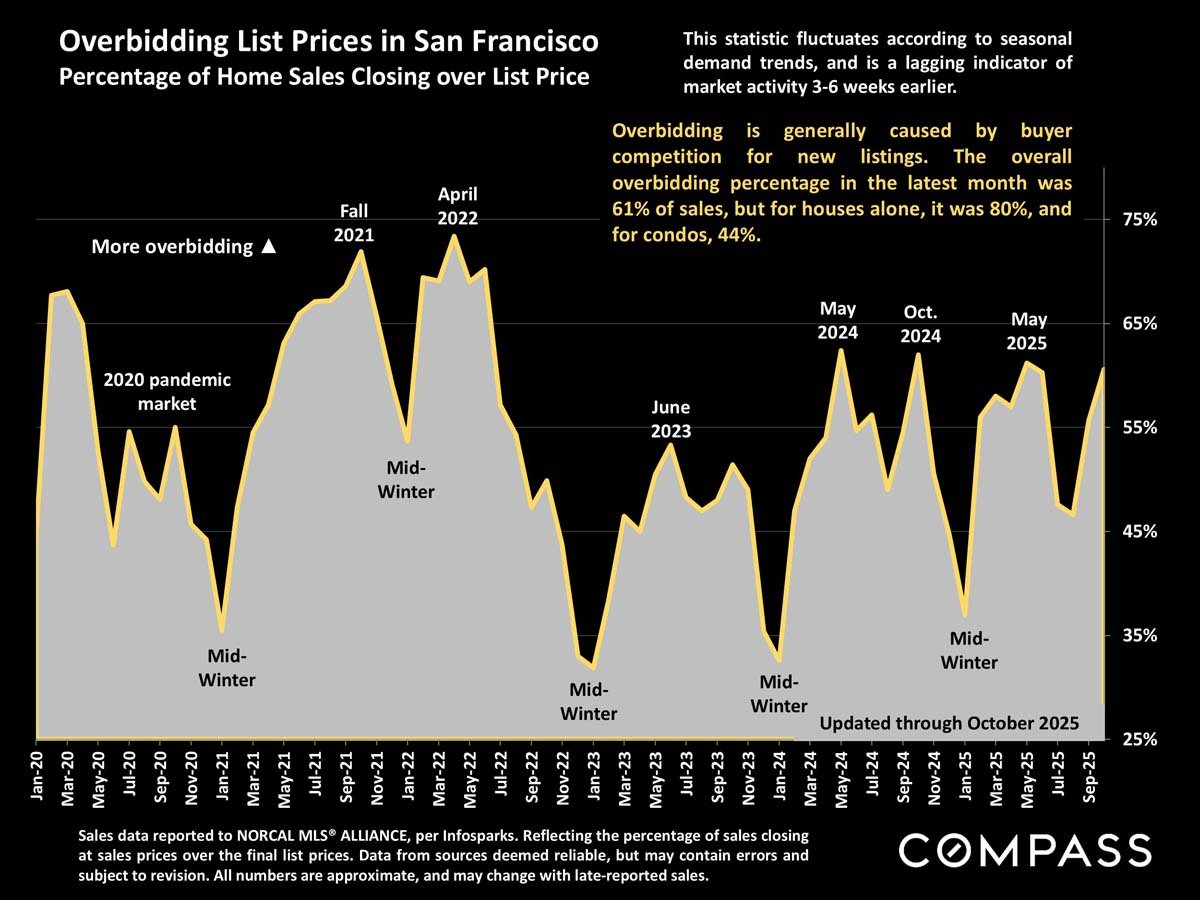
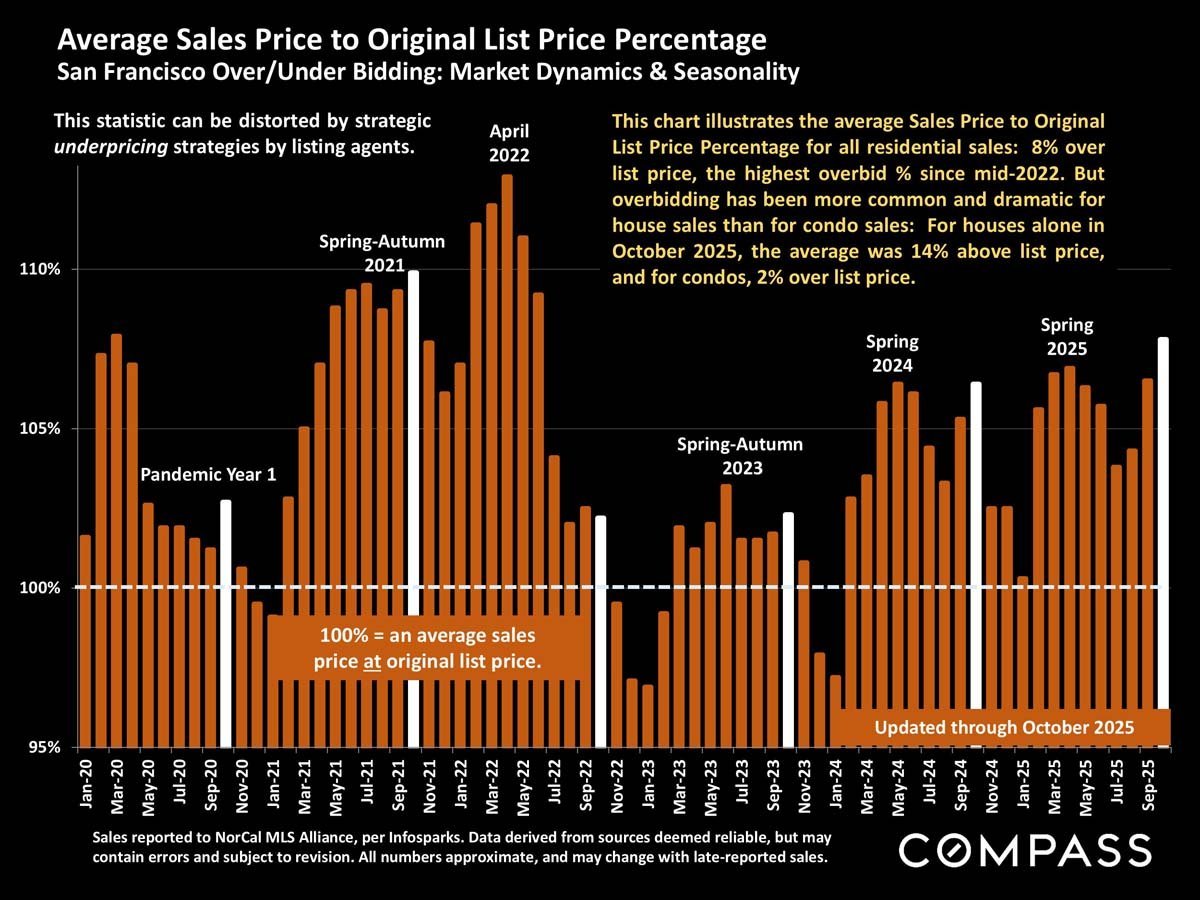
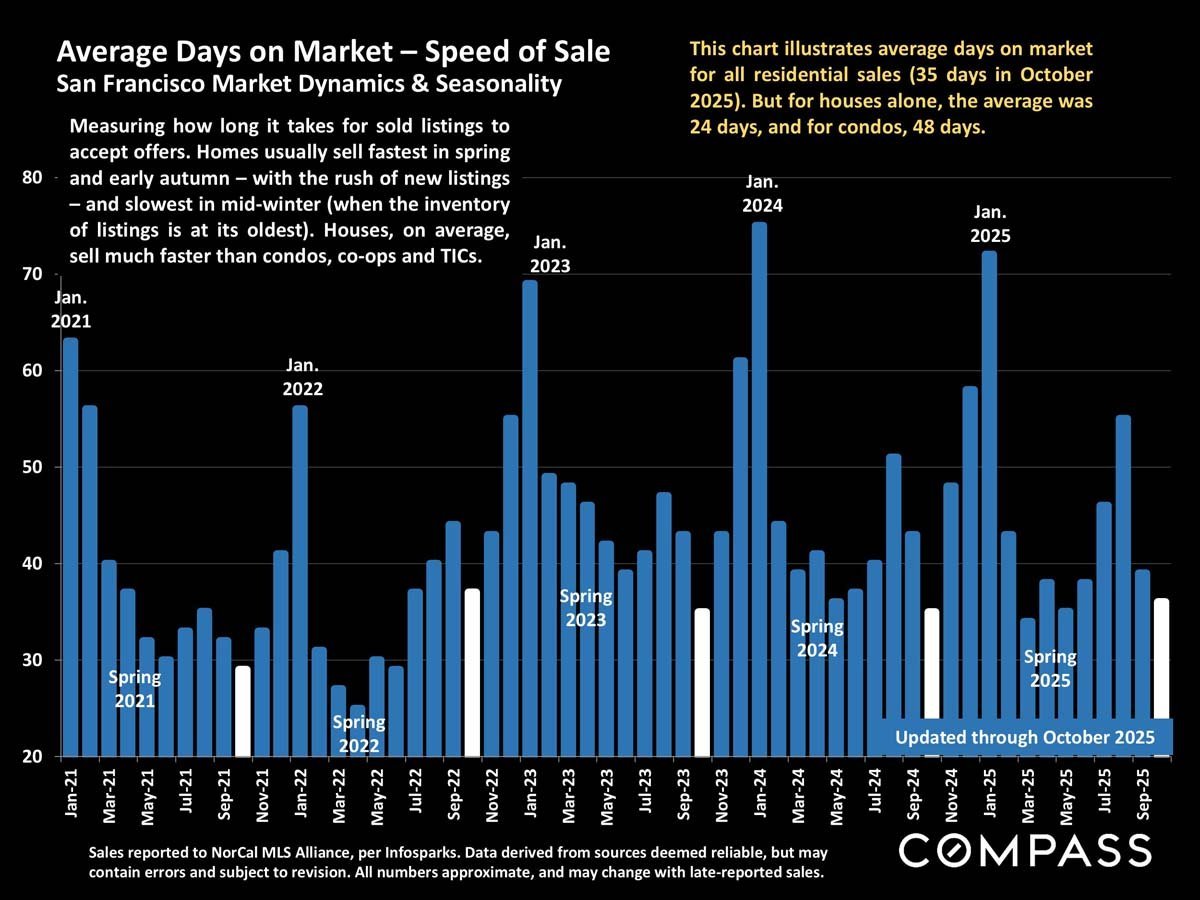
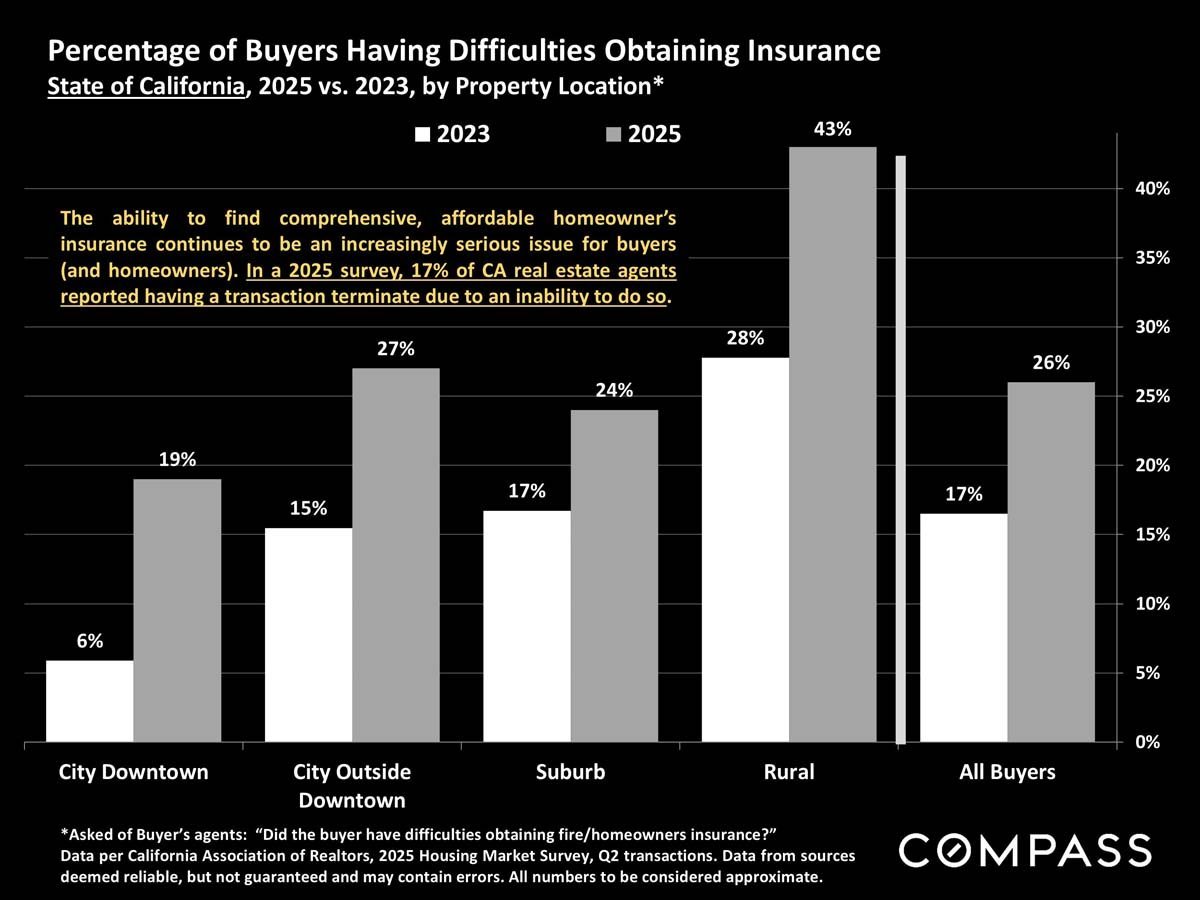
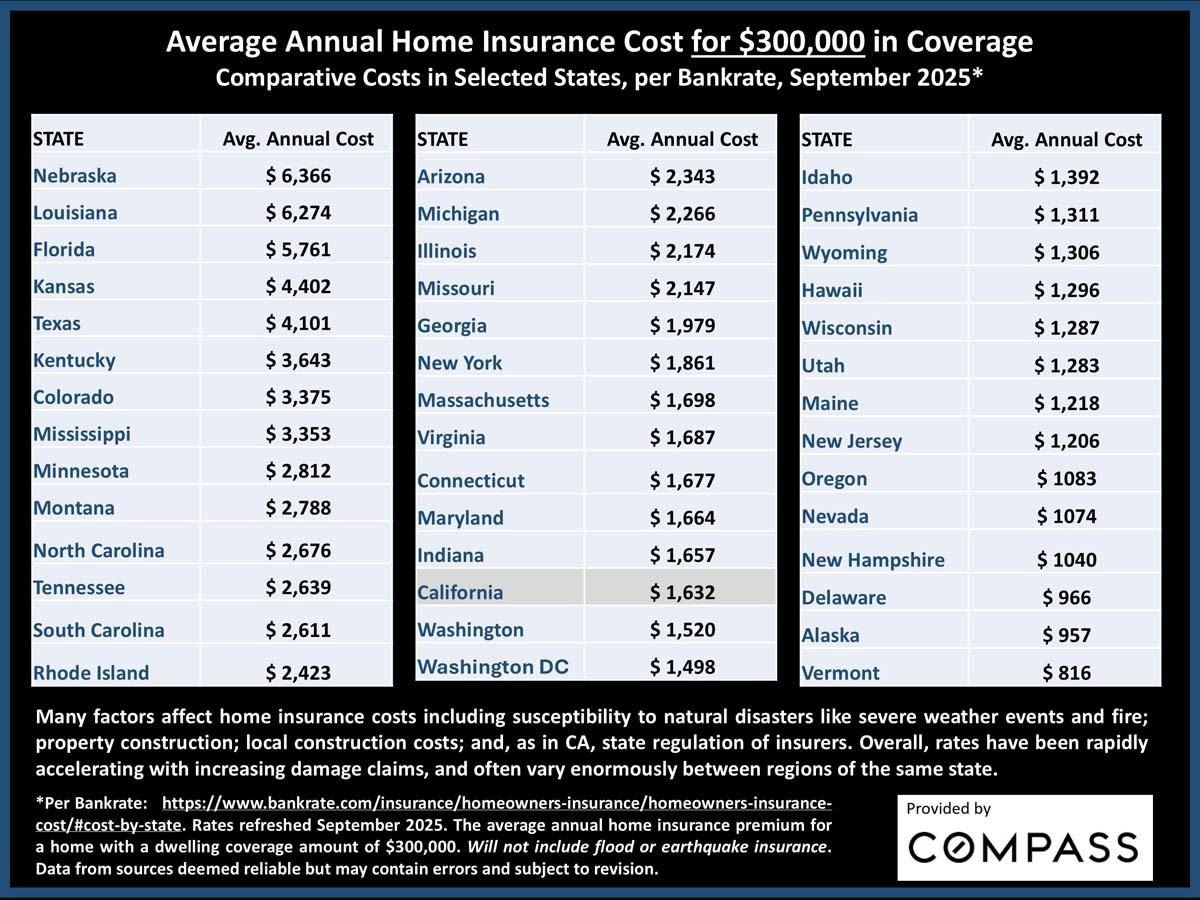
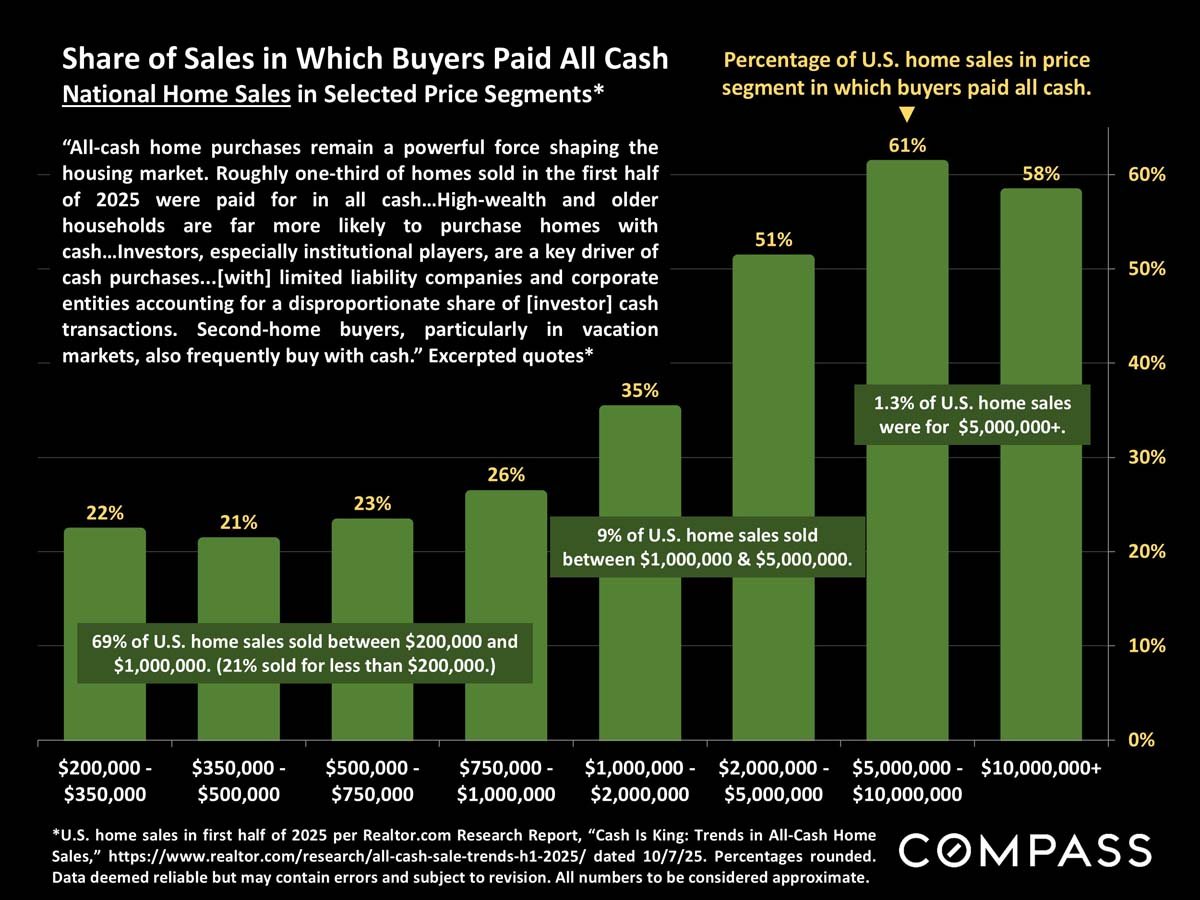
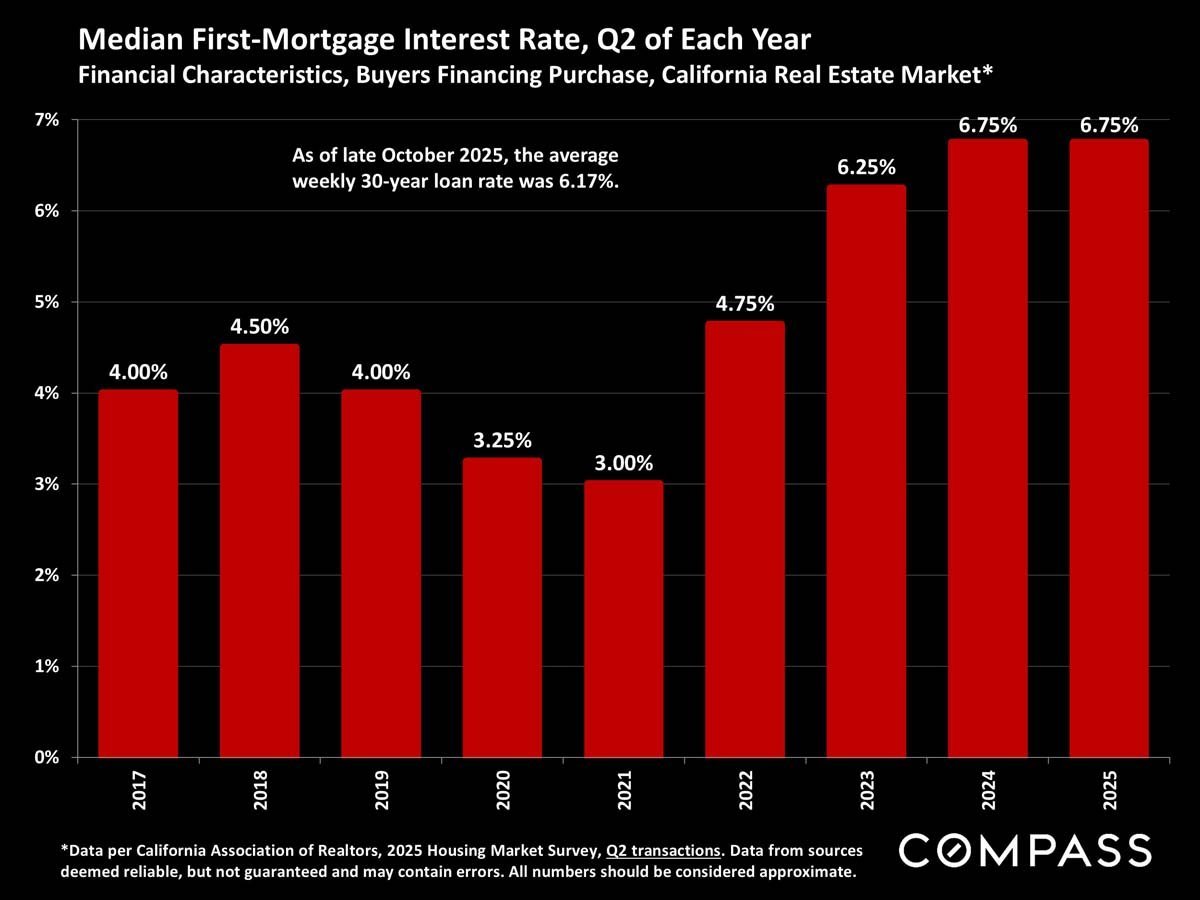
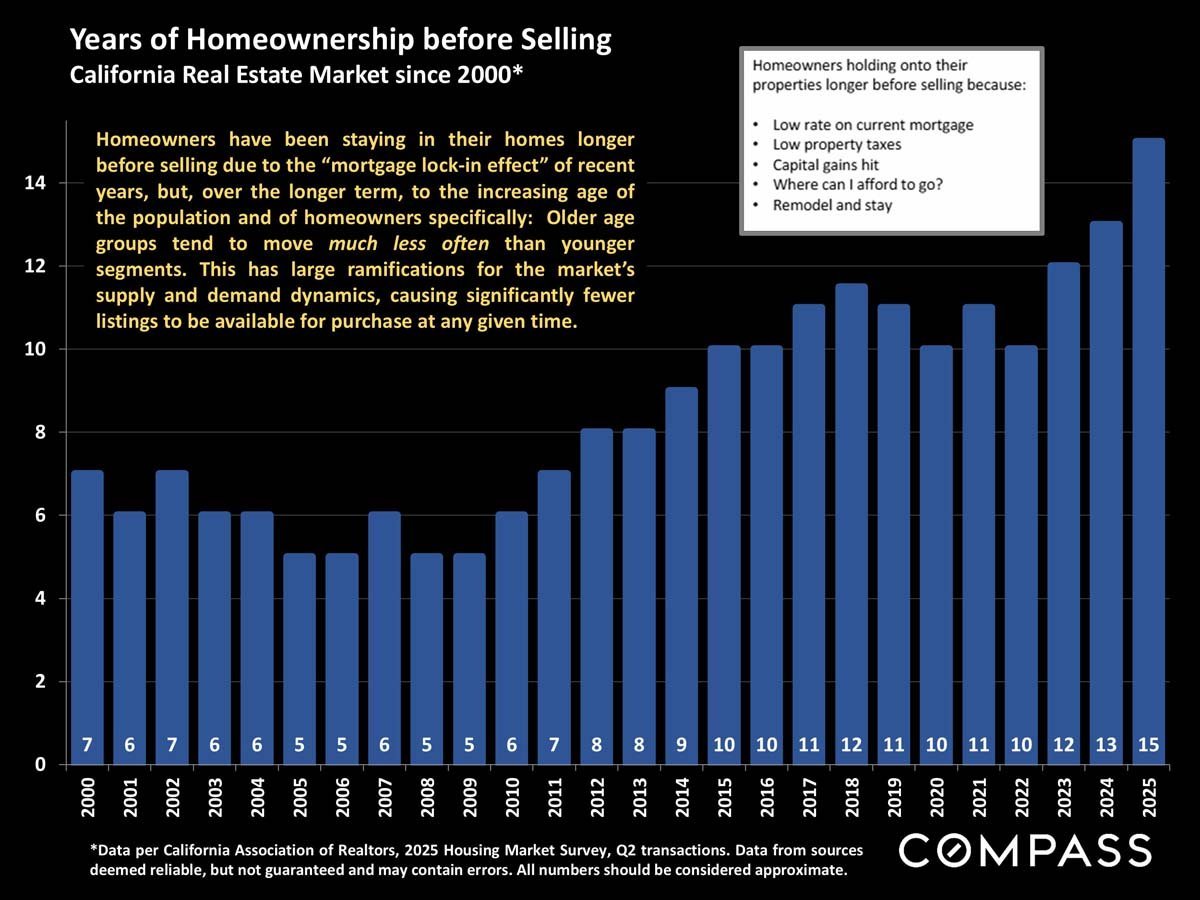
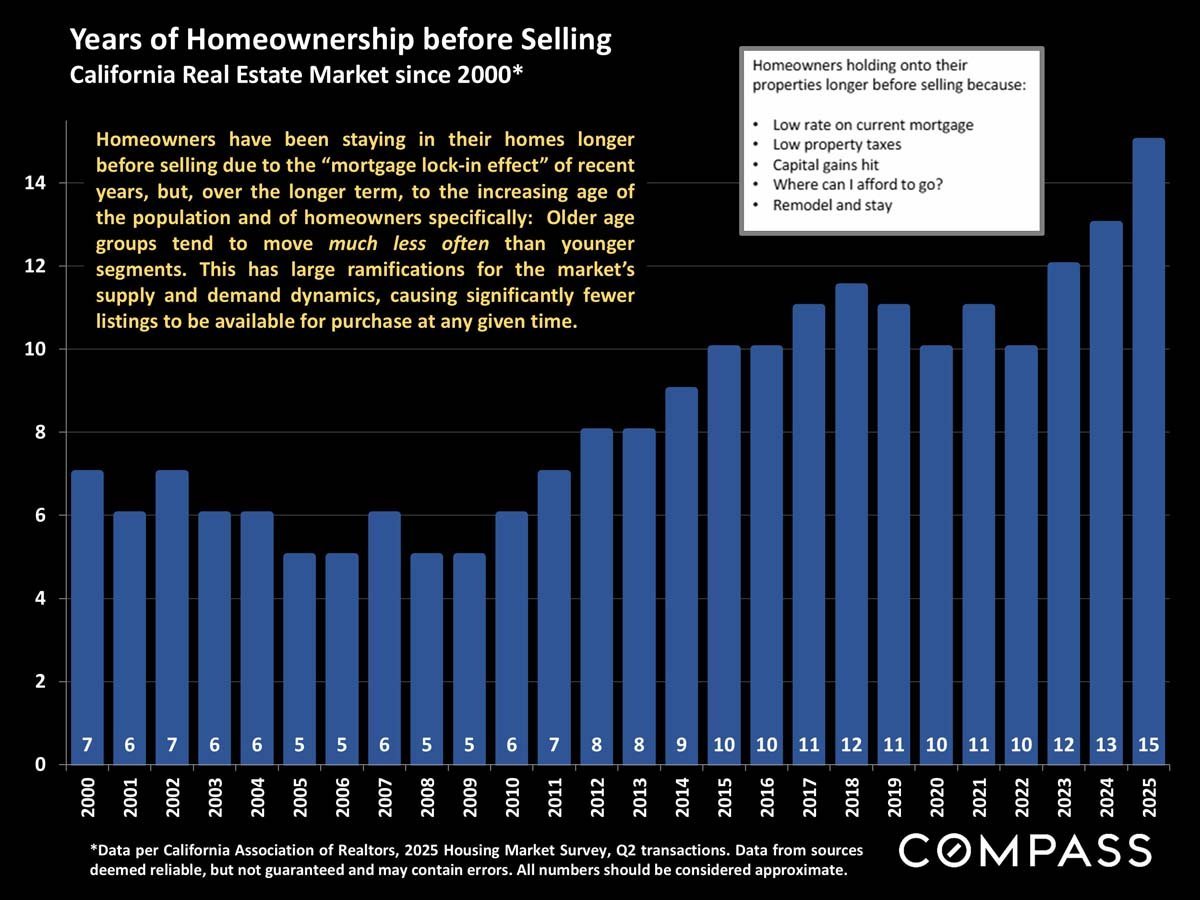
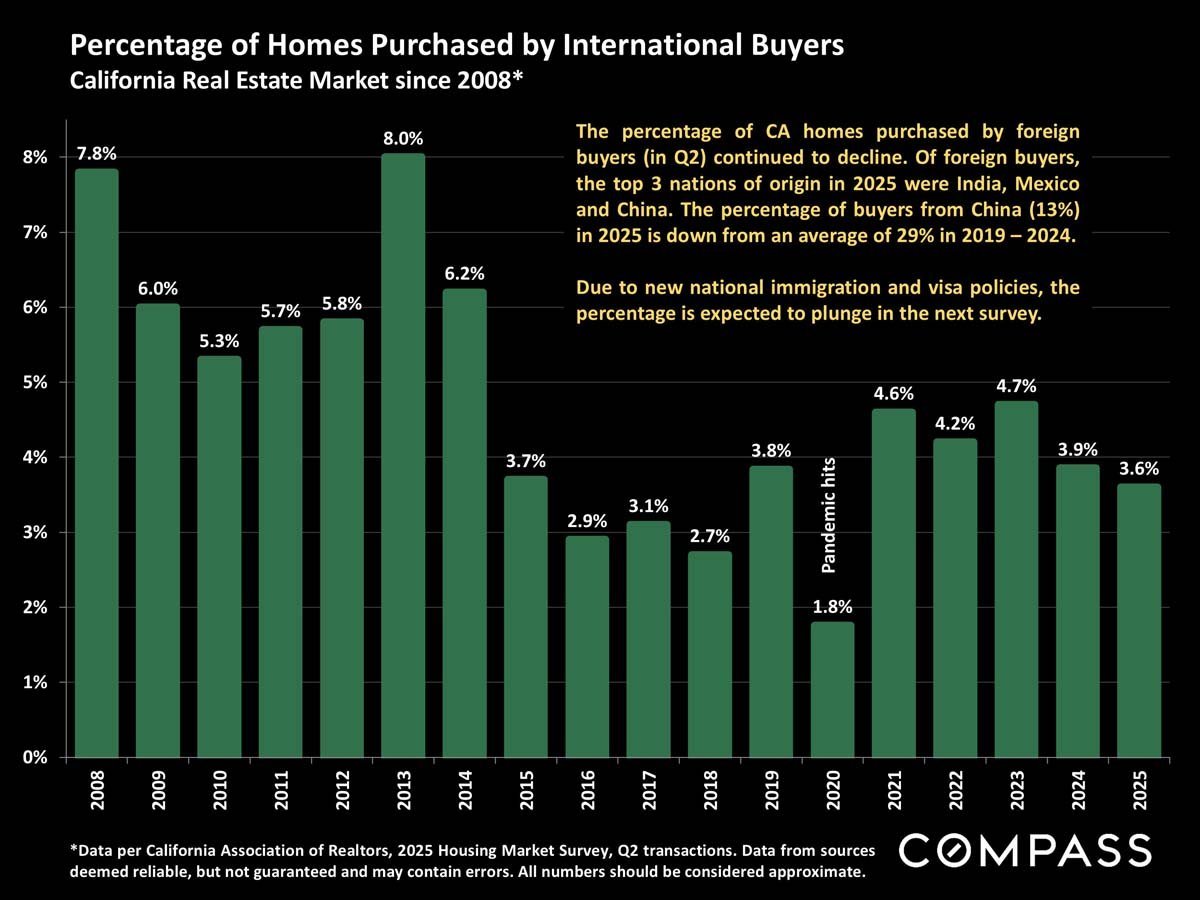
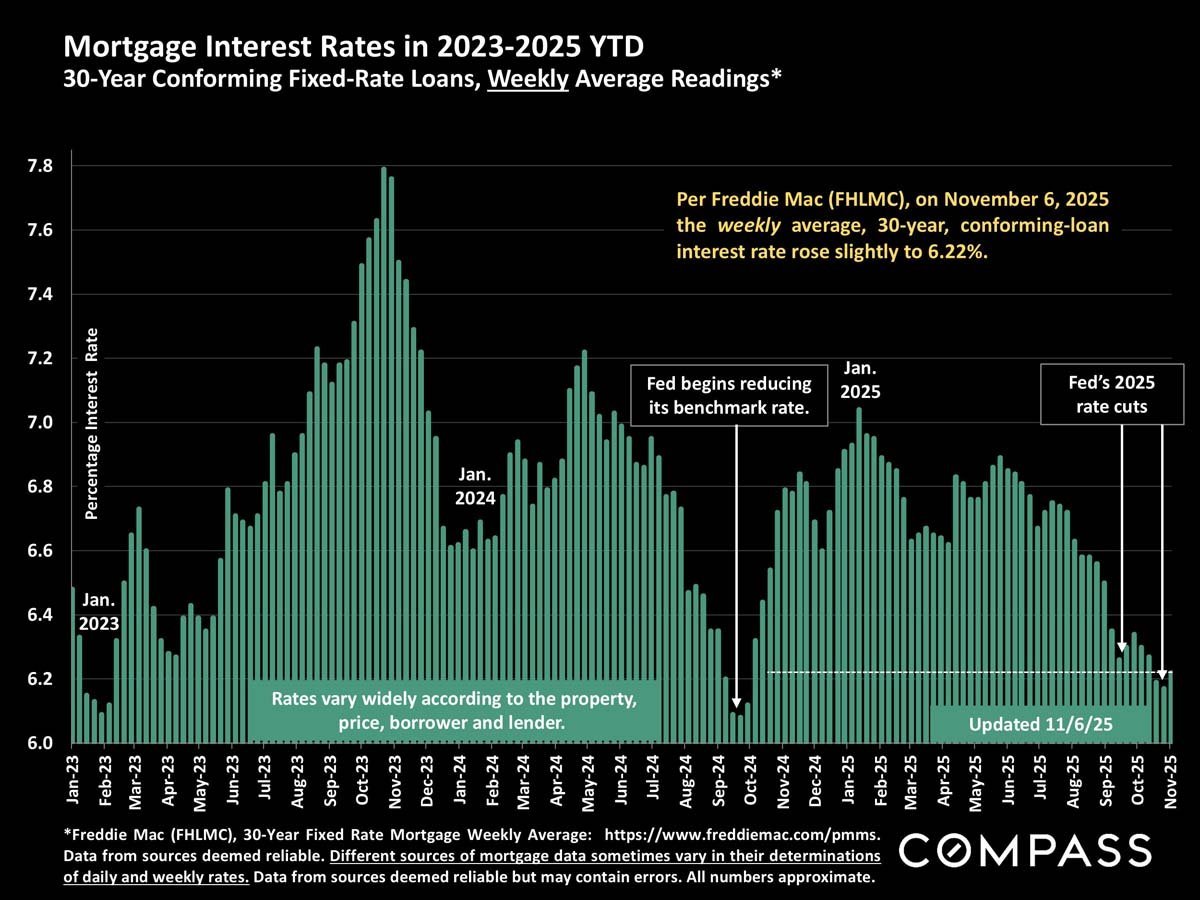
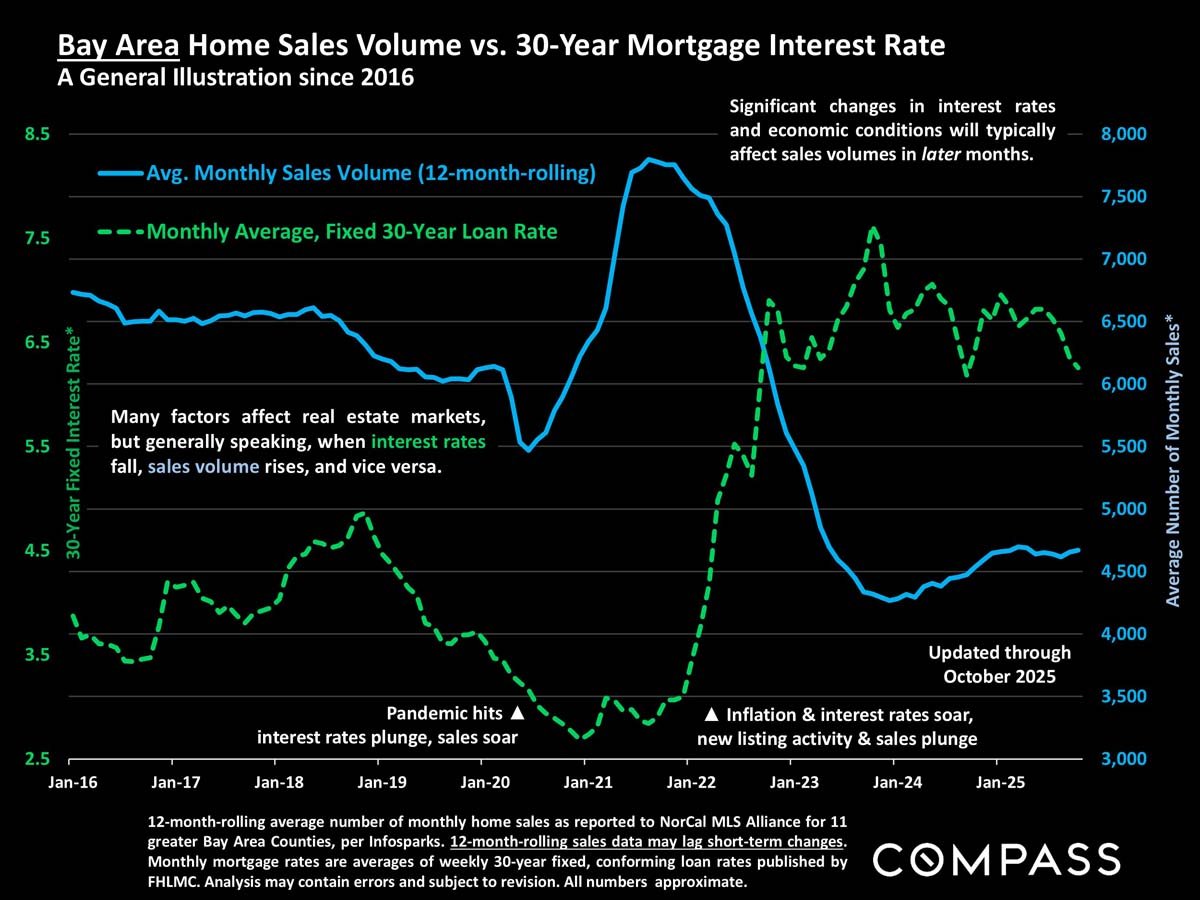
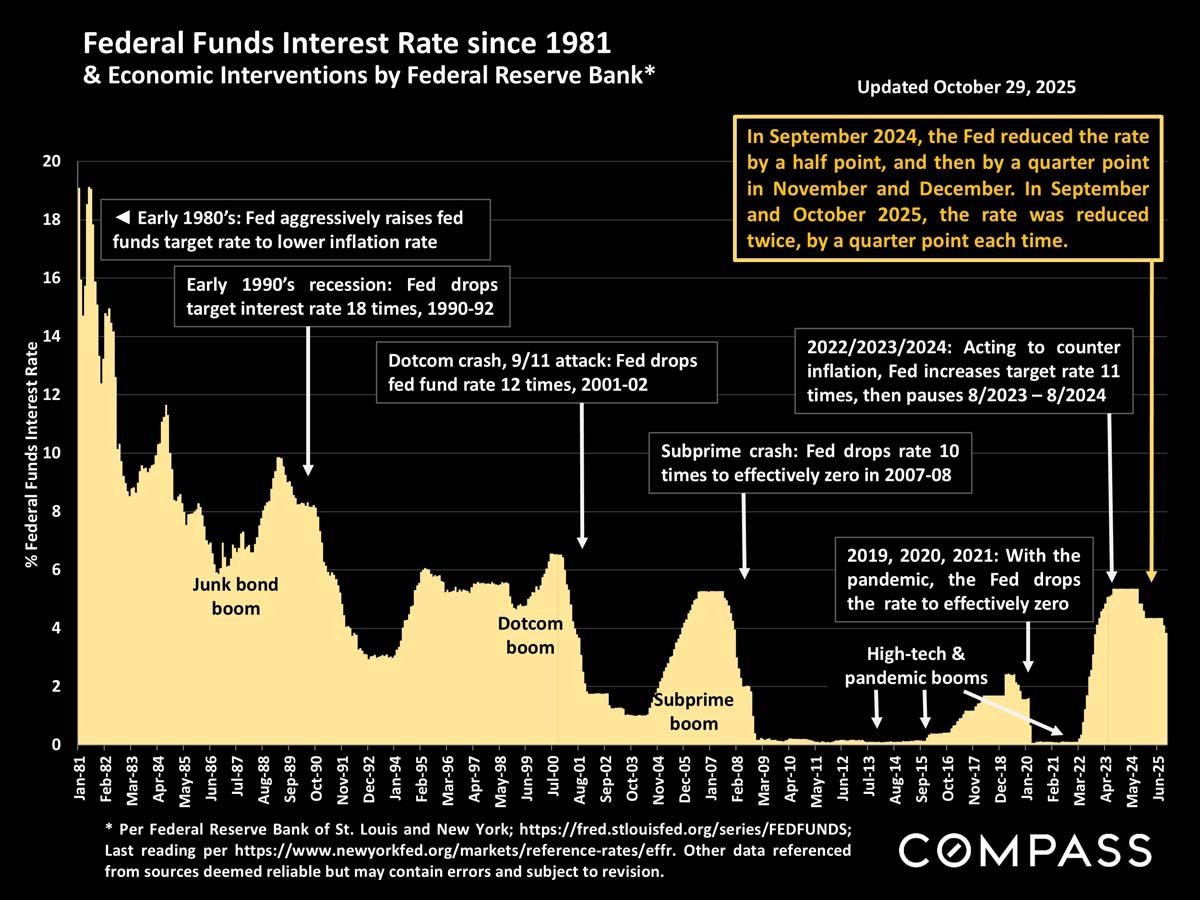
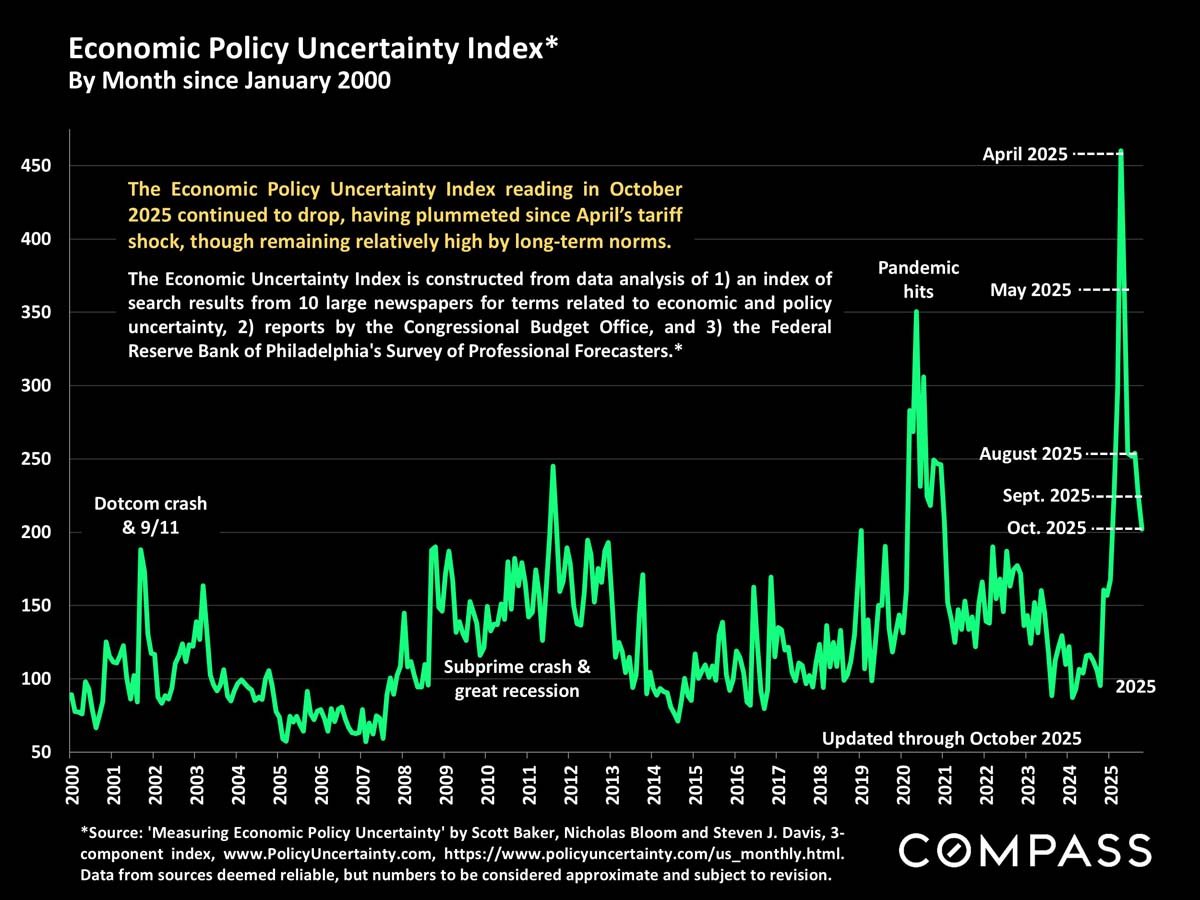
San Francisco Real Estate November 2025 Report, with market data through October.San Francisco market update: October sales and buyer demand surged, while mid-winter may offer buyers stronger negotiating opportunities.Chart of San Francisco median house prices from 1990 to October 2025, with a peak near $2 million in 2022.San Francisco condo median-price chart, 2005–2025, with recession, pandemic, and interest-rate annotations.San Francisco home-value chart comparing condo and house prices per square foot from 2005 to 2025.Chart comparing San Francisco two-bedroom condo prices downtown and outside downtown from 2005 to 2025.Infographic of migration into and out of San Francisco County, with mover counts and leading origin and destination locations.San Francisco residential market comparison table showing November 2025 conditions by price range and property type.Chart of San Francisco new listings, January 2021–October 2025, showing seasonal peaks and an October 2025 year-over-year decline.Chart of San Francisco active and coming-soon listings by month, showing 942 listings on November 1, 2025.San Francisco pending-ratio chart through October 2025, showing the highest reading since spring 2022.Chart of San Francisco listings going into contract, with seasonal peaks and a high in fall 2025.Bar chart of San Francisco monthly home sales, highlighting October 2025’s year-over-year increase.Chart of San Francisco monthly luxury home sales above $5 million, with October 2025 highlighted at a four-year high.Chart comparing Bay Area luxury home sales and S&P 500 trends, September 2023–October 2025.Bar chart: Bay Area luxury homes rose 11% in value, about double the increase for median-sized homes.San Francisco price-reduction chart, January 2020–October 2025, highlighting October 2025’s 46% year-over-year decline.Bar chart of San Francisco listings withdrawn without selling, with prominent December spikes from 2021 to 2024.San Francisco home overbidding trend chart, with monthly rates from 2020 to 2025 and a gray area outlined in yellow.Chart of San Francisco sale prices versus original list prices, with monthly data from 2020 through October 2025.Bar chart tracks San Francisco average days on market from 2021 to 2025, with seasonal winter peaks.Bar chart: insurance difficulties rose from 2023 to 2025 across California locations, highest in rural areas at 43%.Infographic comparing annual home insurance costs by state for $300,000 in coverage, with California highlighted at $1,632.Chart of all-cash U.S. home sales by price range, with rates peaking at 61% for $5–10 million homes.Chart of California buyer mortgage rates, dipping to 3% in 2021 and rising to 6.75% in 2024 and 2025.Chart showing California homeowners’ years of ownership before selling, rising to 15 years in 2025.Chart of California homeownership duration before selling, rising from 7 years in 2000 to 15 years in 2025.Bar chart of California home purchases by international buyers, 2008–2025, with a 2020 pandemic-era low.Selected Economic IndicatorsChart of weekly 30-year mortgage rates from 2023 to November 2025, ending at 6.22%.Chart comparing Bay Area home sales volume and 30-year mortgage rates from 2016 through October 2025.Chart of CPI and core inflation rates from 2021 through September 2025.Chart of federal funds interest rates from 1981 to 2025, with annotations on economic cycles and Federal Reserve actions.Chart of the Nasdaq Composite Index, 1995–2025, rising to a record high with pandemic, interest-rate, and tariff annotations.Chart of the Economic Policy Uncertainty Index from 2000 to October 2025, with a sharp spike in April 2025.Fine-print disclosures explaining real estate market statistics, pricing measures, photo licensing, and Compass disclaimers.

Work With Jane

Get assistance in determining the current property value, crafting a competitive offer, writing and negotiating a contract, and much more. Contact me today.

Follow Me on Instagram