July 2026 San Francisco Market Outlook, with a softly blurred city building backdrop.

August 2026 Housing Market Report

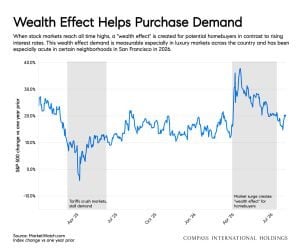
Mortgage rates ended July near their highs for the year, taking some momentum out of homebuyer demand. But in San Francisco, sales have been driven more by wealth creation than by mortgage rates: the AI boom has spiked demand, especially for family-ready homes in specific neighborhoods.

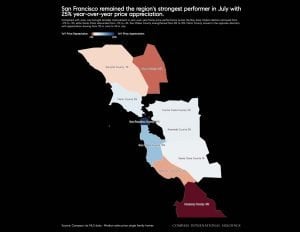
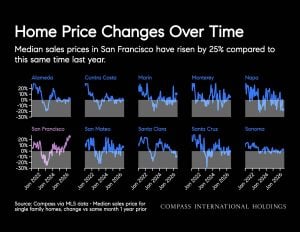
That boom is concentrated in the city proper, with modest overflow onto the Peninsula. San Francisco's median sales price is up 25% year-over-year; San Mateo County is up nearly 10%. In the other eight Bay Area counties, price trends look much more like the country as a whole, essentially flat versus a year ago. We've included a map showing price changes across the region so you can compare how each area is faring.

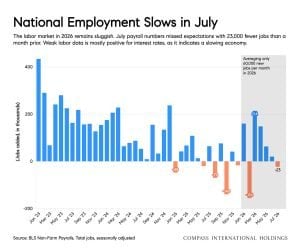
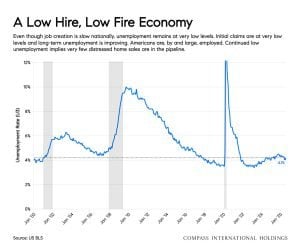
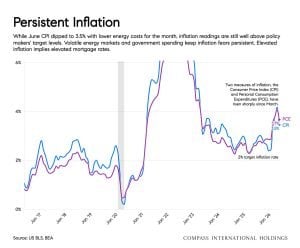
Rates remain elevated largely on inflation fears, with bonds under pressure from war-driven energy prices, tariffs, and unchecked government spending. What could bring rates down? A substantial slowdown in the labor market would ease some of that inflationary pressure. The U.S. labor market is already sluggish, and Northern California shows the same pattern: unemployment is low, but so is job creation. It's a low-hire, low-fire economy nationally.

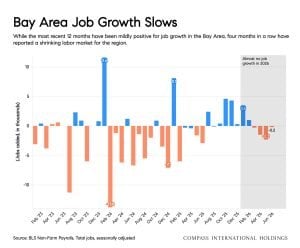
Beyond rates, jobs matter directly for housing, since relocations for work are traditionally a major driver of demand. In the Bay Area, some AI companies are hiring fast, but the broader regional story is slightly fewer jobs in recent months. That divide shows up in housing: job creation in San Francisco is fueling demand there, while sluggish hiring elsewhere in the region means less.

The August 2026 overview: local markets are diverging from both the regional and national picture. Real estate is local, but the bigger picture still matters.
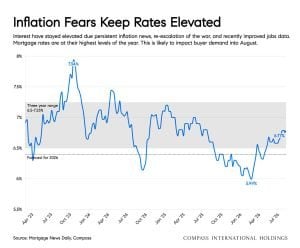
Mortgage rate chart shows a sharp early peak, a later decline, and a modest rise.
Line chart of persistent inflation, showing a sharp peak followed by a decline and renewed fluctuations.
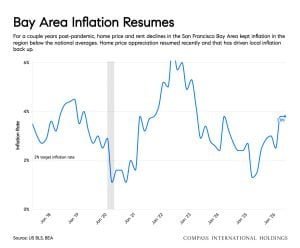
Bay Area inflation rate chart showing sharp fluctuations, a major rise, and a recent recovery.
Bar chart of monthly employment changes, with recent months showing negative results.
Bay Area job growth, mostly positive over 12 months, then four consecutive months of declines.
U.S. unemployment rate chart with two sharp spikes and shaded periods.
Wealth Effect Helps Purchase Demand chart showing a blue line with sharp declines and rebounds over time.
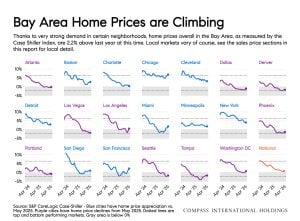
Chart comparing home price trends across multiple U.S. cities, titled “Bay Area Home Prices are Climbing.”
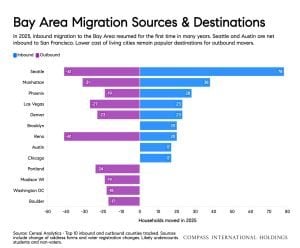
Chart comparing 2023 Bay Area migration with cities including Seattle, Nashville, Phoenix, and Las Vegas.
August 2026 San Francisco housing market report with an aerial view of a winding street.
California housing market map with San Francisco highlighted as the strongest performer in July.
Infographic compares home price changes across Bay Area counties and highlights a 25% rise in San Francisco.
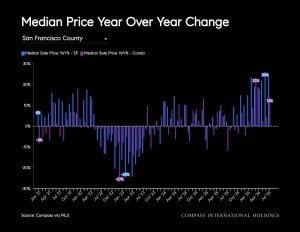
Bar chart of year-over-year median price changes in San Francisco County, with the largest drops near the middle.
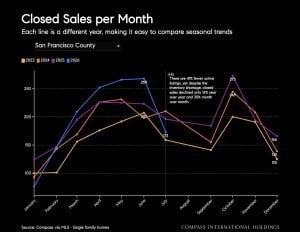
San Francisco County monthly closed sales chart comparing seasonal trends across several years.
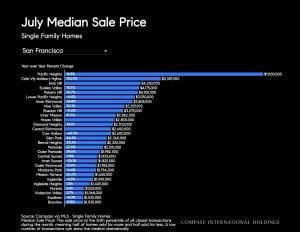
Chart comparing July median single-family home sale prices across San Francisco neighborhoods.
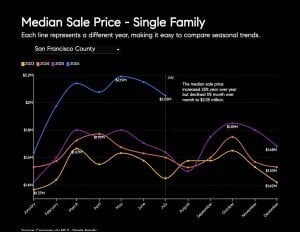
Chart comparing monthly single-family median sale prices across multiple years in San Francisco County.
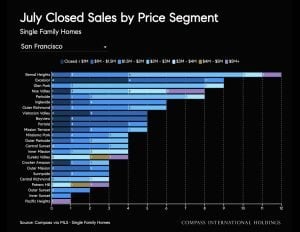
Bar chart of July closed sales by price segment for San Francisco single-family homes.
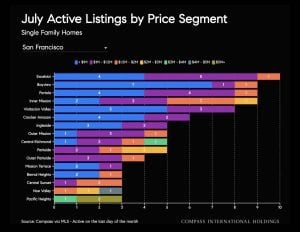
Chart comparing San Francisco single-family home active listings by price segment in July.
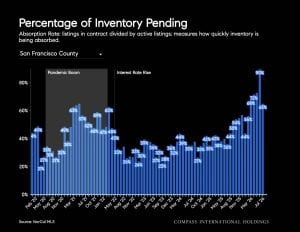
Chart of San Francisco County’s percentage of inventory pending over time.
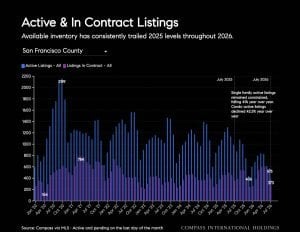
San Francisco County chart comparing active and in-contract listings over time, with 2026 inventory trailing 2025 levels.
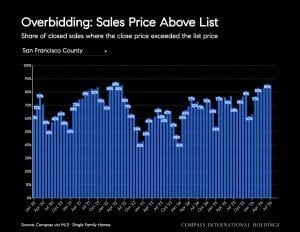
Chart showing the share of San Francisco County home sales closing above list price.
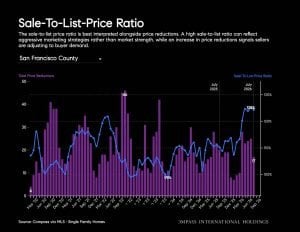
San Francisco County sale-to-list-price ratio chart with purple bars and a blue line.
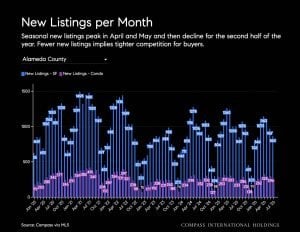
Alameda County monthly new listings chart, with spring peaks and a pink trend line.
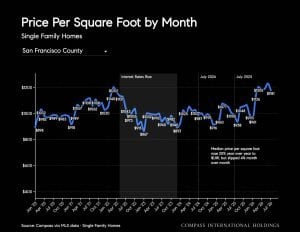
Chart of monthly price per square foot for single-family homes in San Francisco County.
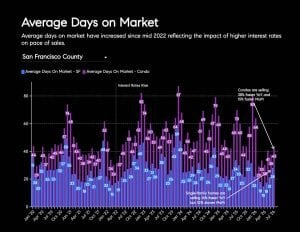
San Francisco County days-on-market chart showing an increase since mid-2022.
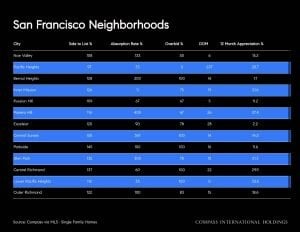
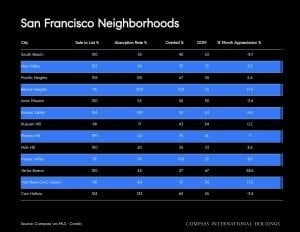
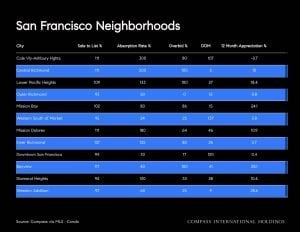
San Francisco neighborhood housing market comparison table
San Francisco neighborhood housing-market comparison table with alternating blue rows.
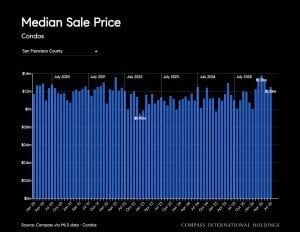
Bar chart of monthly median condo sale prices in San Francisco County.
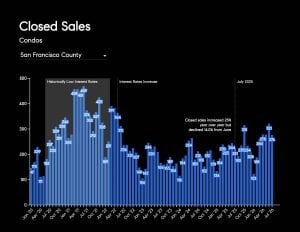
San Francisco County condominium closed-sales chart with blue monthly bars and a seasonal sales estimate.
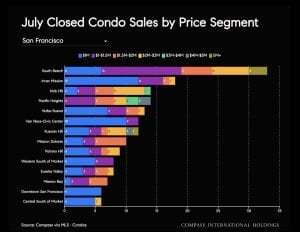
San Francisco condo sales by neighborhood and price segment, shown as stacked horizontal bars.
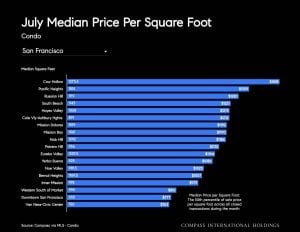
July condo price-per-square-foot comparison chart, with San Francisco showing the longest bar.
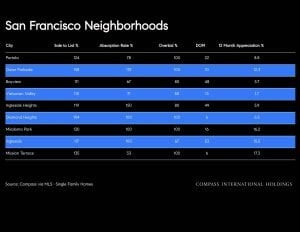
San Francisco neighborhood housing market table with neighborhood names and market figures.
San Francisco neighborhood housing market statistics chart with alternating blue rows.

Work With Jane

Get assistance in determining the current property value, crafting a competitive offer, writing and negotiating a contract, and much more. Contact me today.

Follow Me on Instagram