Compass July 2026 San Francisco House & Condo Market Outlook report cover.

July 2026 San Francisco Market Outlook

The Bay Area housing market is the center of national attention this summer. AI-driven wealth has offset persistently higher mortgage rates, pushing demand in a handful of neighborhoods to dramatic levels.

The most intense competition is concentrated in San Francisco itself. In June, 44 homes in the city sold for at least $1 million over asking (see charts, next page). Sales in San Francisco, San Mateo, and Marin are running well above last year's pace.

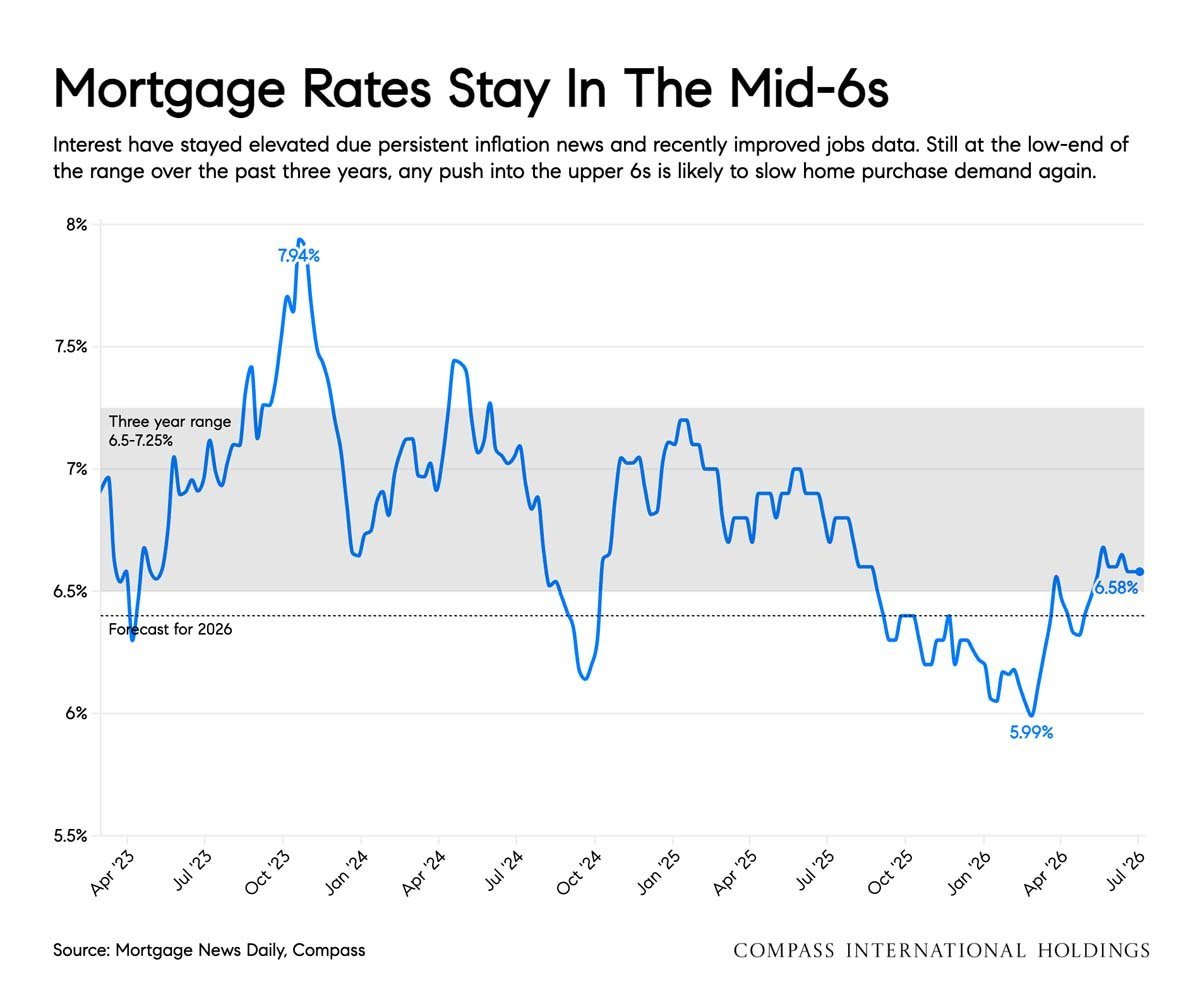
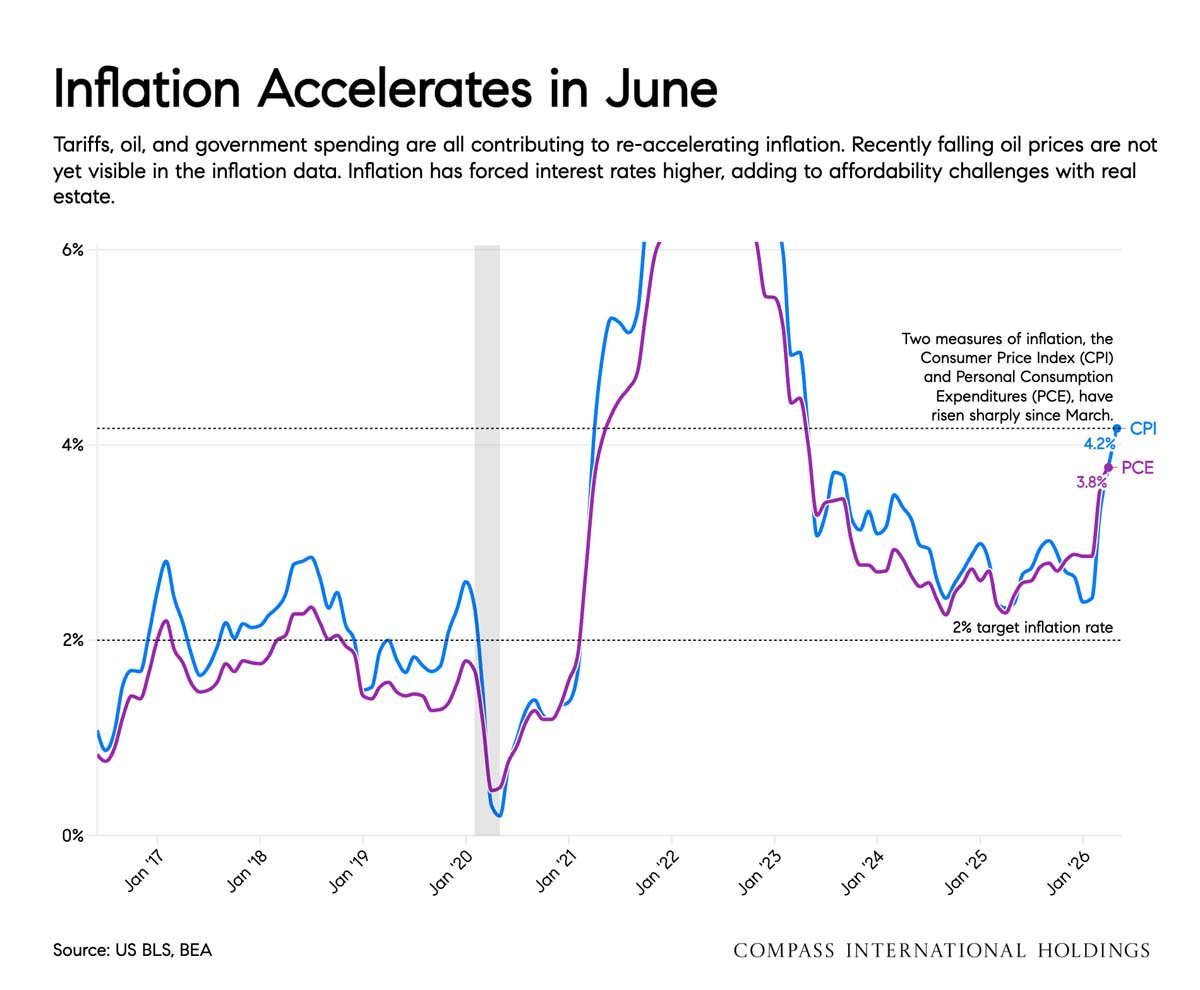
Other parts of the Bay Area are more exposed to AI's other edge: jobs, inflation, and rates. Most buyers need a mortgage, and rates have stayed elevated — though still below last year's level. Nationally, inflation remains well above what policymakers and bond markets are comfortable with, driven by energy costs, government spending, and quite possibly the AI investment boom itself. Mortgage rates spent another month near 6.5%.

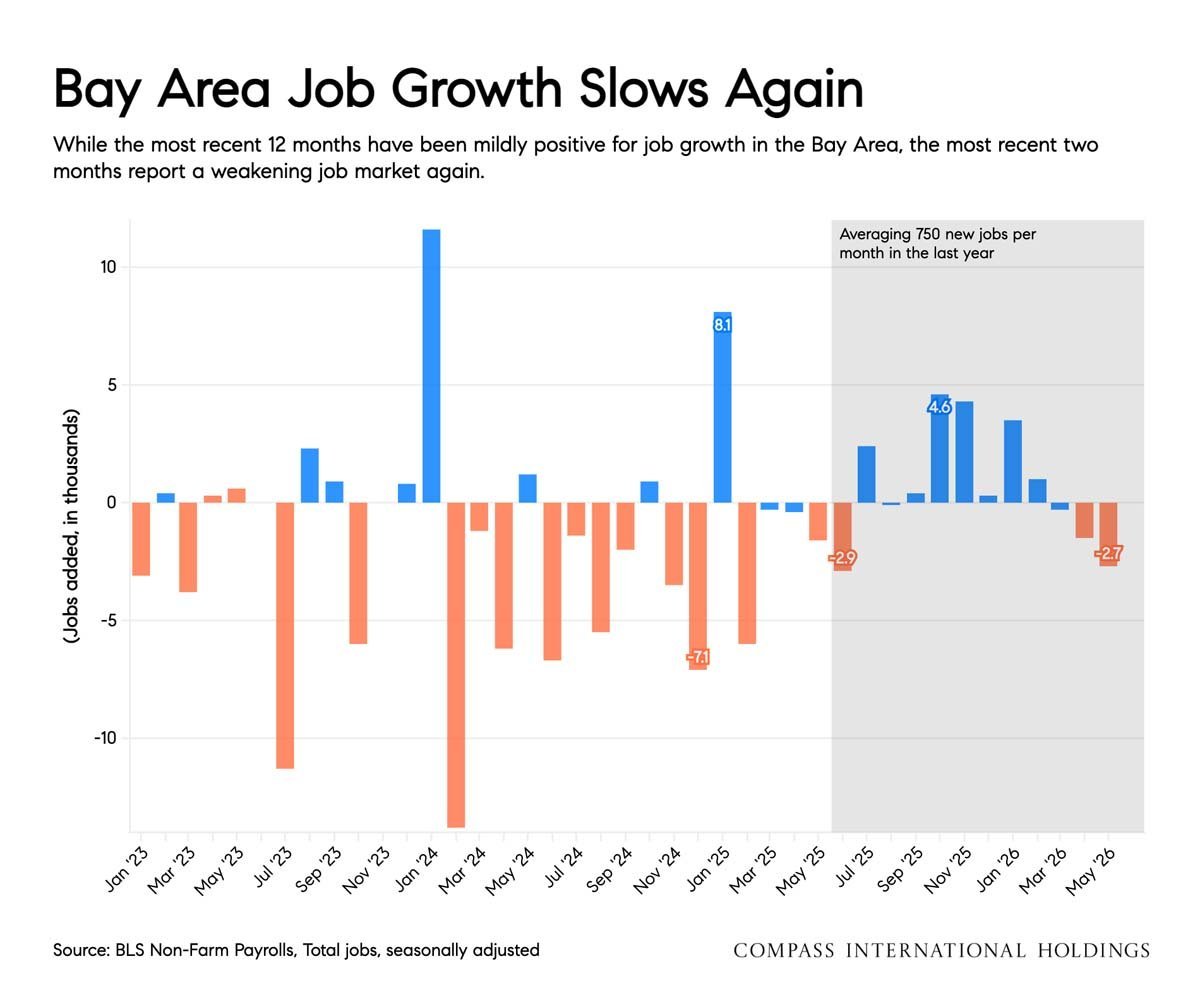
Santa Clara County is feeling a different edge: Bay Area tech companies have cut 58,000 jobs so far in 2026, and in the South Bay, inventory is climbing while average sale prices trail last year.

In many ways, the Bay Area is leading the nation's housing story in both directions — new wealth pulling the top of the market to record heights, while job insecurity and high rates weigh on buyers further down. It's always worth watching the Bay Area markets closely as we often signal where the rest of the country is headed next.
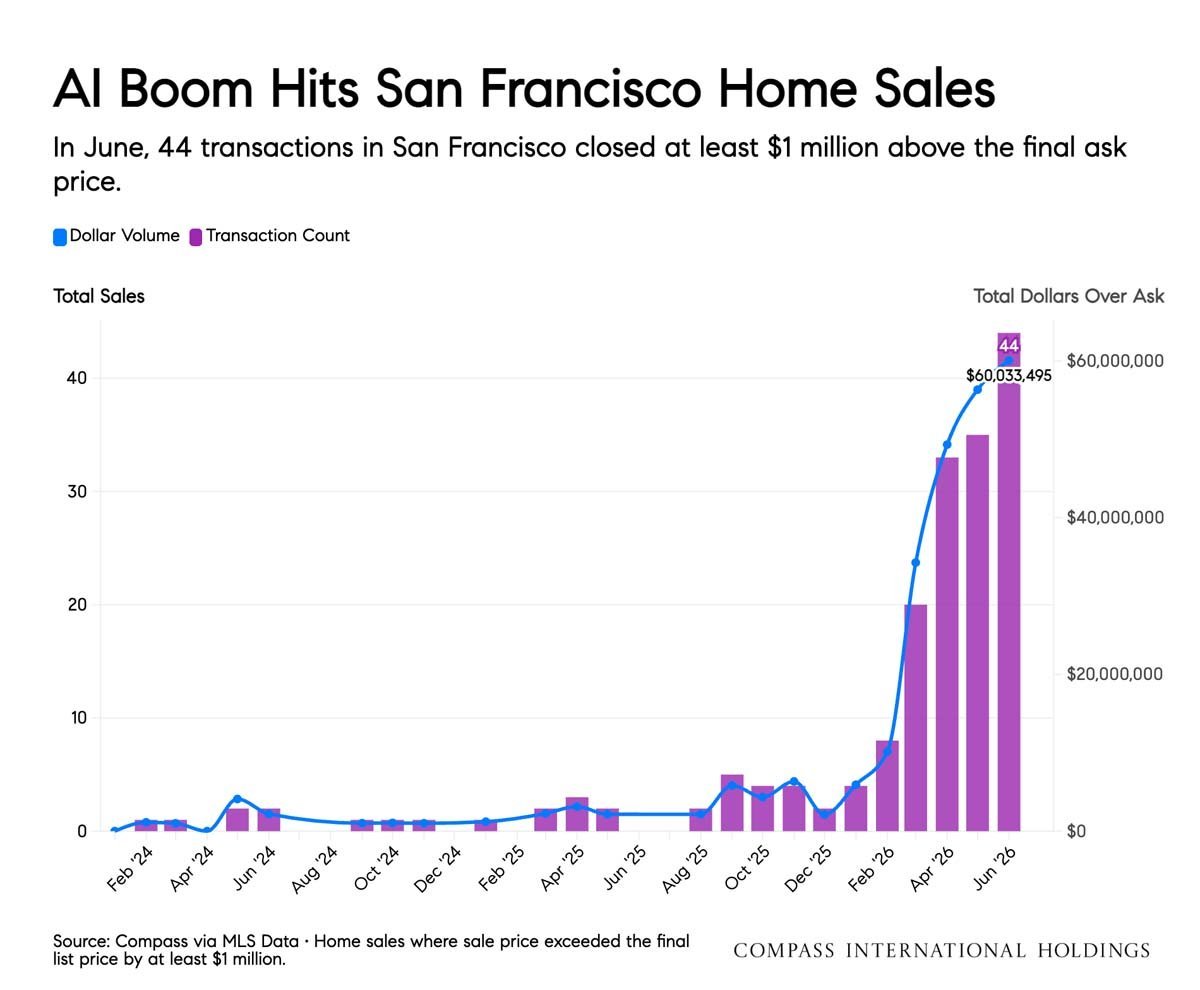
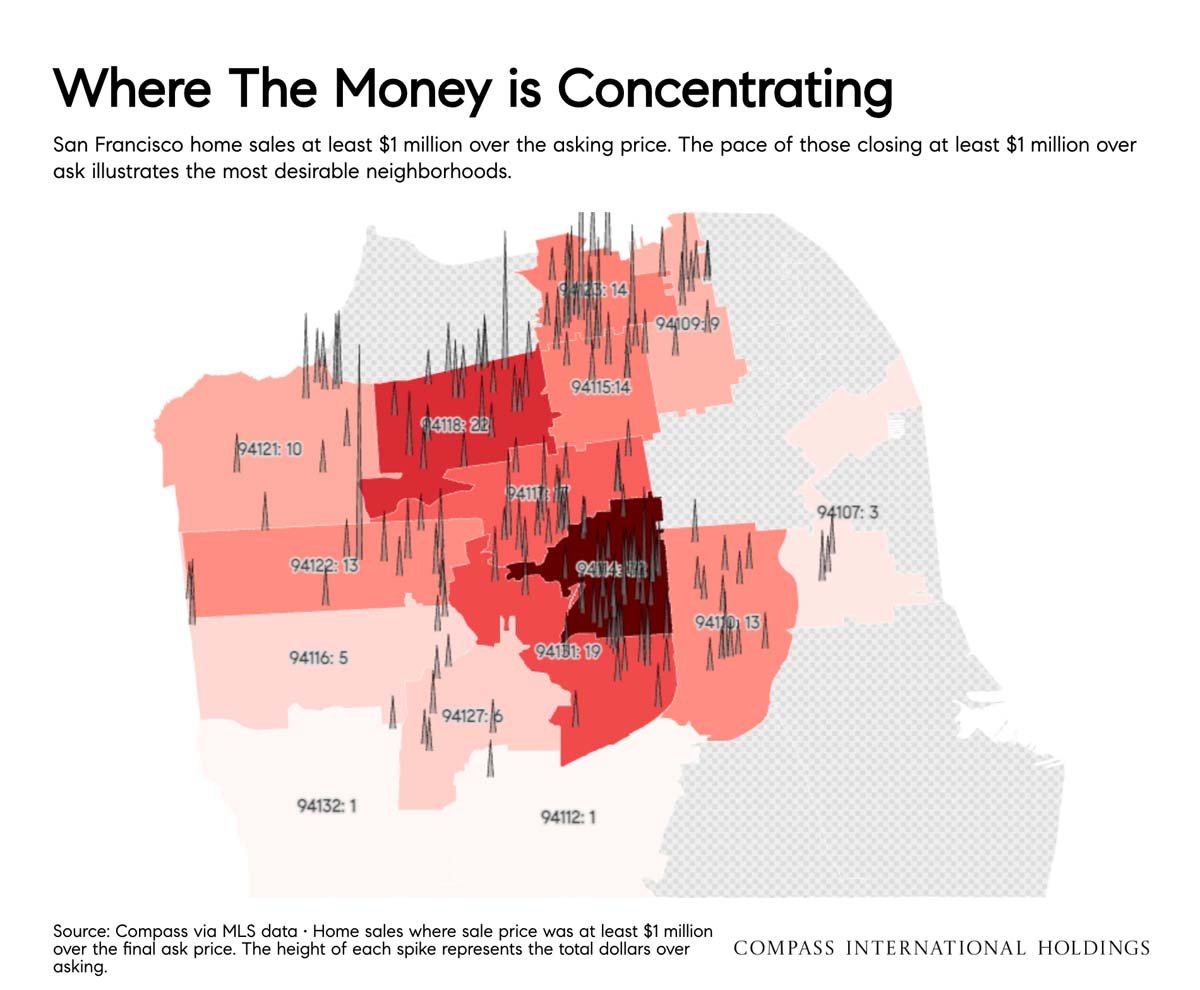
Chart showing San Francisco home sales closing at least $1 million above ask, rising to 44 transactions in June 2026.
San Francisco map showing ZIP-code counts of homes sold at least $1 million over asking, with darker red areas and black spikes.
Chart showing mortgage rates from April 2023 to July 2026, ending at 6.58%.
U.S. inflation line chart: June 2026 CPI 4.2%, PCE 3.8%.
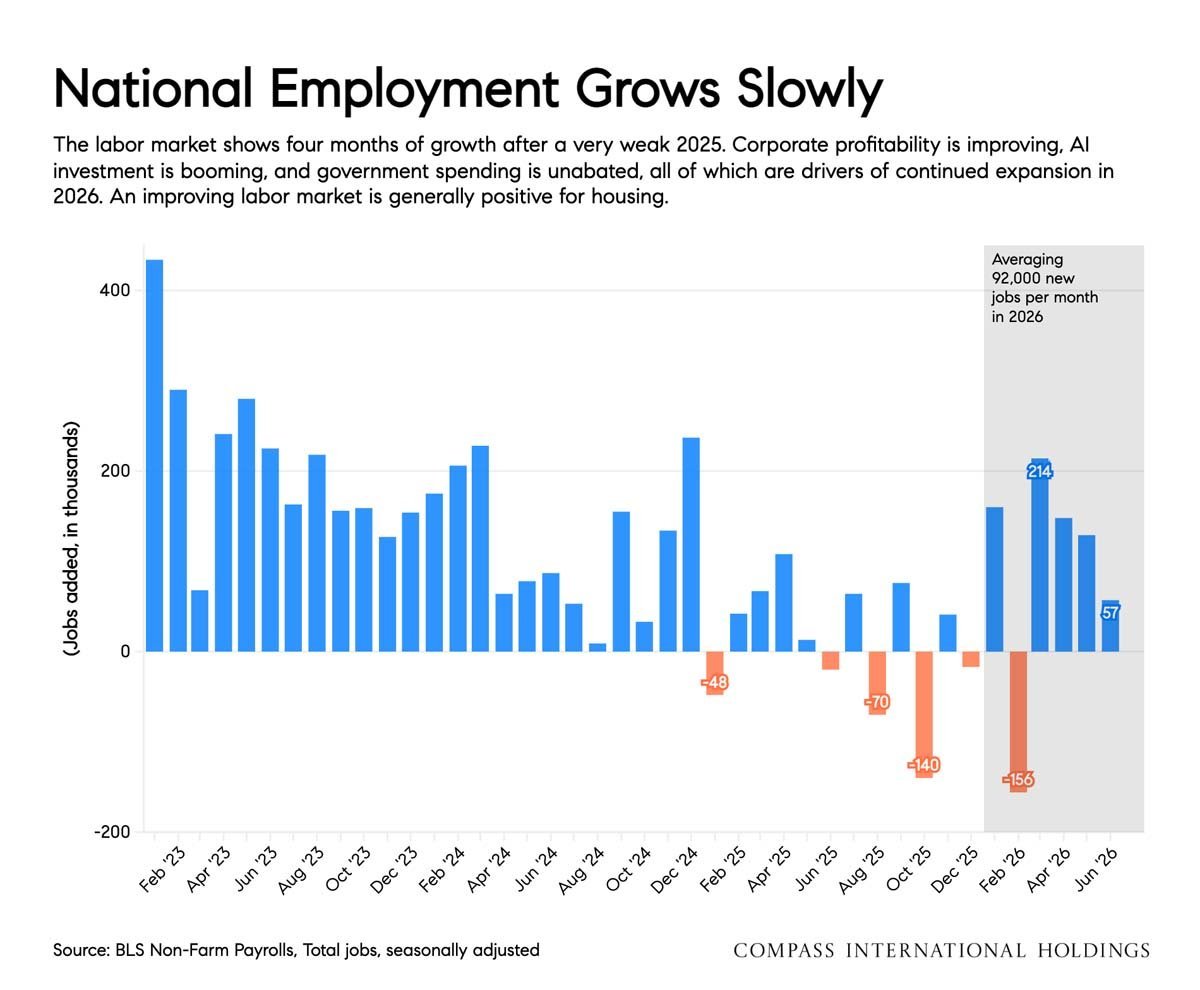
Bar chart of monthly U.S. job gains and losses, highlighting an average of 92,000 new jobs per month in 2026.
Bar chart shows Bay Area job growth slowing, with gains and losses through May 2026.
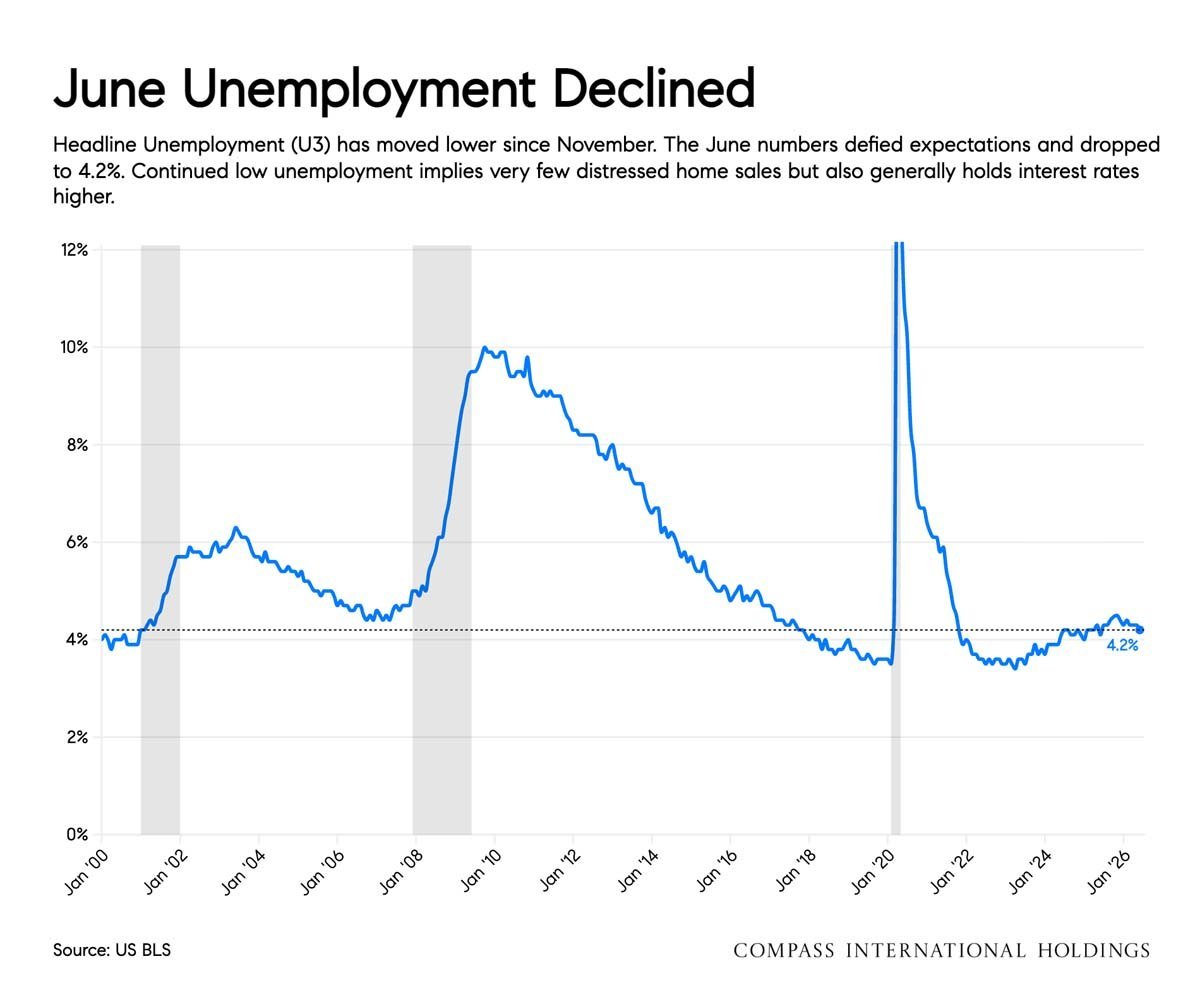
Line chart of U.S. unemployment from 2000 to 2026, ending at 4.2% in June.
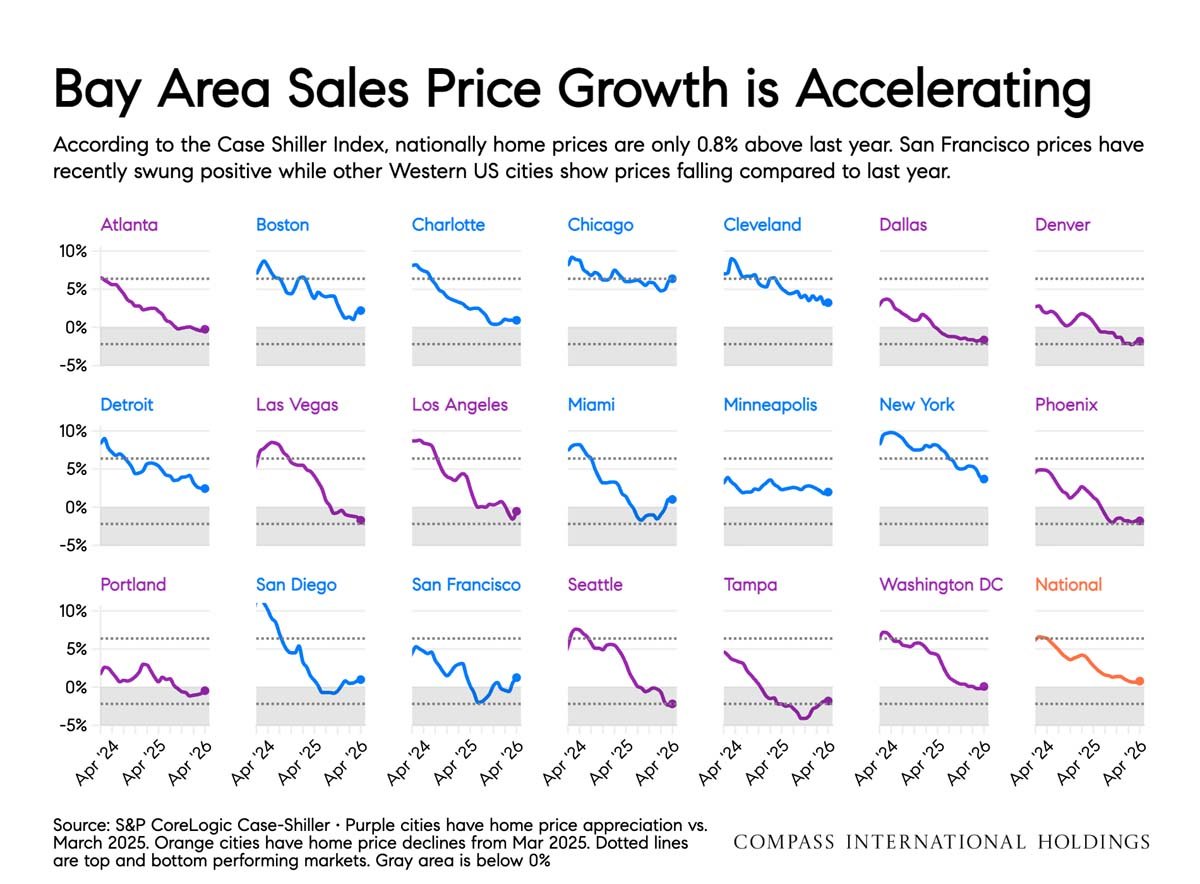
Infographic comparing home price trends across U.S. cities, with San Francisco prices recently turning positive.
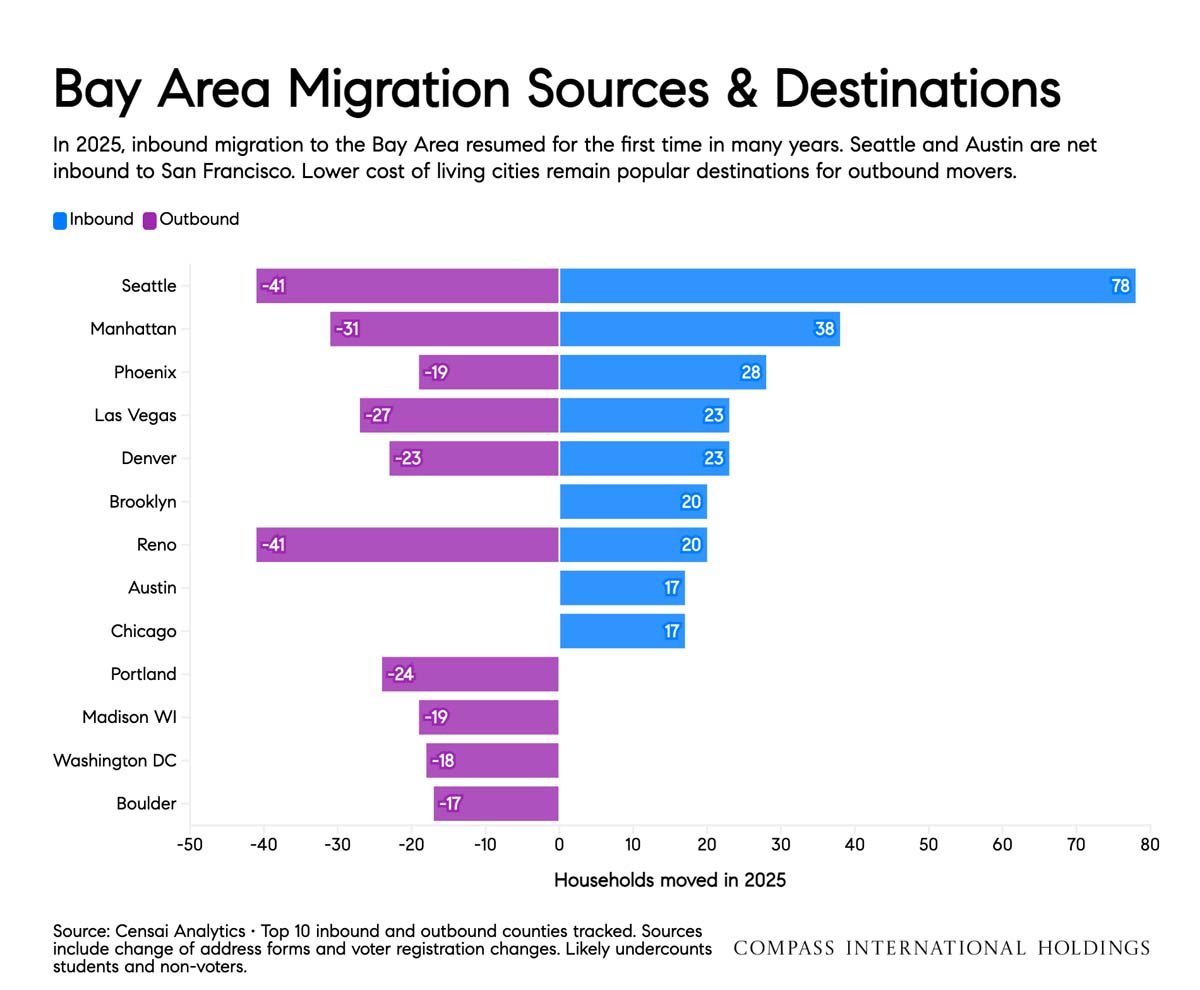
Chart comparing 2025 inbound and outbound household moves to the San Francisco Bay Area by city.
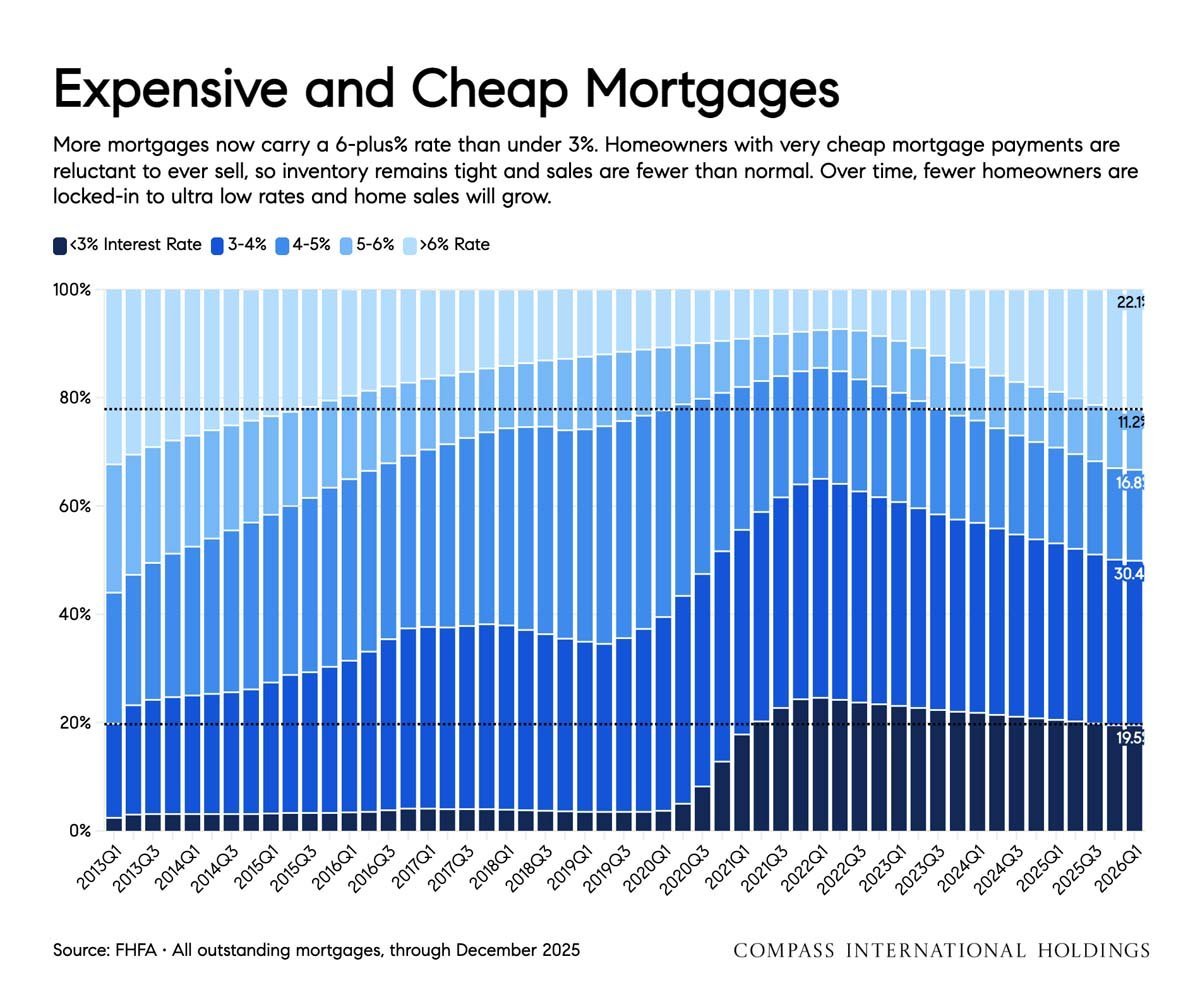
Stacked bar chart showing outstanding mortgages by interest-rate band from 2013 to 2026.
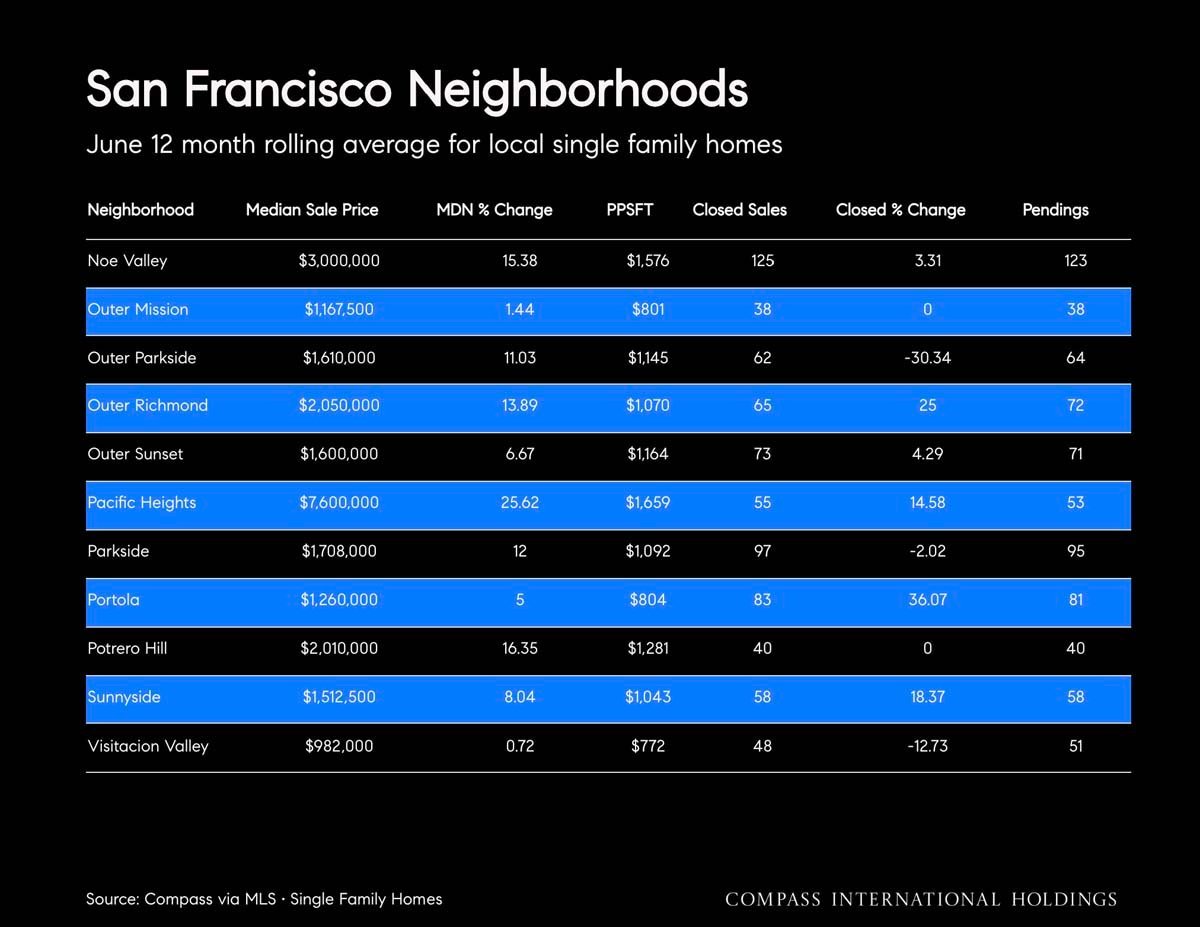
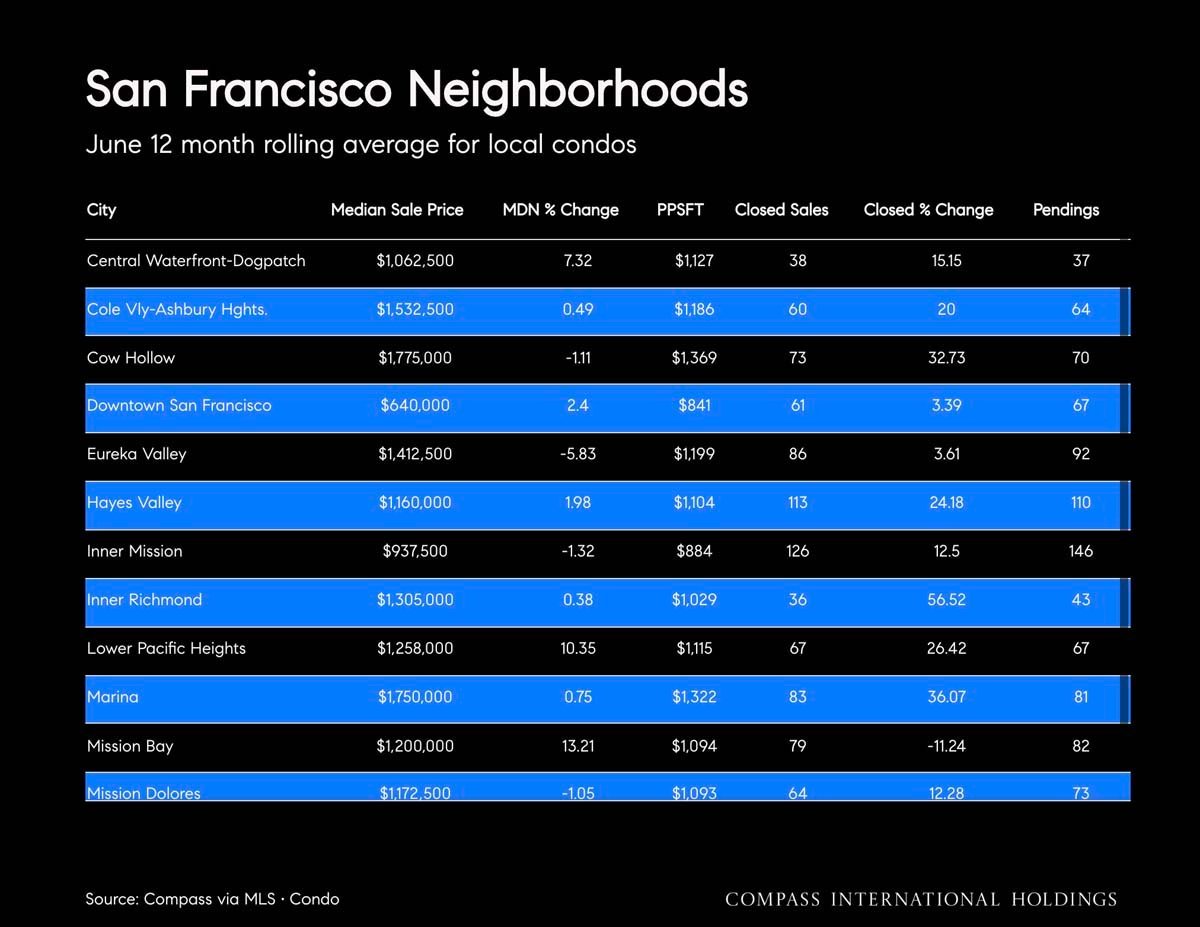
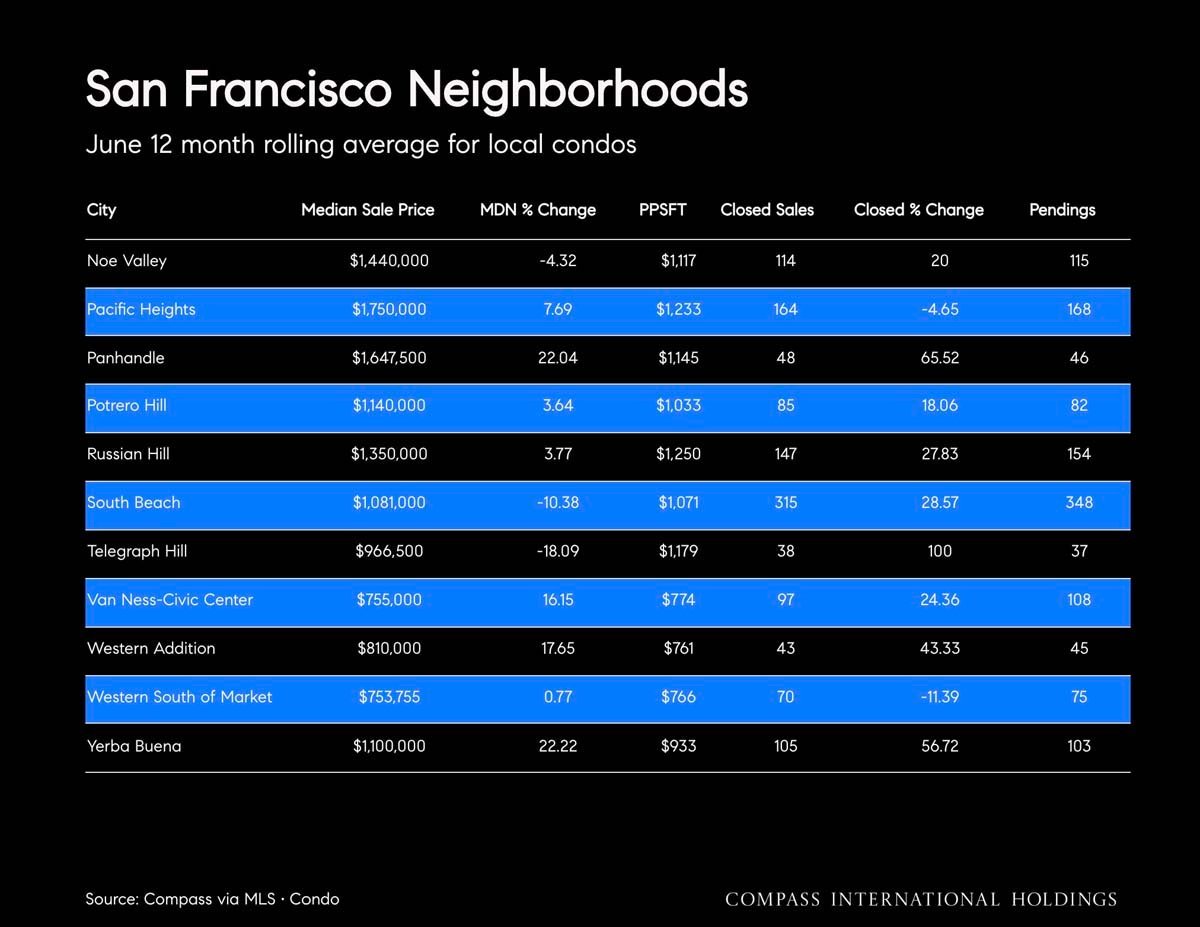
San Francisco neighborhood market table comparing home prices, sales, price changes, and pending sales.
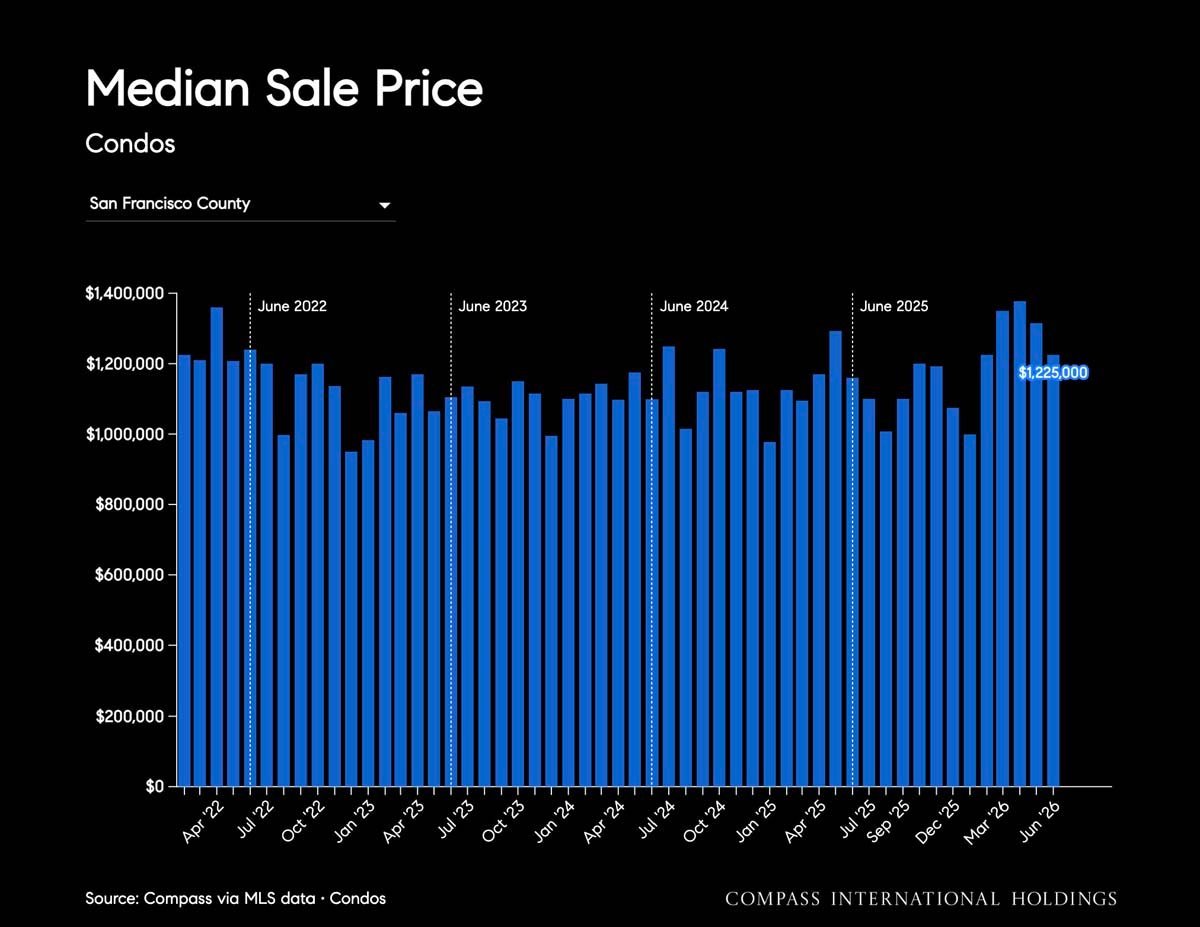
Chart of San Francisco County condo median sale prices from 2022 to June 2026, ending at $1,225,000.
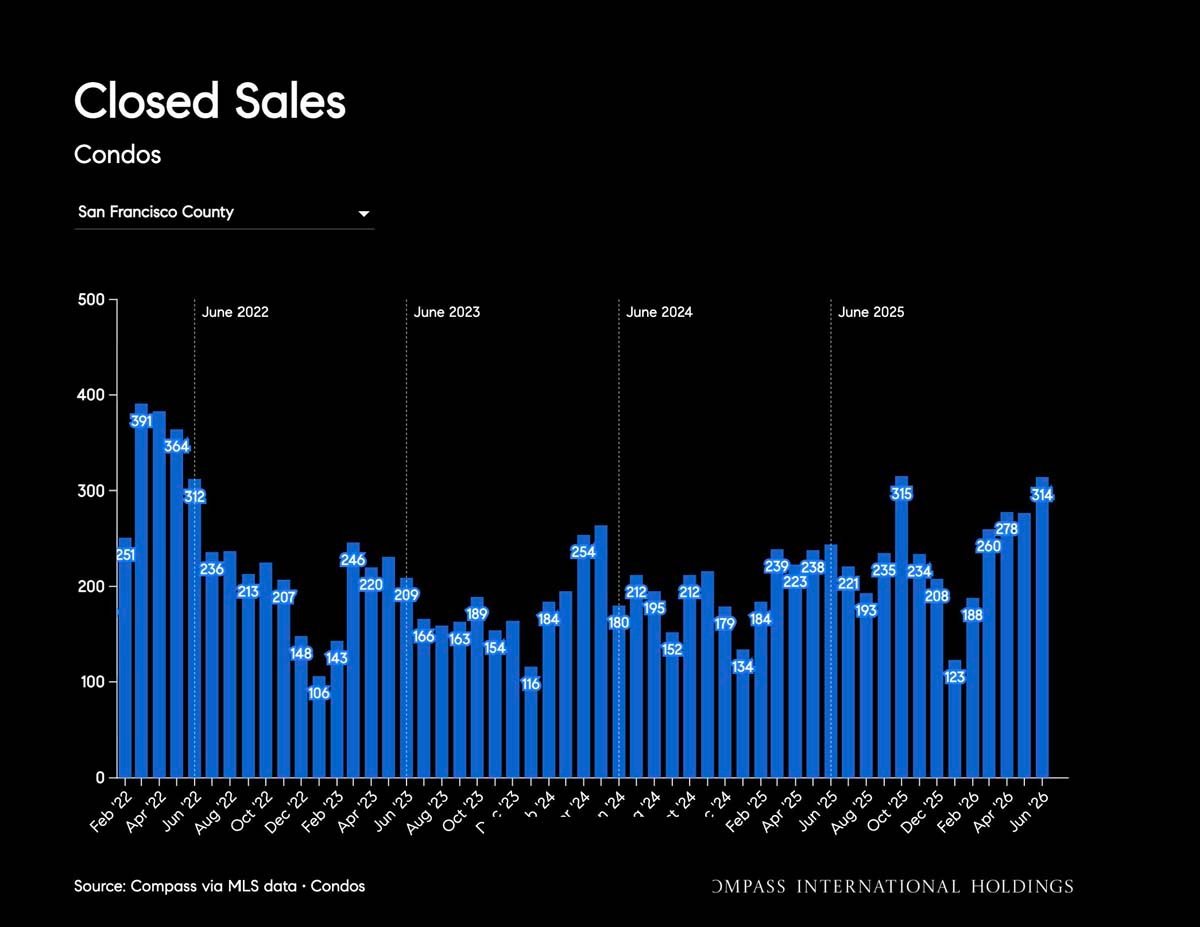
Bar chart of monthly San Francisco County condo closed sales, February 2022–June 2026, with blue bars and labeled counts.
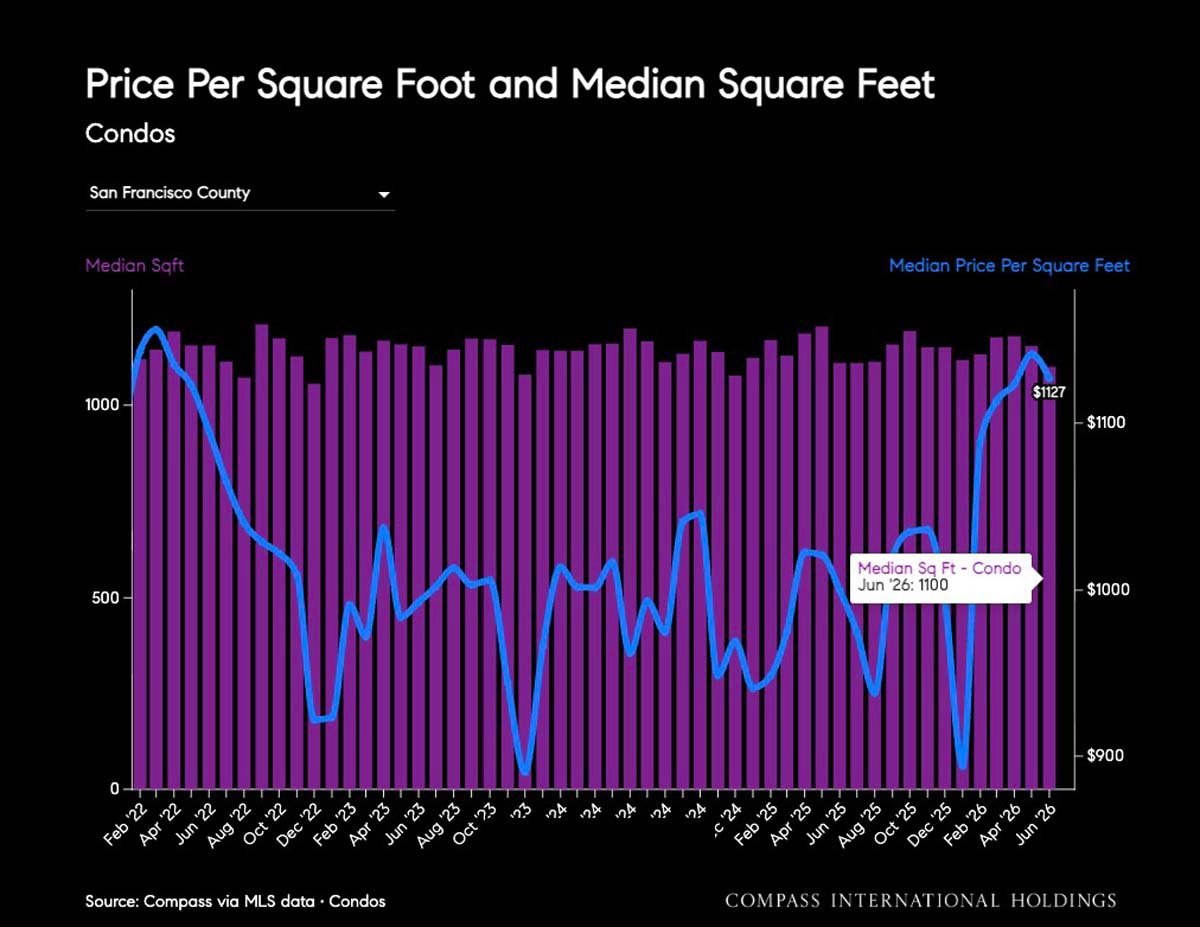
San Francisco County condo chart comparing median square footage and price per square foot from 2022 to 2026.
San Francisco neighborhood condo market table with median prices, sales changes, and pending listings.
San Francisco condo market chart comparing neighborhood sale prices, price changes, closed sales, and pending sales.

Work With Jane

Get assistance in determining the current property value, crafting a competitive offer, writing and negotiating a contract, and much more. Contact me today.

Follow Me on Instagram