September 2026 San Francisco House & Condo Market Outlook

September 2026 San Francisco House & Condo Outlook

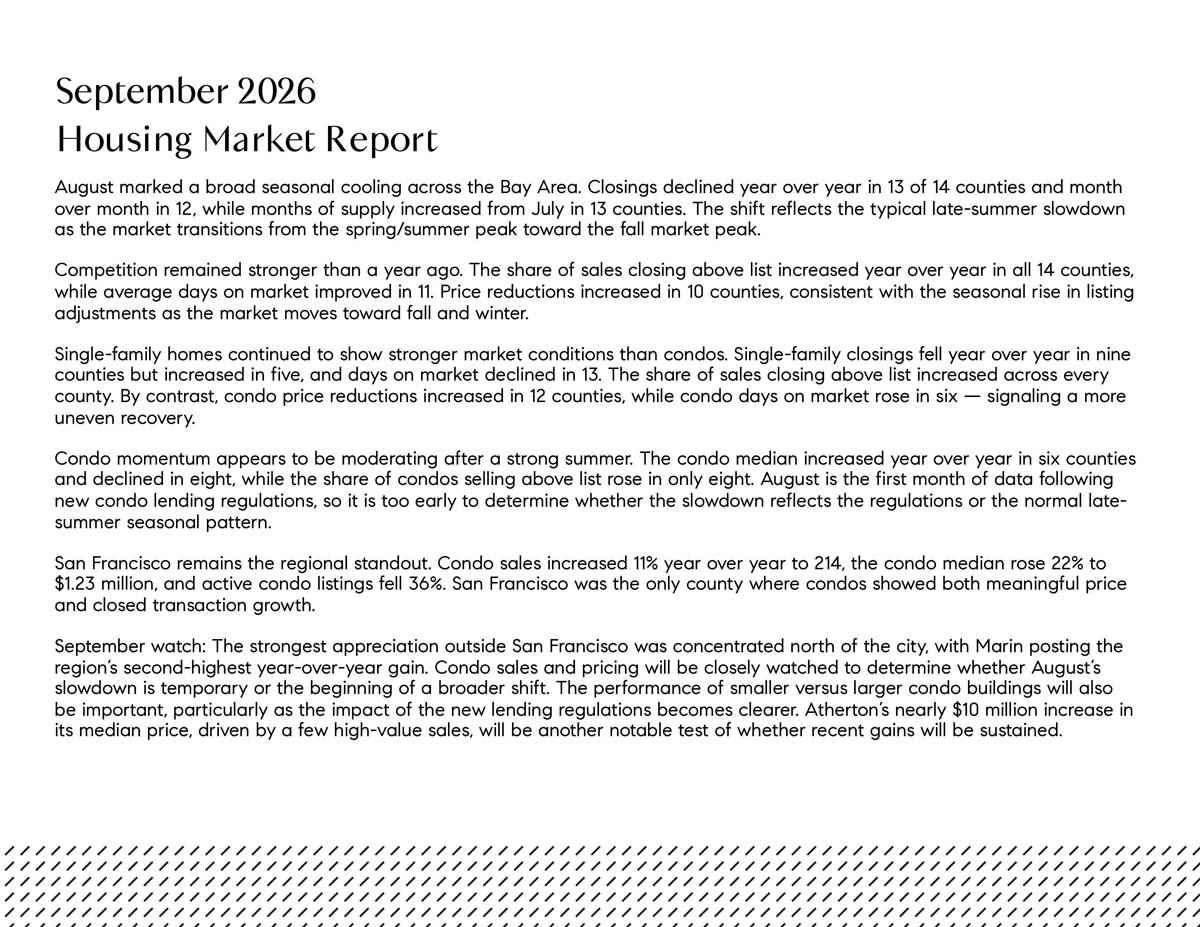
August marked a broad seasonal cooling across the Bay Area. Closings declined year over year in 13 of 14 counties and month over month in 12, while months of supply increased from July in 13 counties. The shift reflects the typical late-summer slowdown as the market transitions from the spring/summer peak toward the fall market peak.

Competition remained stronger than a year ago. The share of sales closing above list increased year over year in all 14 counties, while average days on market improved in 11. Price reductions increased in 10 counties, consistent with the seasonal rise in listing adjustments as the market moves toward fall and winter.

Single-family homes continued to show stronger market conditions than condos. Single-  family closings fell year over year in nine counties but increased in five, and days on market declined in 13. The share of sales closing above list increased across every county. By contrast, condo price reductions increased in 12 counties, while condo days on market rose in six-signaling a more uneven recovery.

Condo momentum appears to be moderating after a strong summer. The condo median increased year over year in six counties and declined in eight, while the share of condos selling above list rose in only eight. August is the first month of data following new condo lending regulations, so it is too early to determine whether the slowdown reflects the regulations or the normal late- summer seasonal pattern.

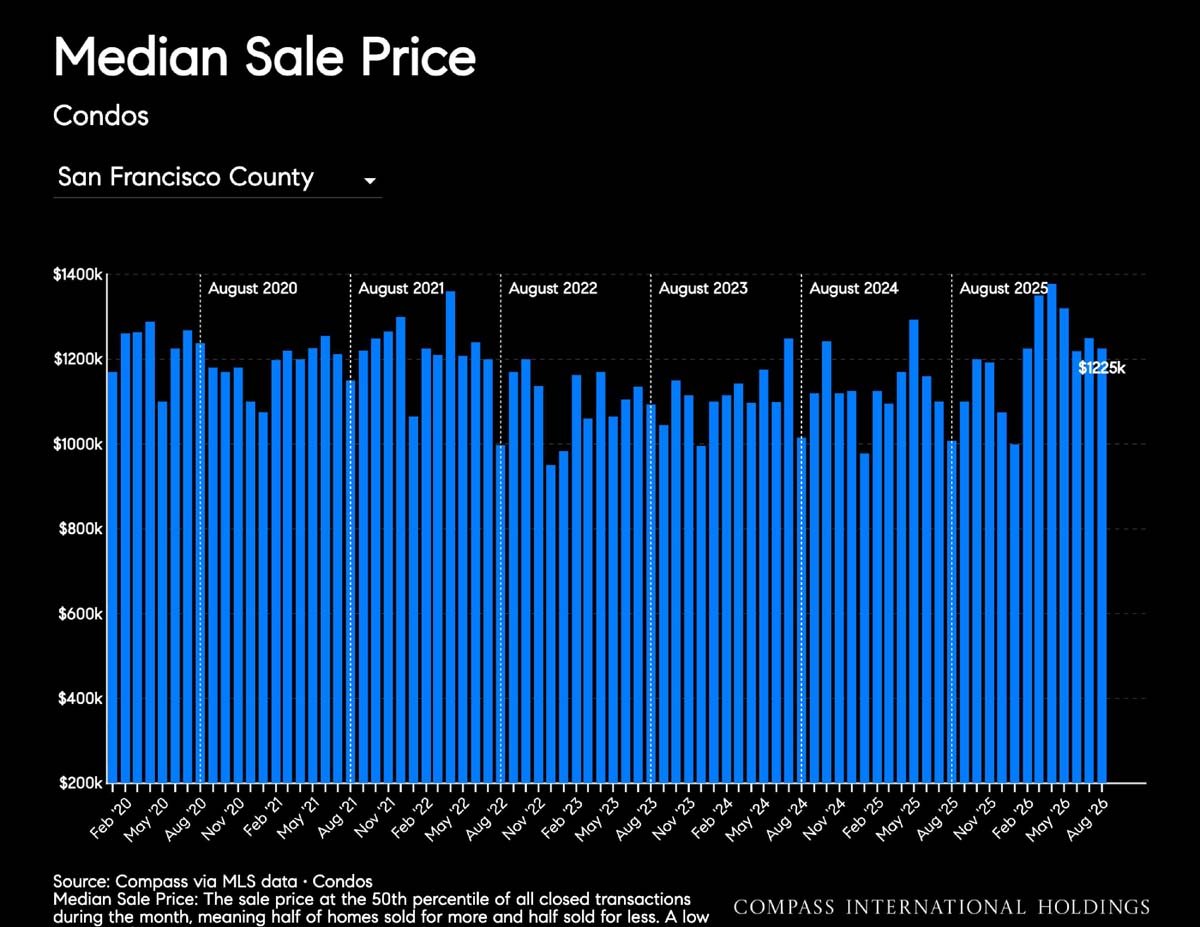
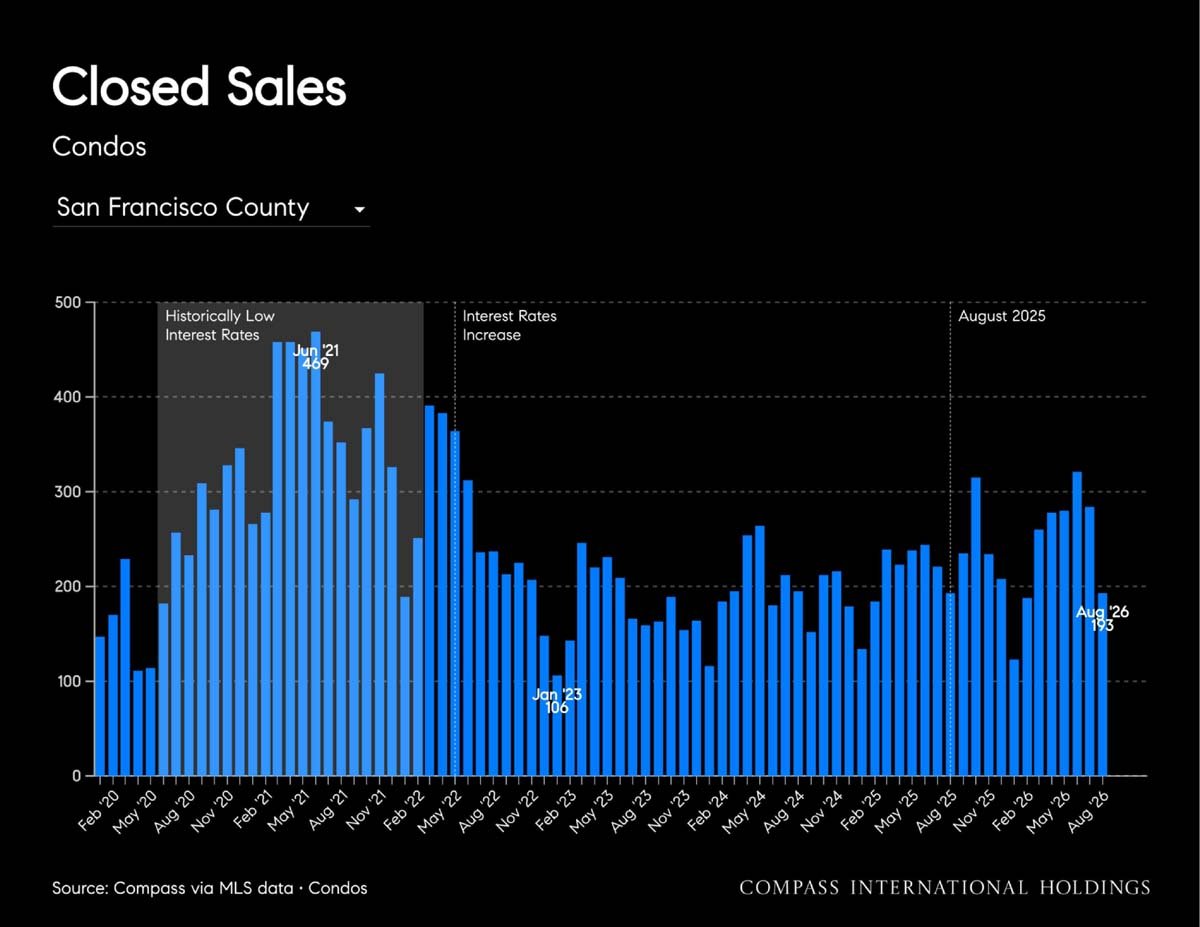
San Francisco remains the regional standout. Condo sales increased 11% year over year to 214, the condo median rose 22% to $1.23 million, and active condo listings fell 36%. San Francisco was the only county where condos showed both meaningful price and closed transaction growth.

September watch: The strongest appreciation outside San Francisco was concentrated north of the city, with Marin posting the region's second-highest year-over-year gain. Condo sales and pricing will be closely watched to determine whether August's slowdown is temporary or the beginning of a broader shift. The performance of smaller versus larger condo buildings will also be important, particularly as the impact of the new lending regulations becomes clearer. Atherton's nearly $10 million increase in its median price, driven by a few high-value sales, will be another notable test of whether recent gains will be sustained.
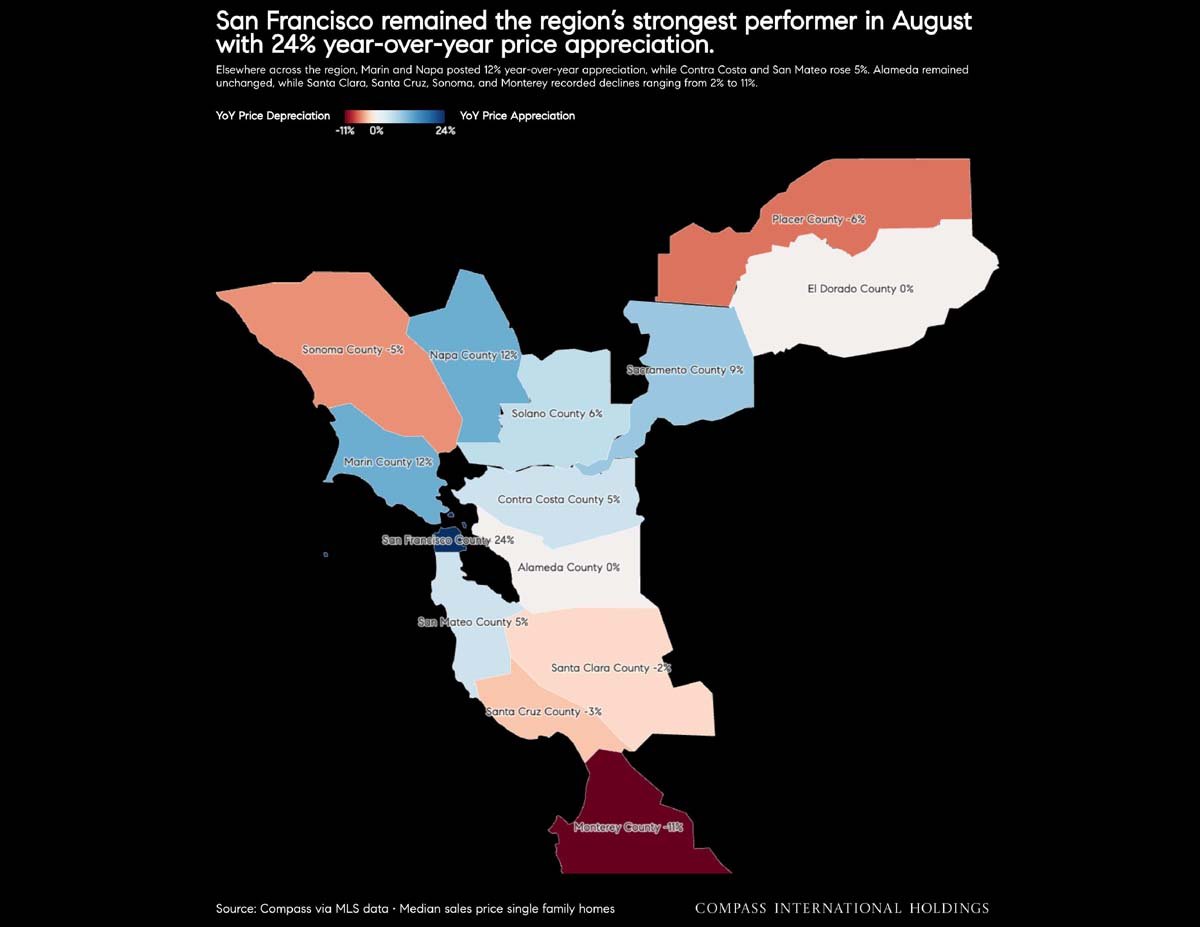
 

Map infographic showing August year-over-year home price changes across San Francisco and surrounding counties; San Francisco leads at 24%.
September 2026 Bay Area housing market report covering seasonal trends, condo activity, and San Francisco figures.
San Francisco Market report cover featuring a cable car on a city street at night.
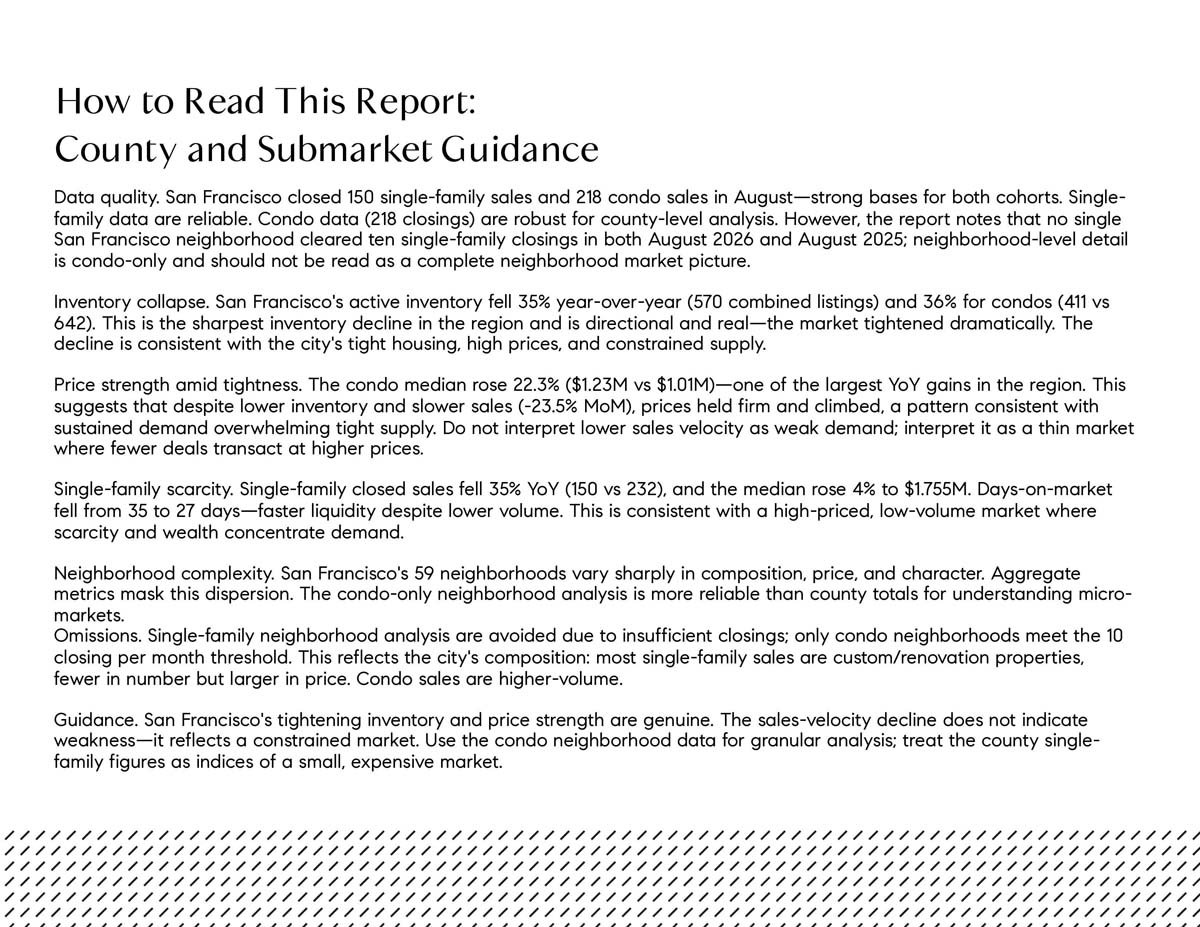
Report guidance explains San Francisco housing data, declining inventory, rising prices, and neighborhood analysis limitations.
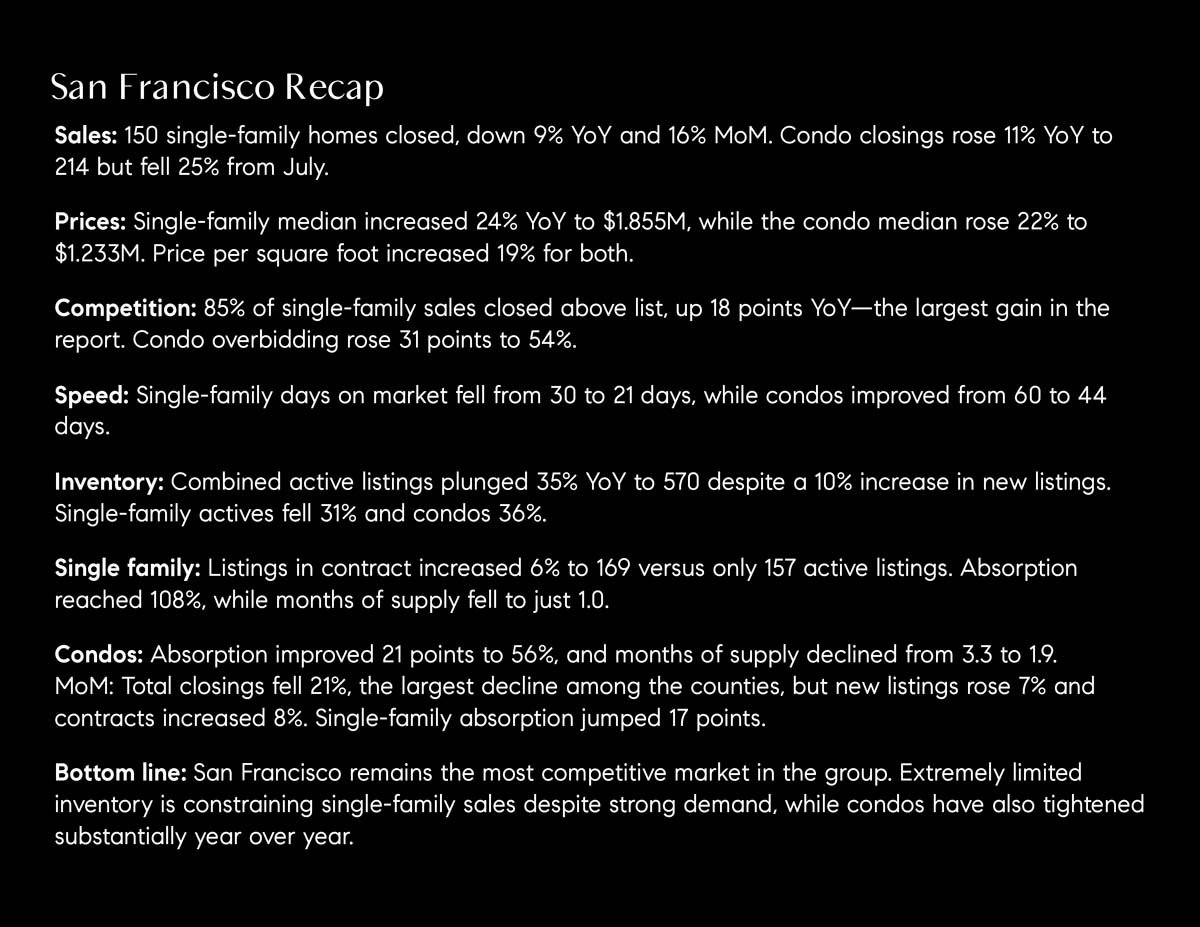
San Francisco September 2026 housing market recap with sales, prices, competition, inventory, and supply statistics.
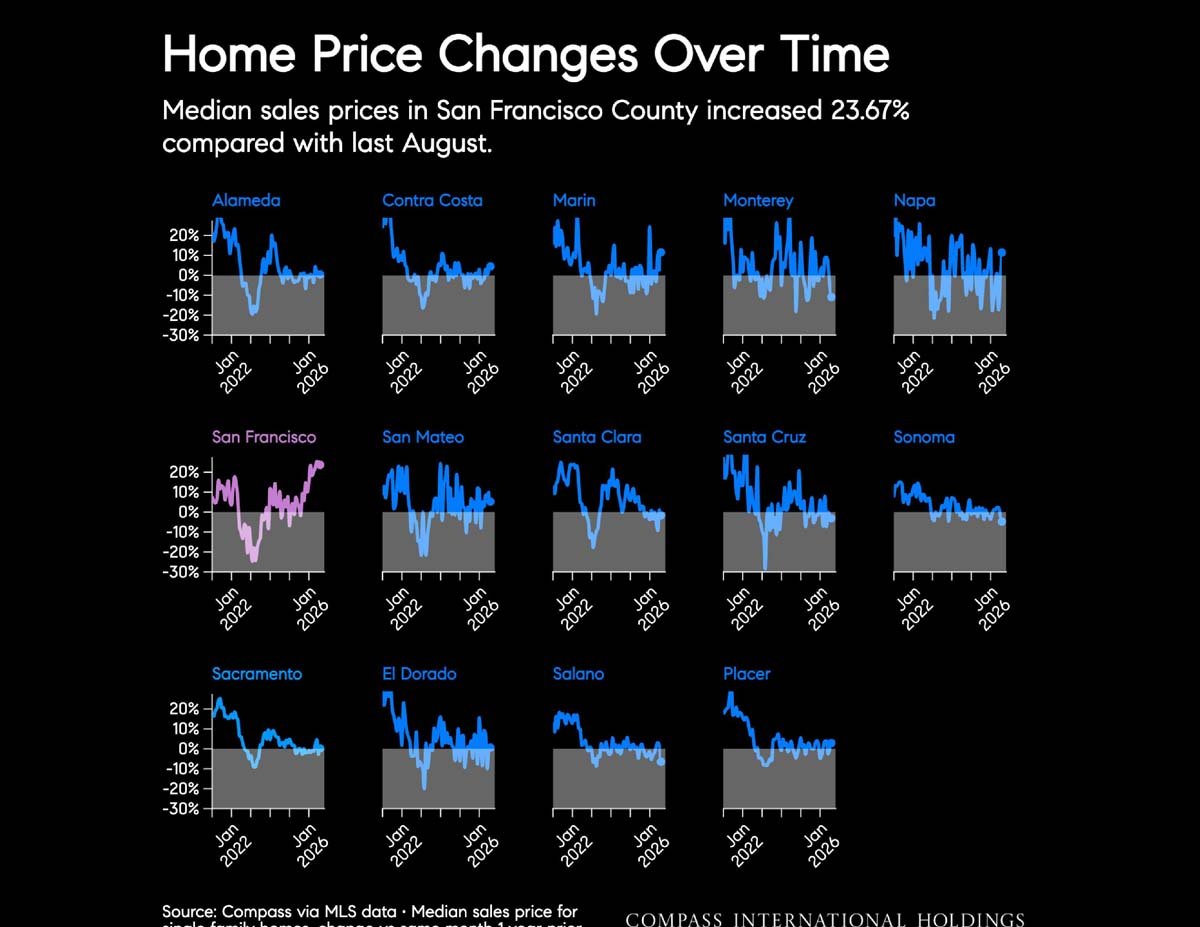
Chart of home price changes across 14 California counties, with San Francisco highlighted and a 23.67% year-over-year increase stated.
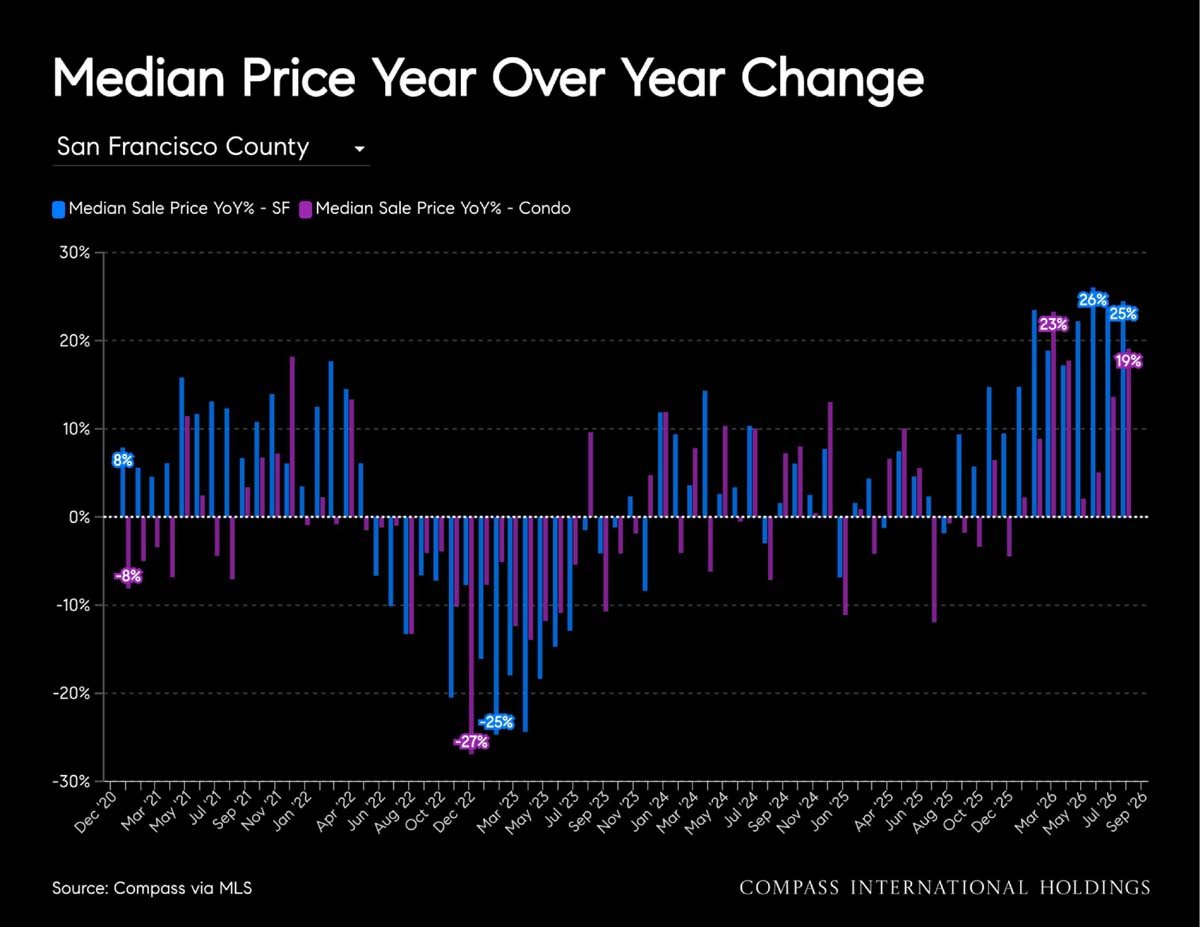
San Francisco County year-over-year home and condo median price changes, with a 2022–2023 downturn and 2026 rebound.
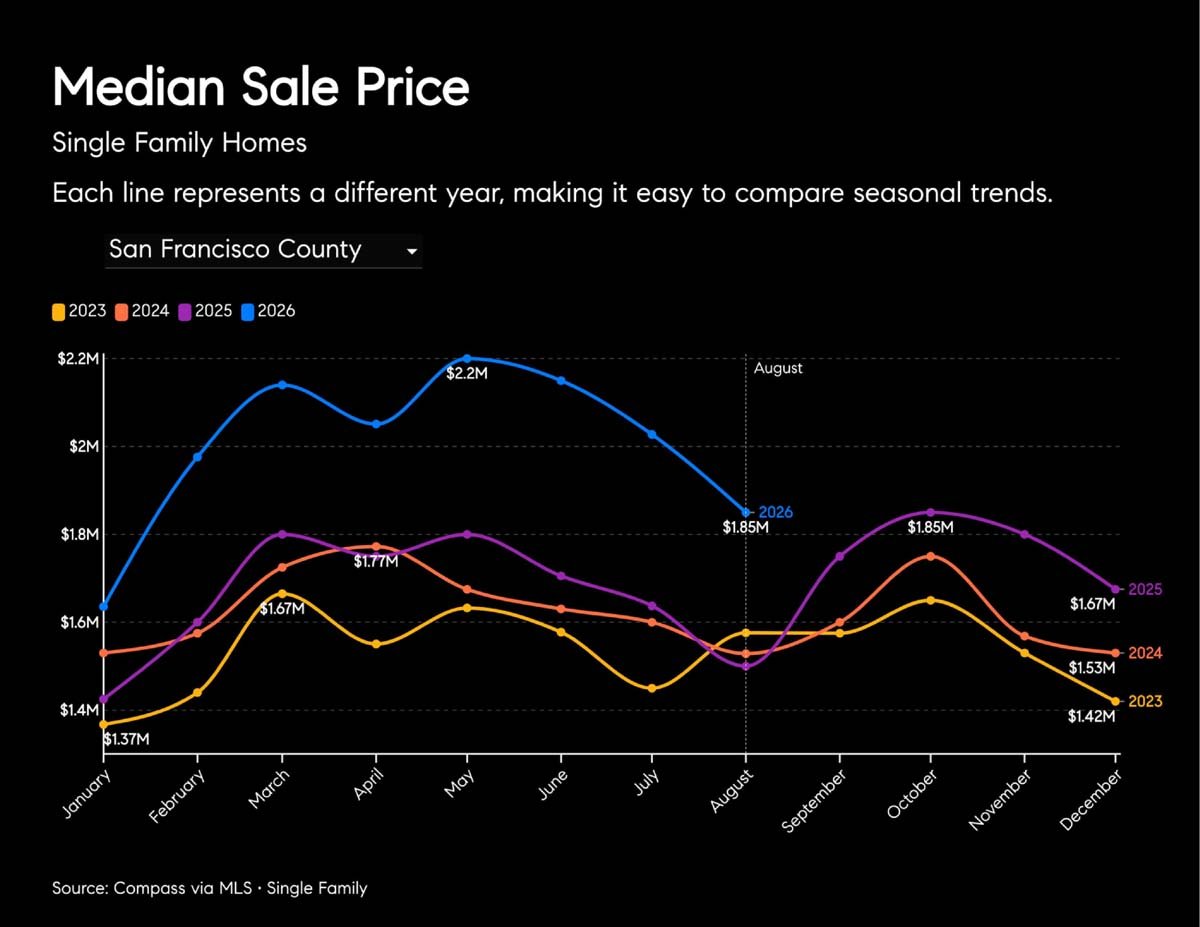
Line chart comparing monthly San Francisco County single-family home median sale prices from 2023 to 2026.
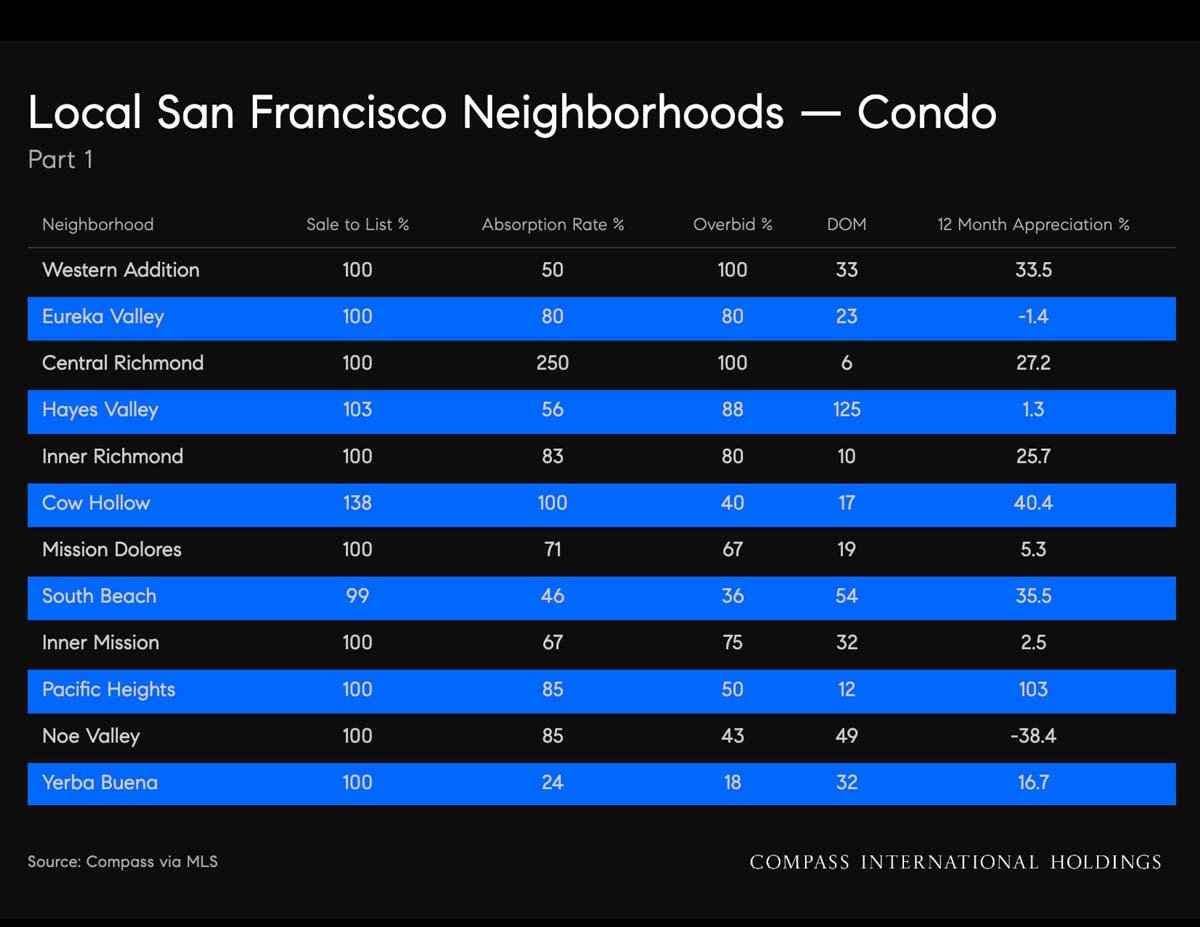
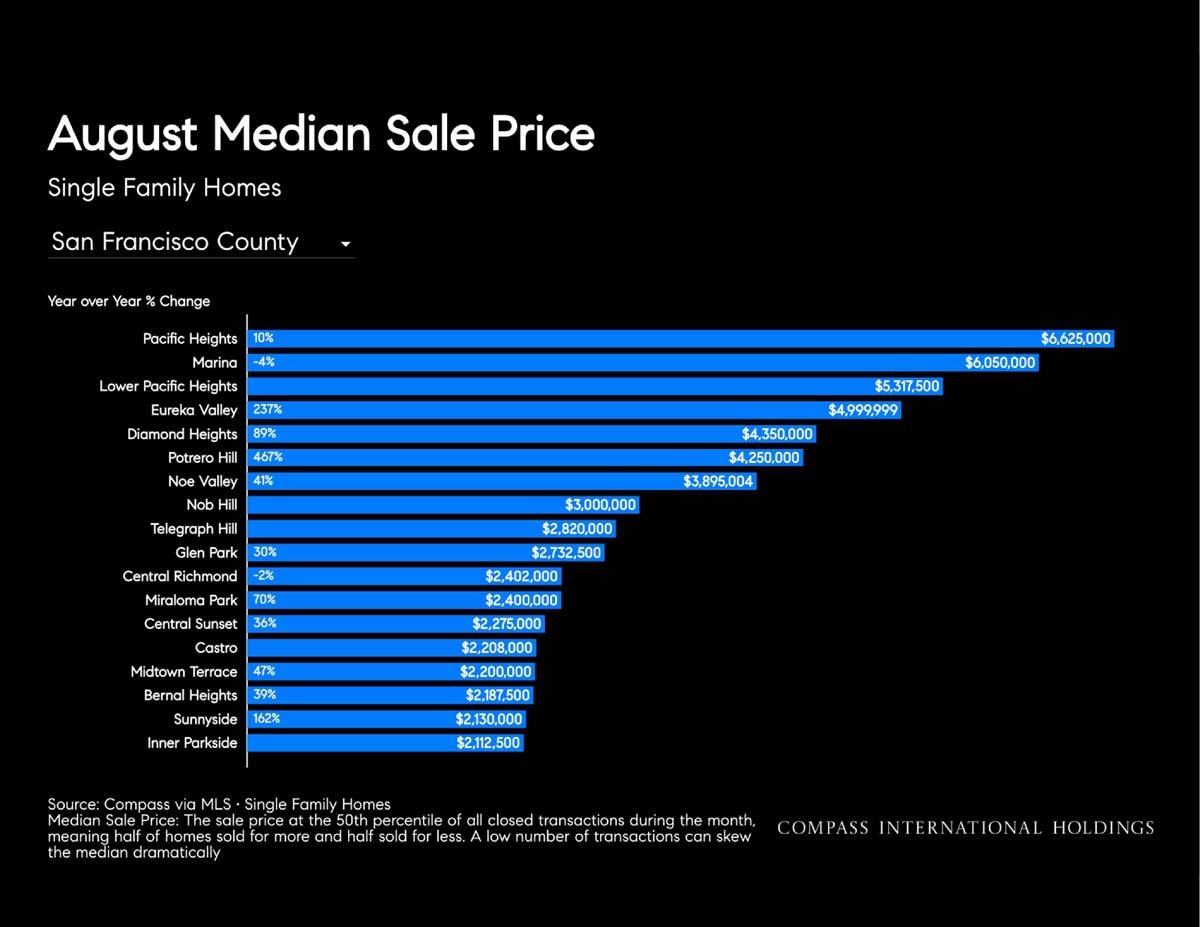
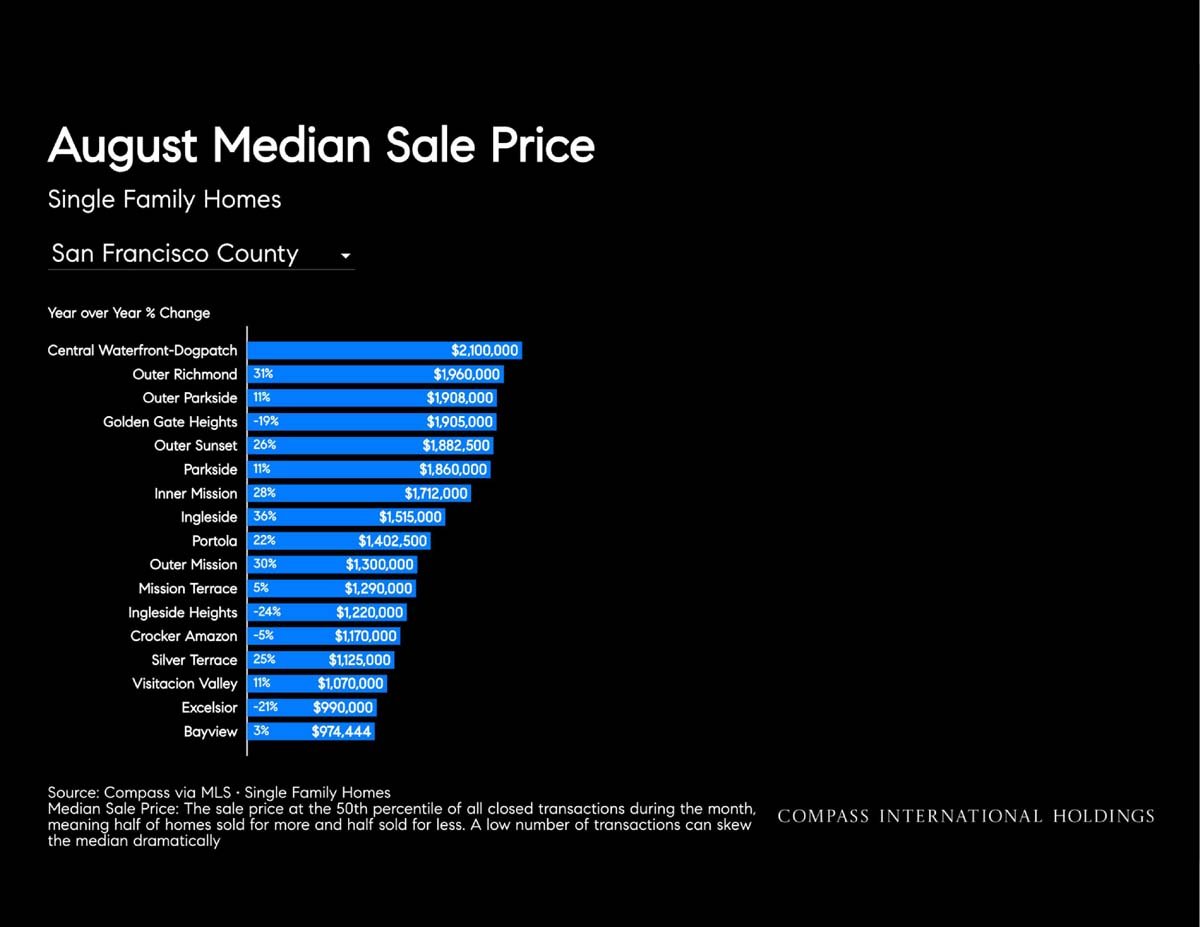
Chart of August San Francisco single-family home median prices by neighborhood, with year-over-year changes.
Chart of August San Francisco single-family home median prices and year-over-year changes by neighborhood.
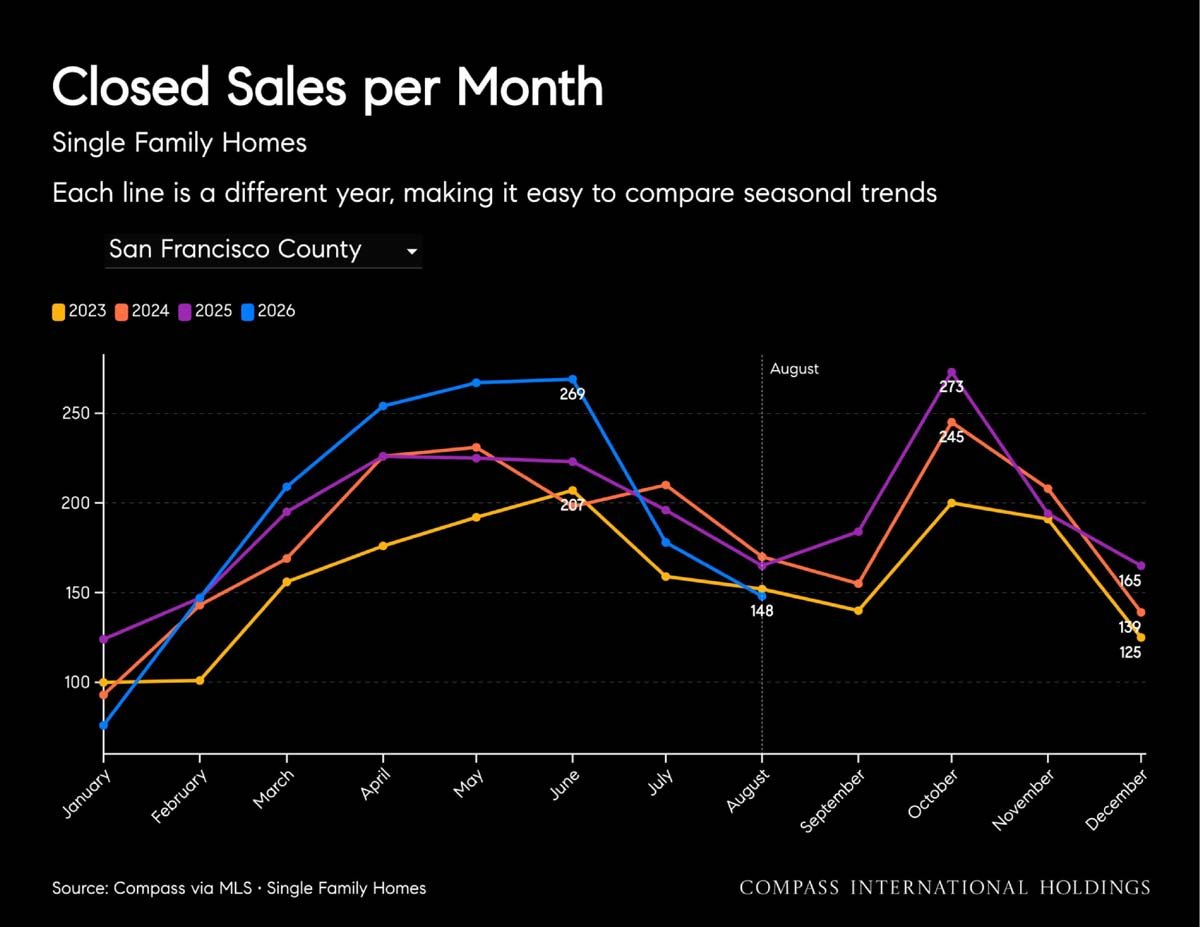
Chart comparing monthly San Francisco County single-family home sales from 2023 to 2026, with an October peak.
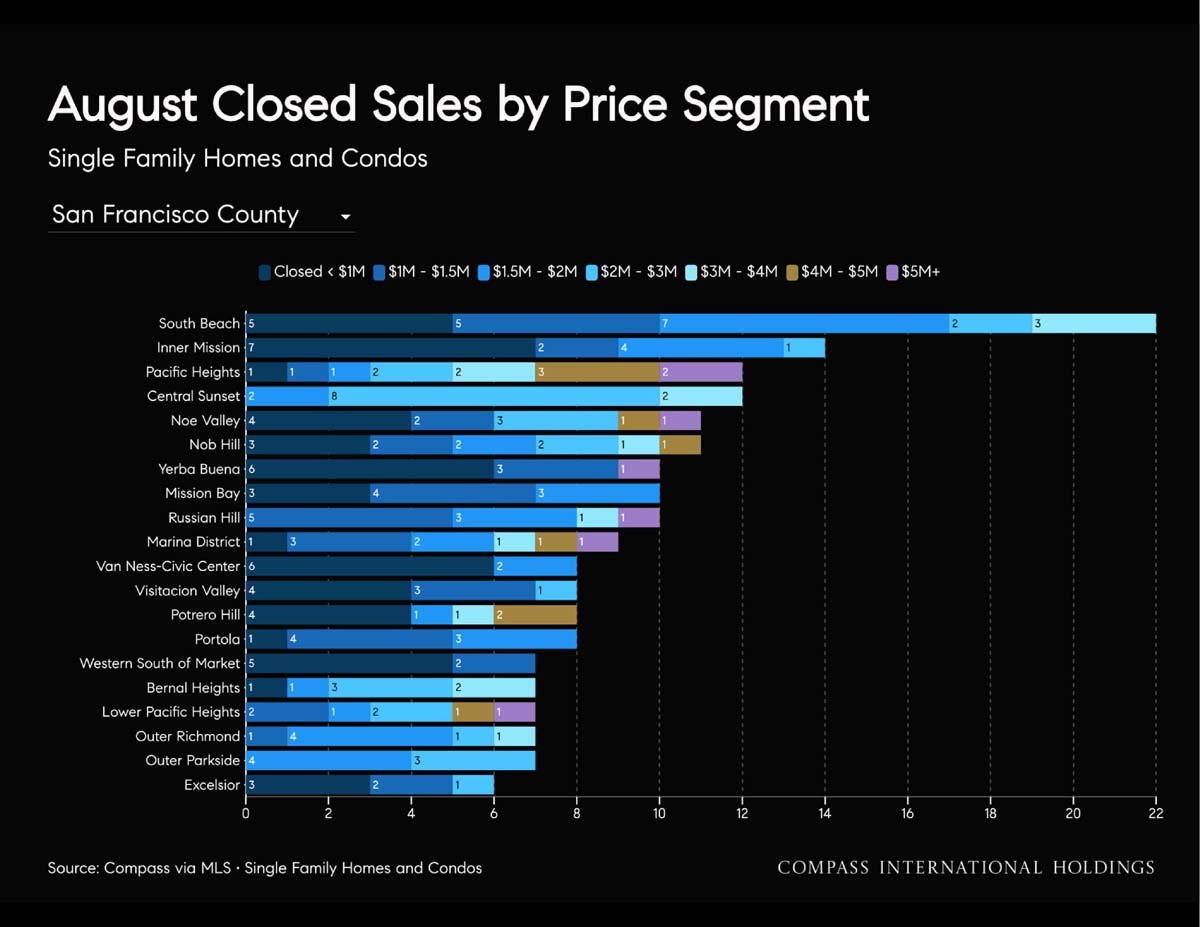
Stacked bar chart of August San Francisco home and condo sales by neighborhood and price segment; South Beach leads.
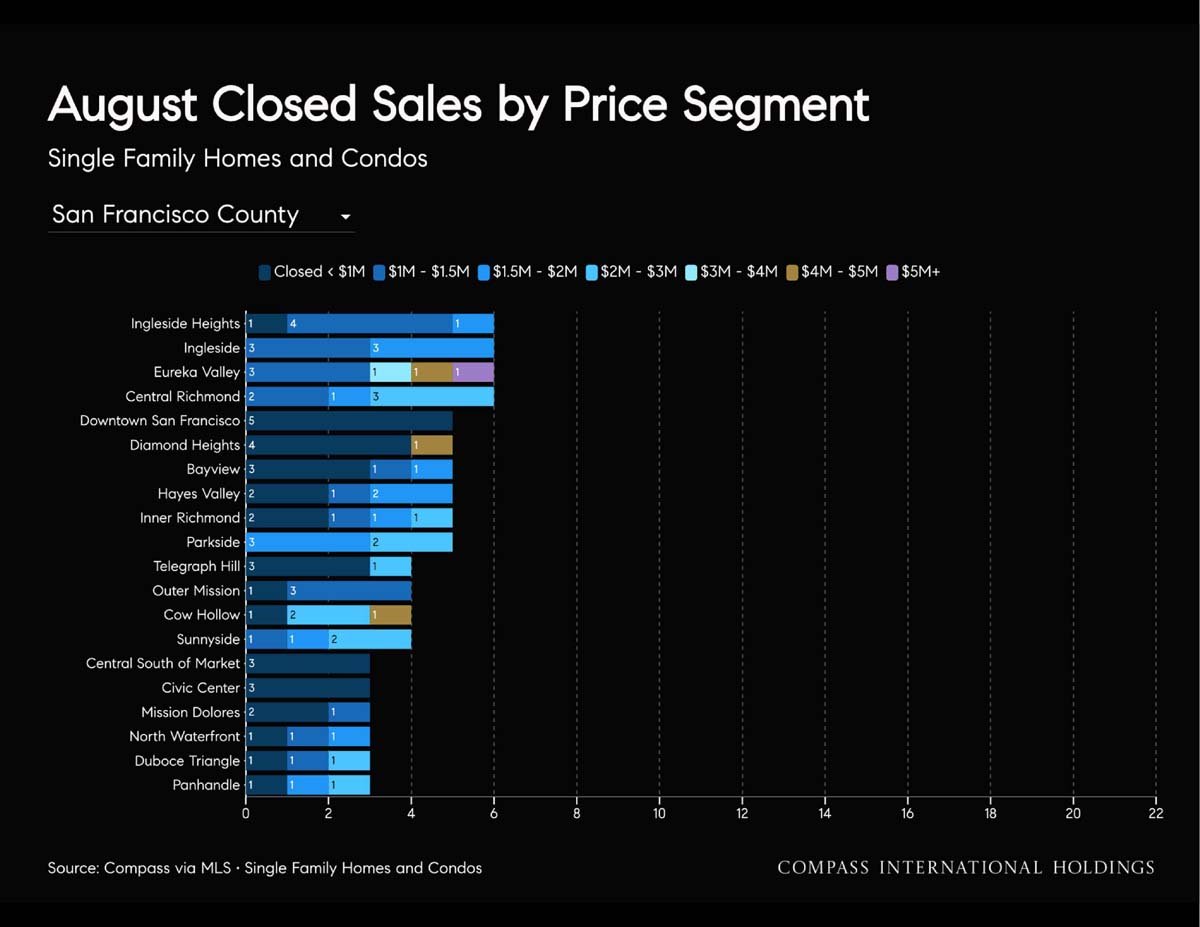
Chart of August closed home sales by price segment across San Francisco neighborhoods.
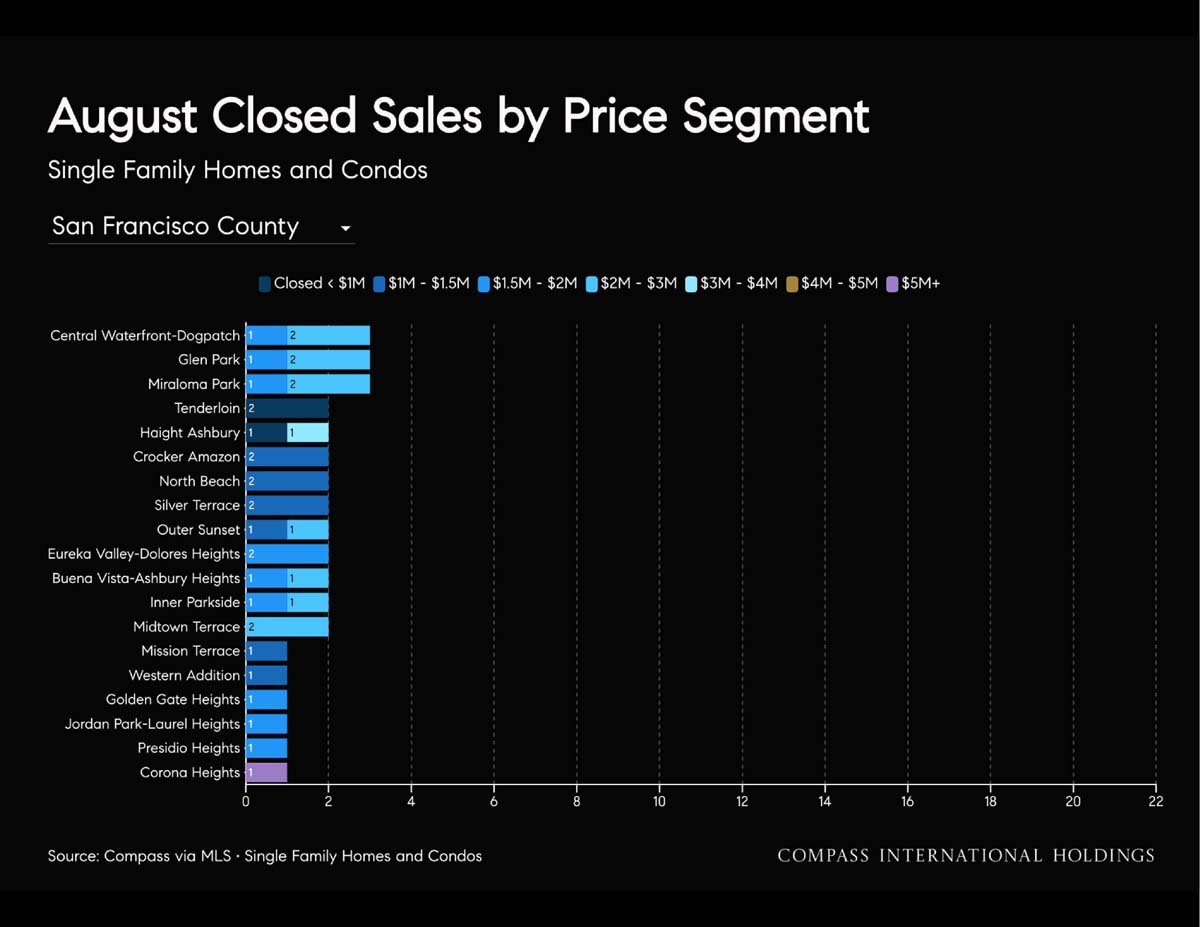
Bar chart of August home and condo sales by San Francisco neighborhood and price range.
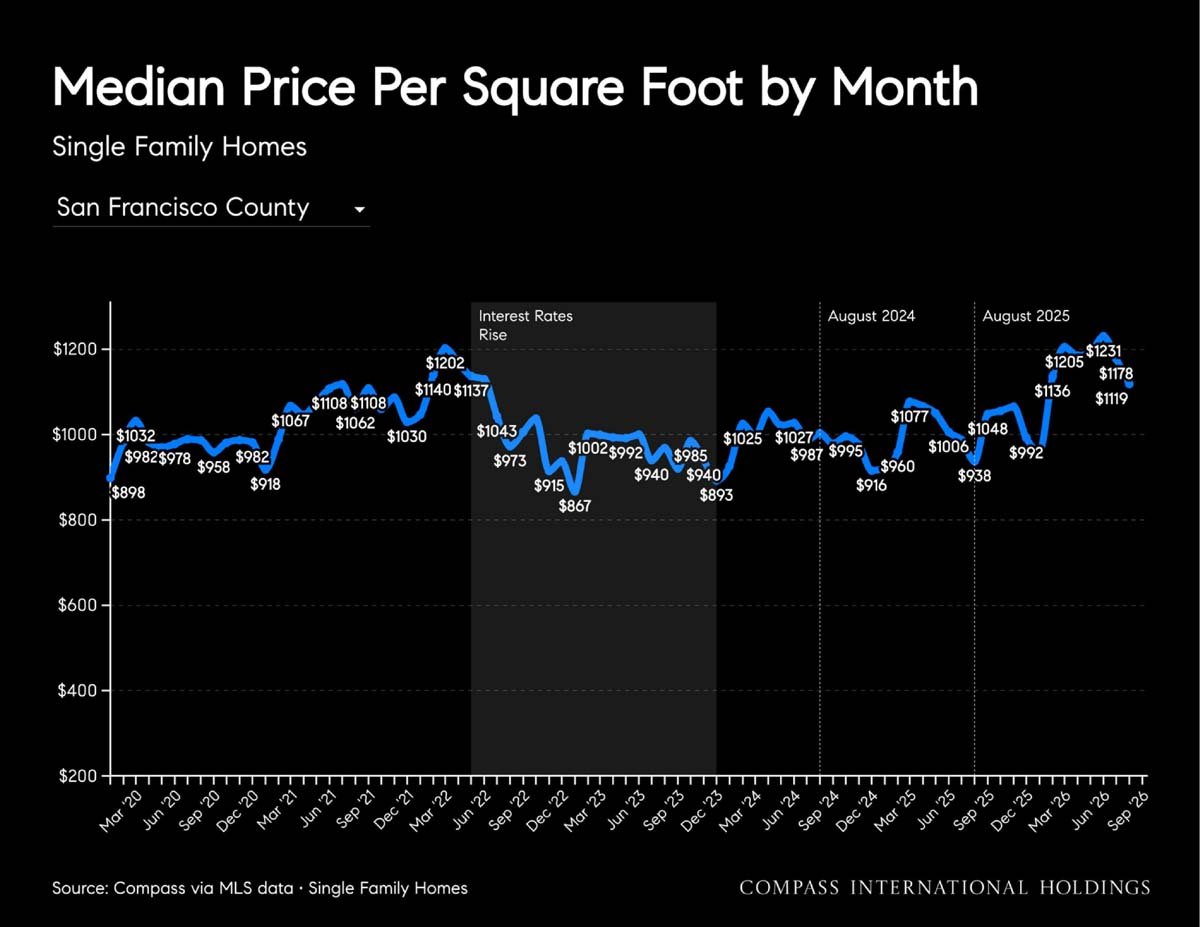
Line chart of San Francisco County single-family home prices per square foot, March 2020–September 2026.
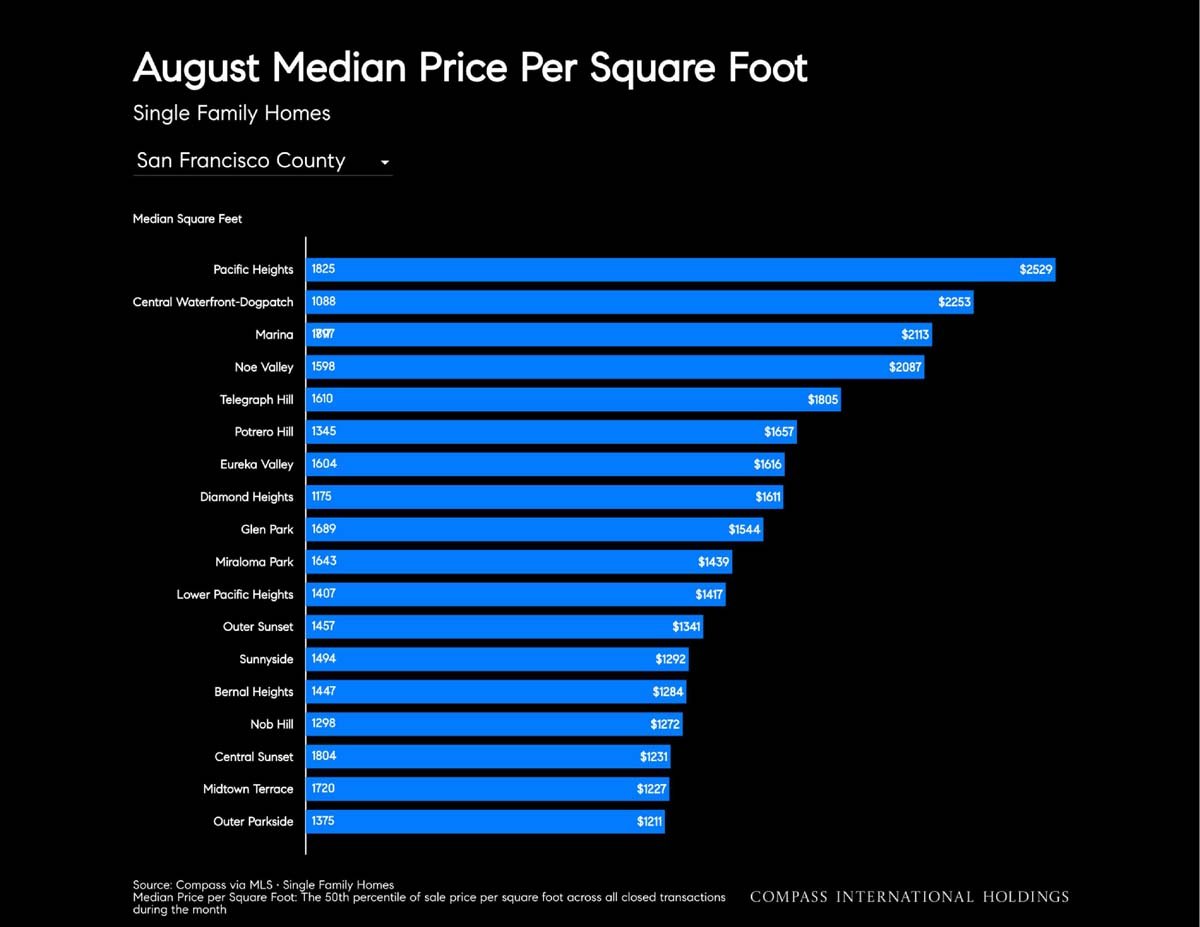
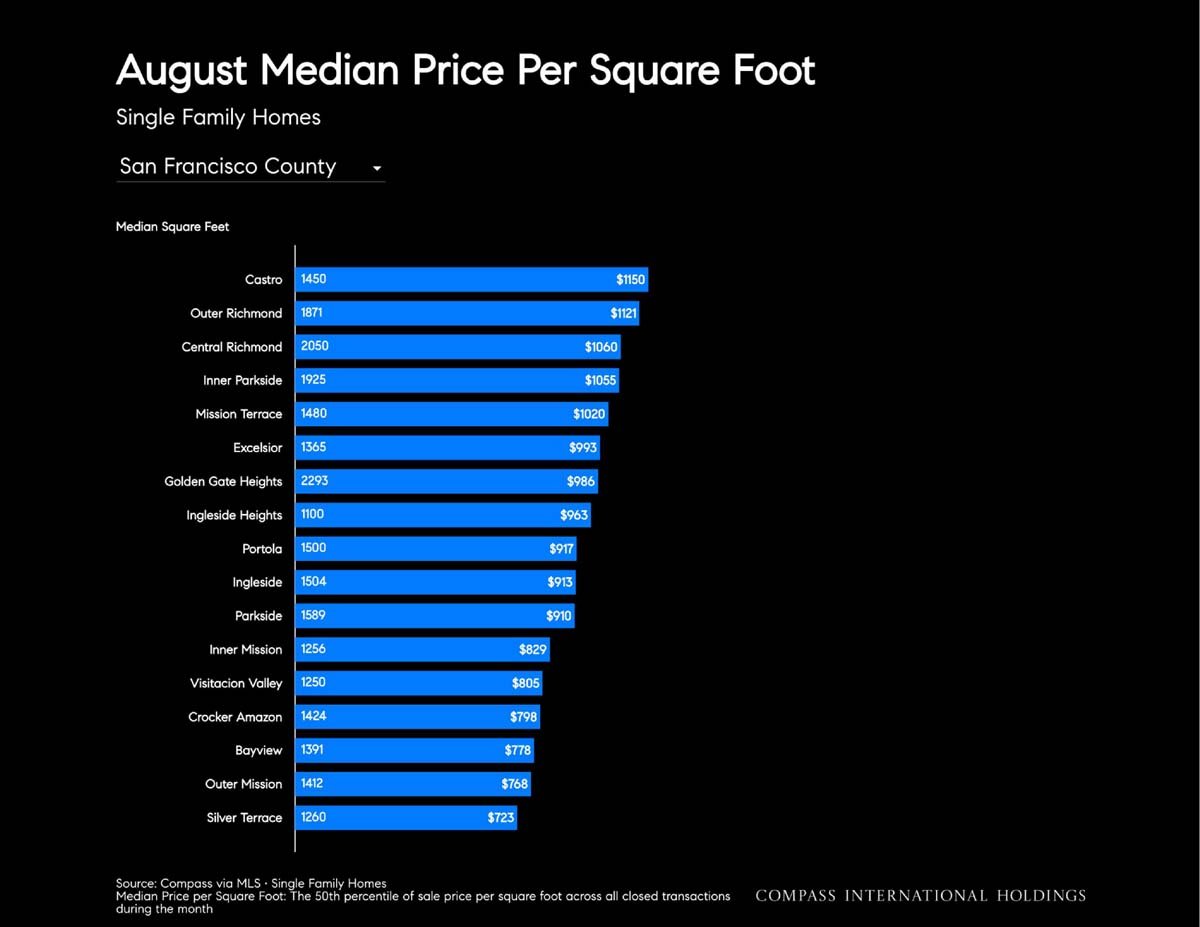
Bar chart of August San Francisco single-family home prices per square foot by neighborhood, led by Pacific Heights at $2,529.
Chart of August single-family home median price per square foot across San Francisco neighborhoods.
San Francisco County condo median sale price chart, February 2020–August 2026; latest value $1,225k.
Chart of San Francisco County condo sales from February 2020 to August 2026, ending at 193 sales.
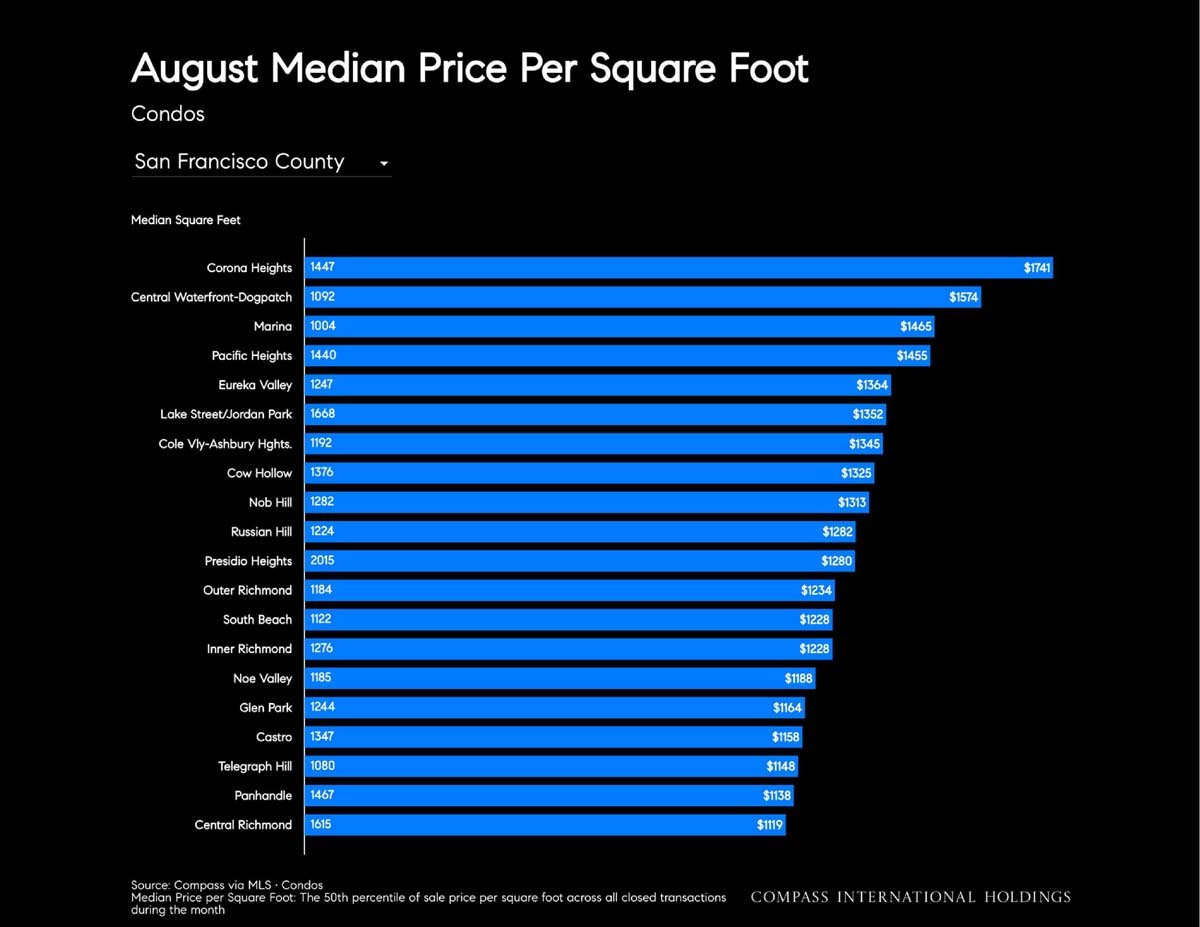
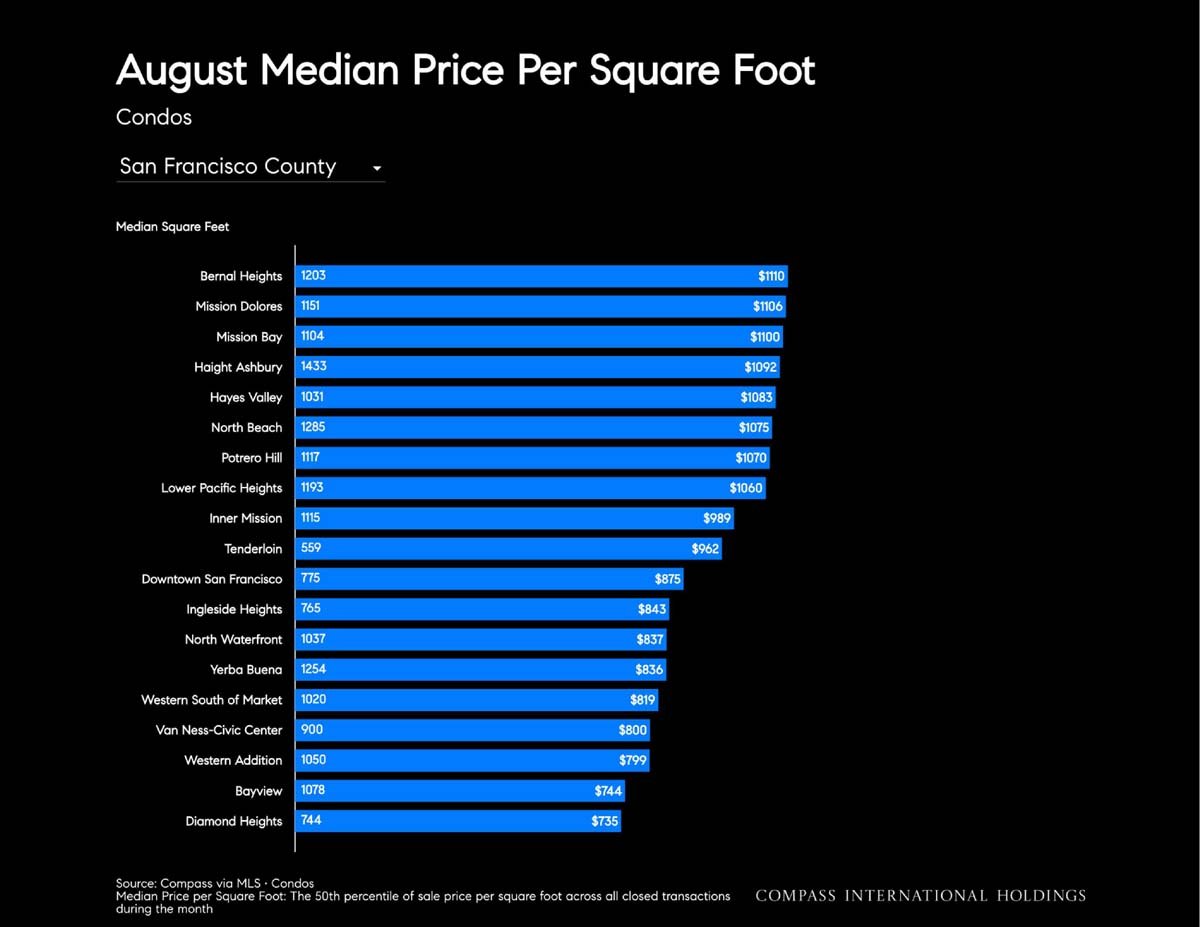
San Francisco condo price-per-square-foot chart by neighborhood, with Corona Heights highest at $1,741.
Chart comparing August condo median prices per square foot across 20 San Francisco neighborhoods.
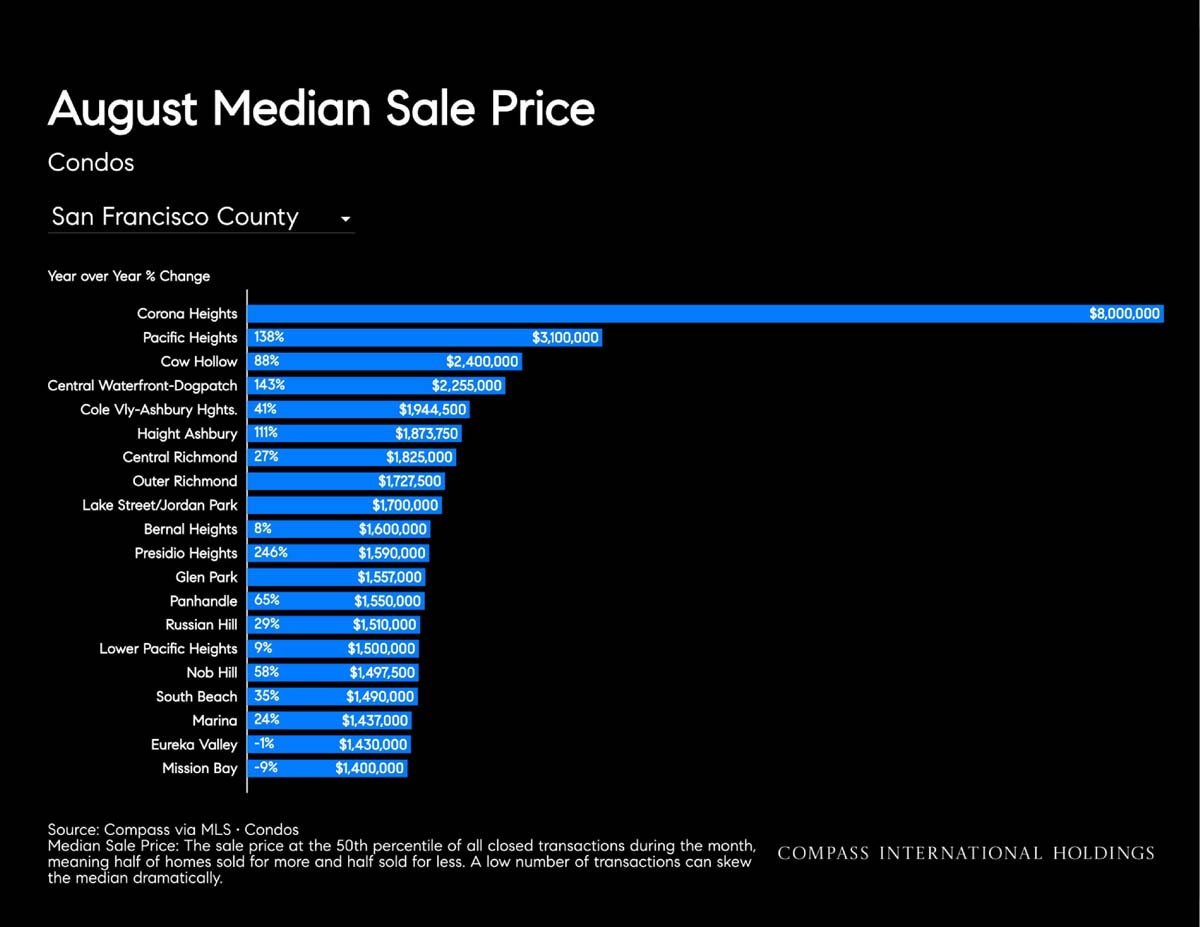
Chart of August San Francisco condo median sale prices by neighborhood, led by Corona Heights at $8 million.
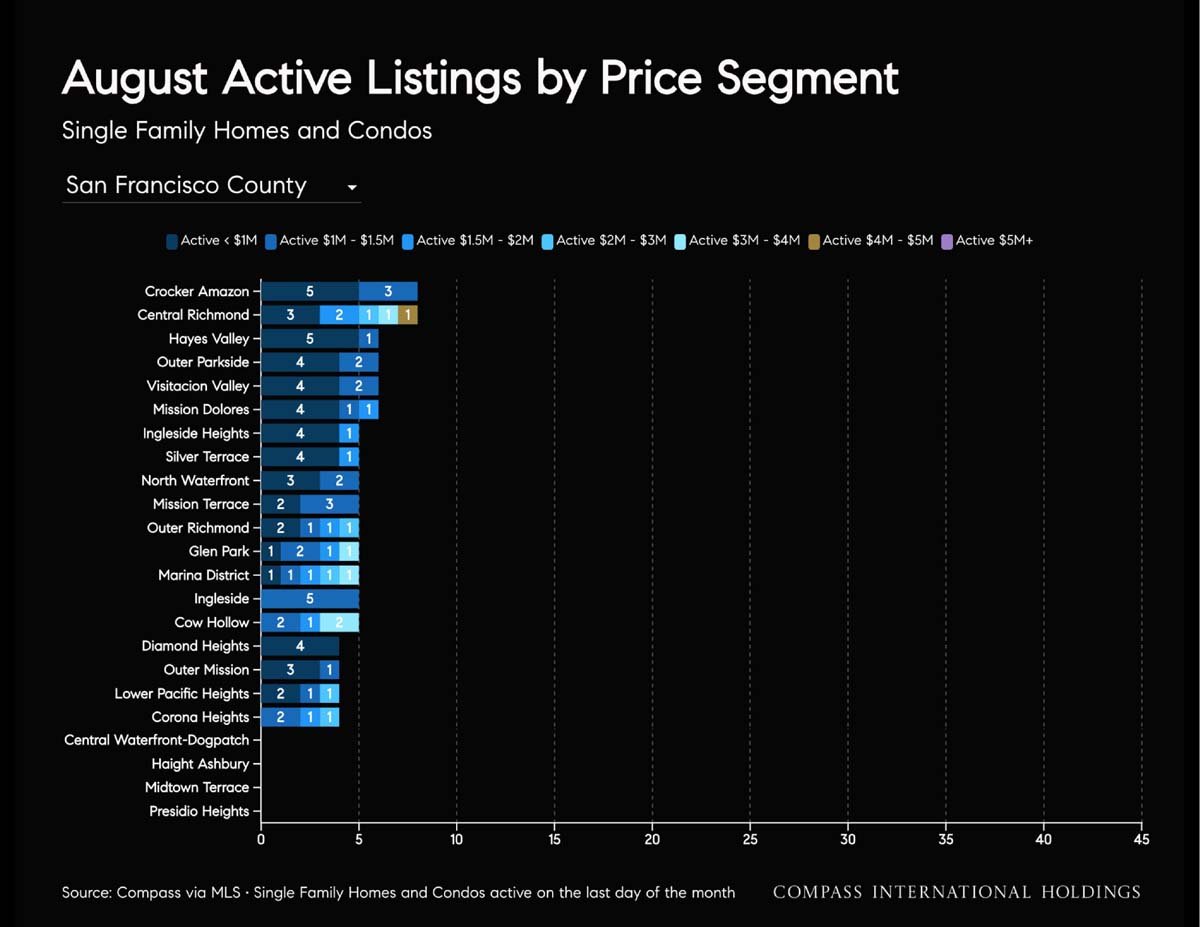
Chart of August active home listings by price segment across San Francisco County neighborhoods.
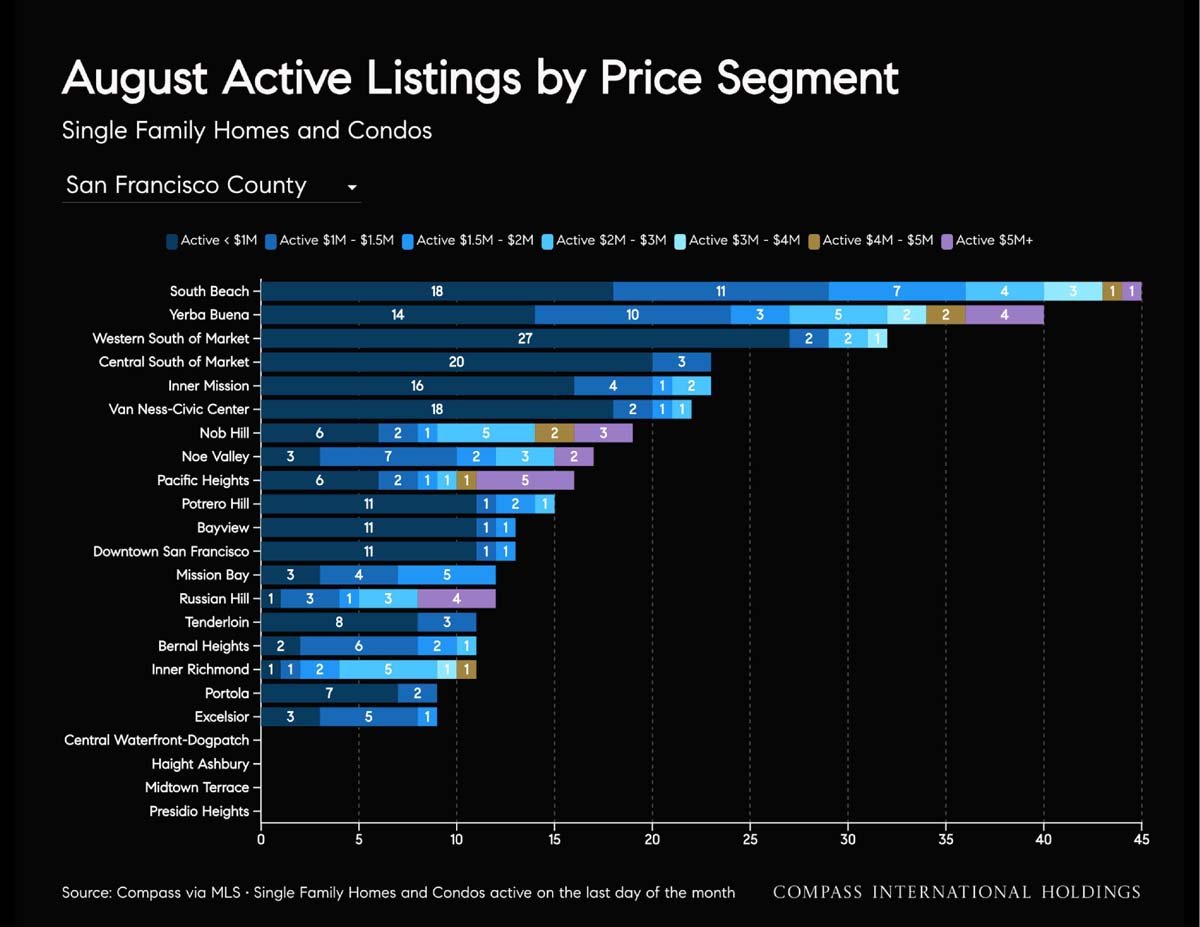
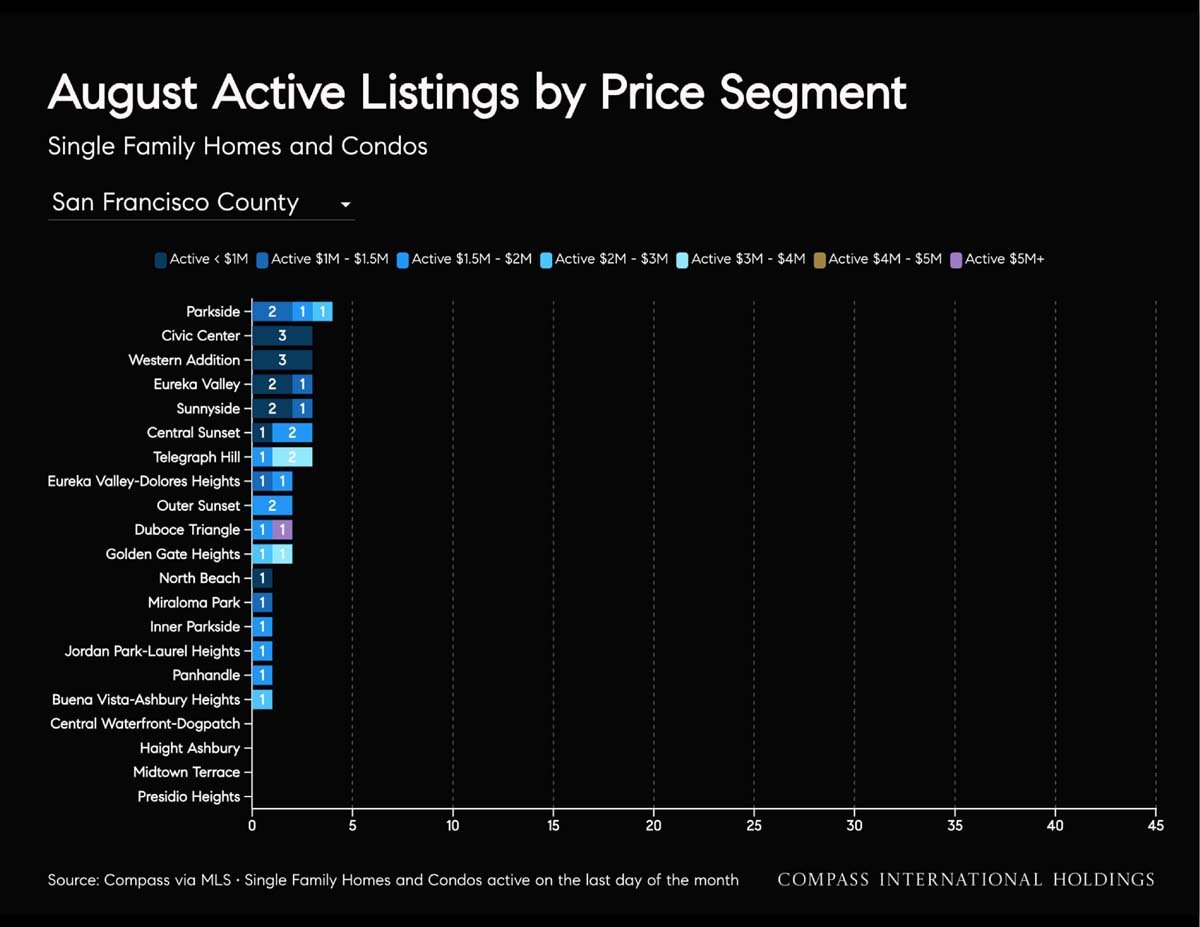
Bar chart of active San Francisco home and condo listings by neighborhood and price segment in August.
Chart of August active home listings by price segment across San Francisco County neighborhoods.
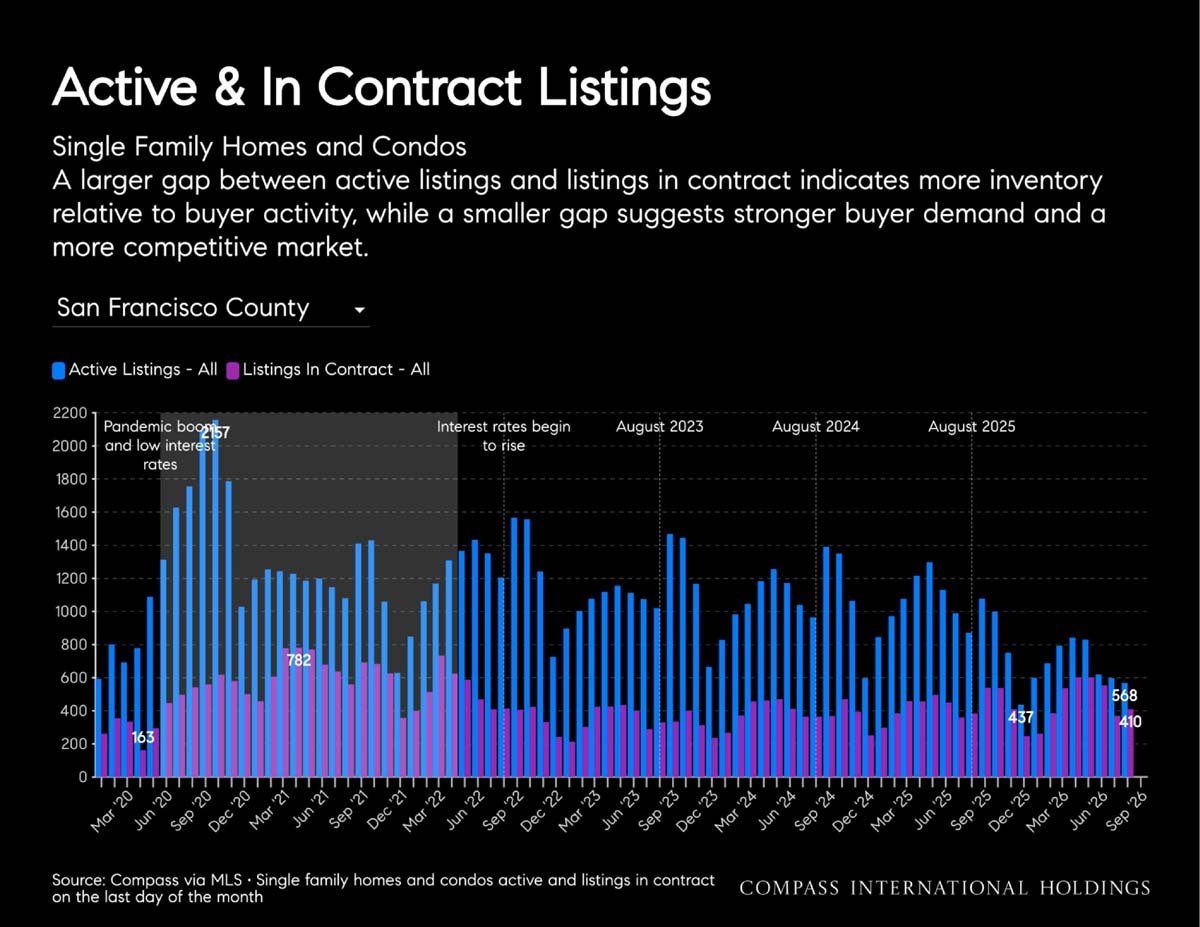
San Francisco County chart comparing active home listings with listings in contract from 2020 to 2026.
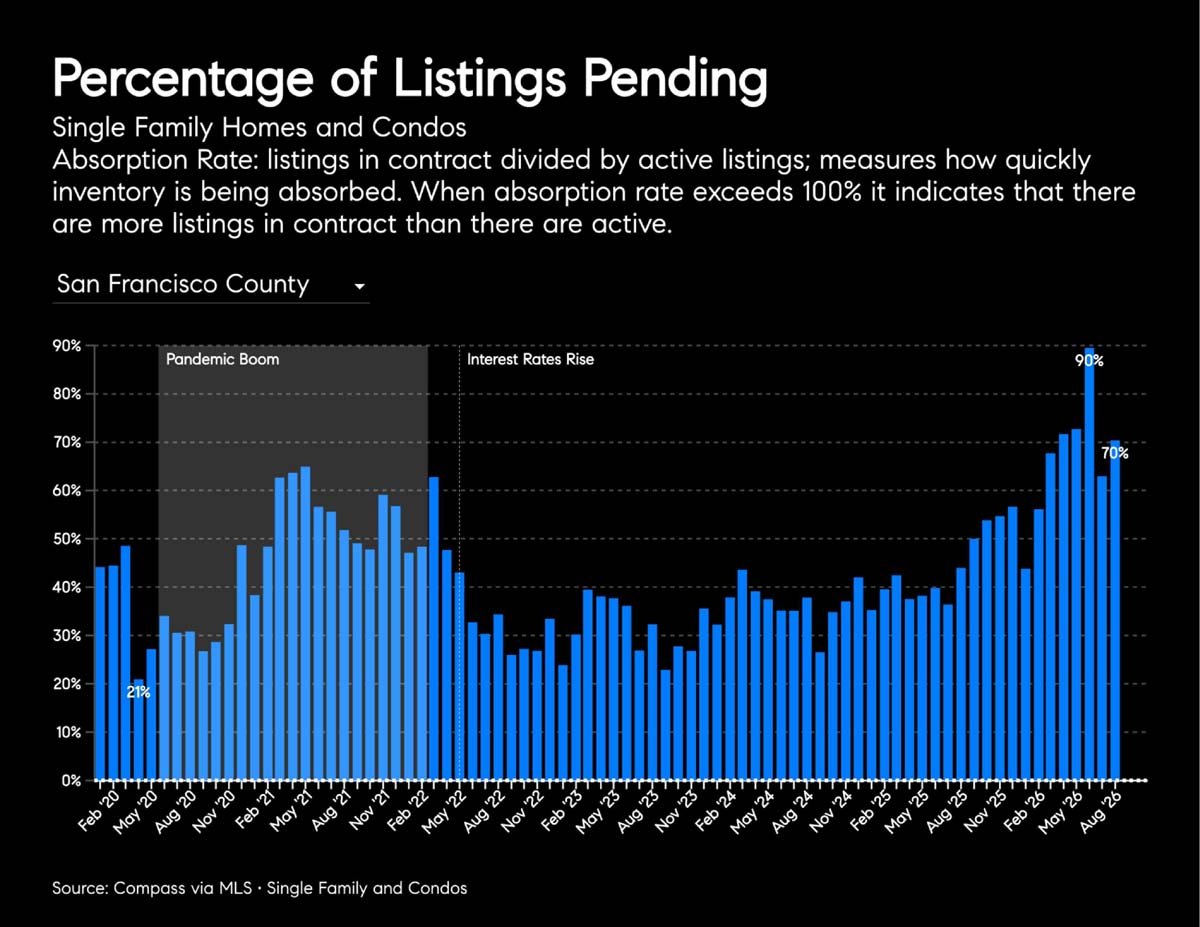
San Francisco County pending listings chart, with monthly rates rising to 90% in 2026.
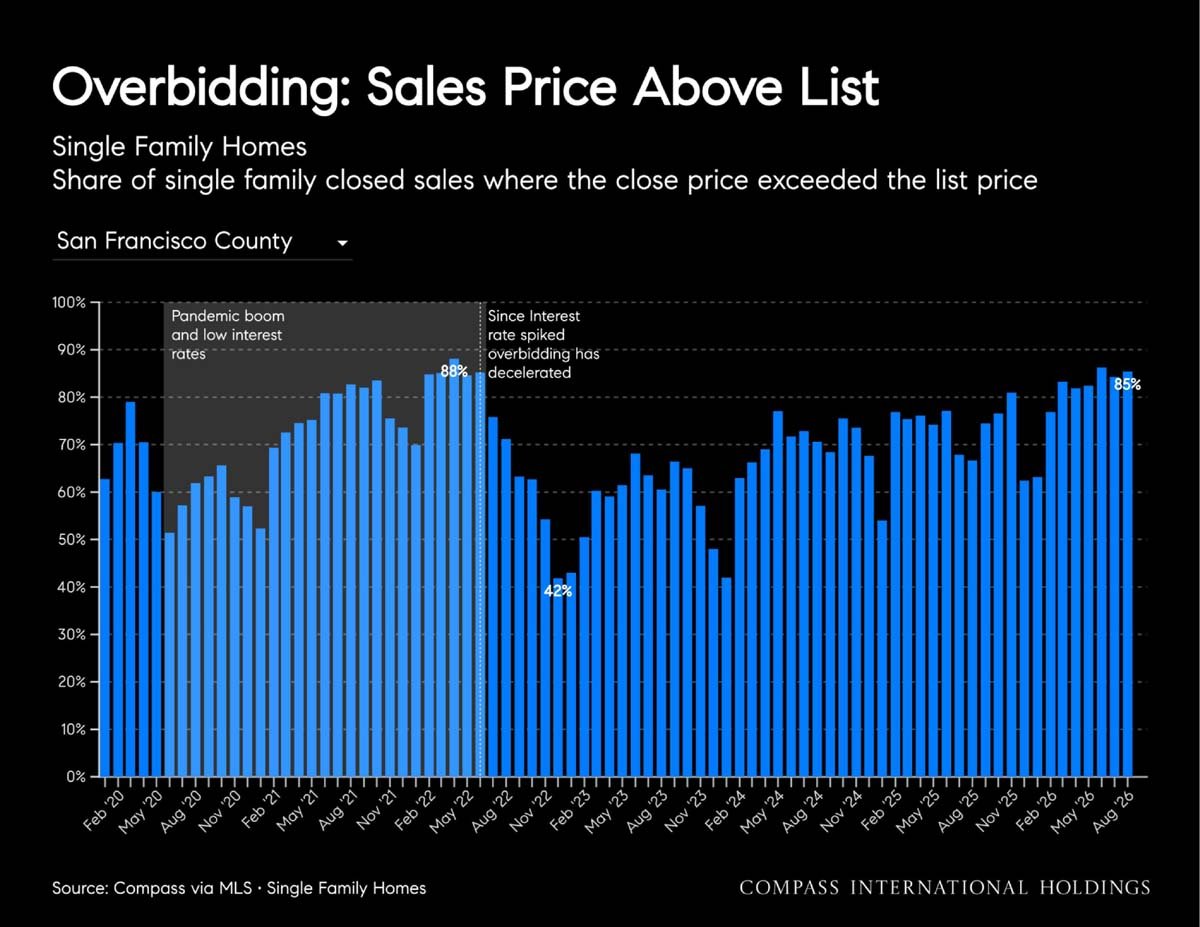
Chart of San Francisco single-family sales above list price, falling to 42% before rising to 85% in August 2026.
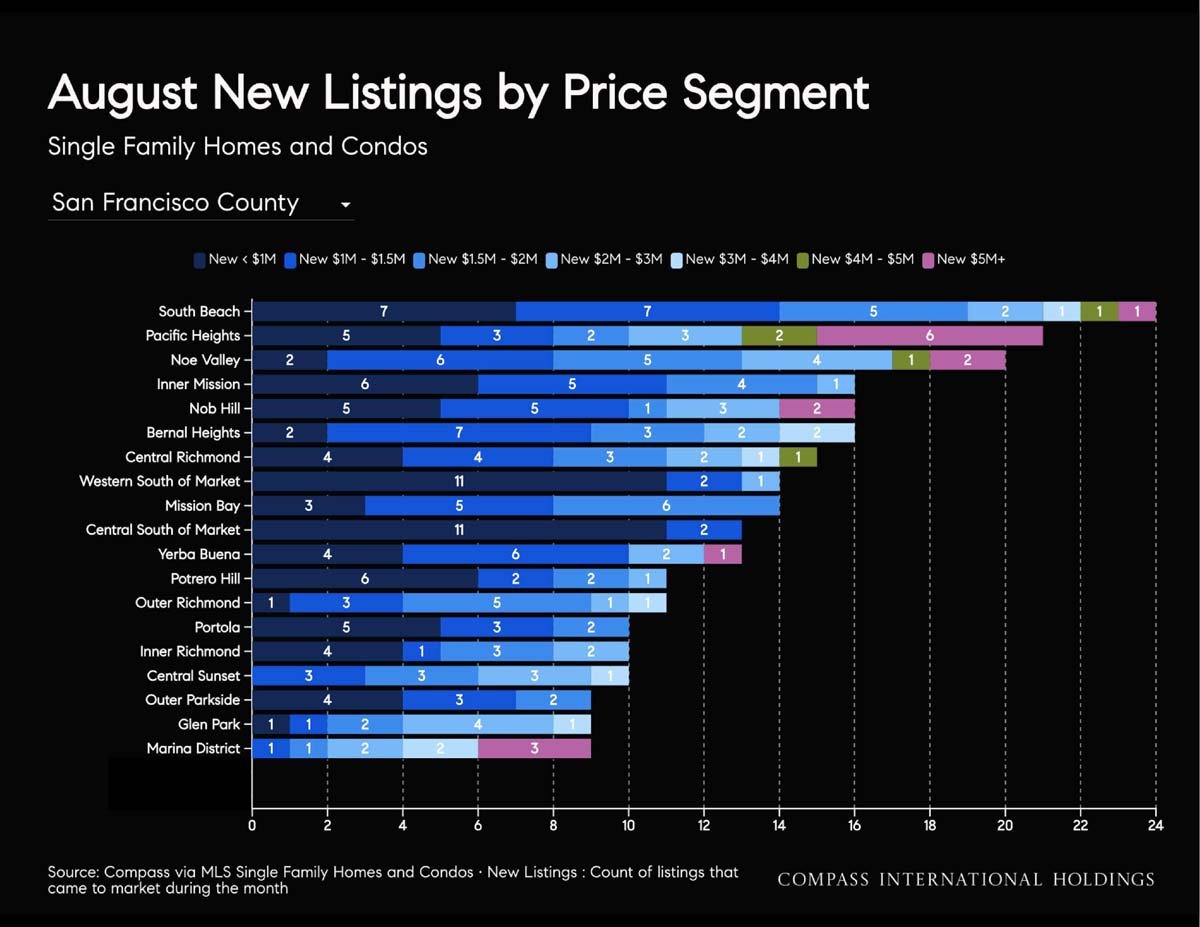
Stacked bar chart comparing August new home and condo listings by price segment across San Francisco neighborhoods.
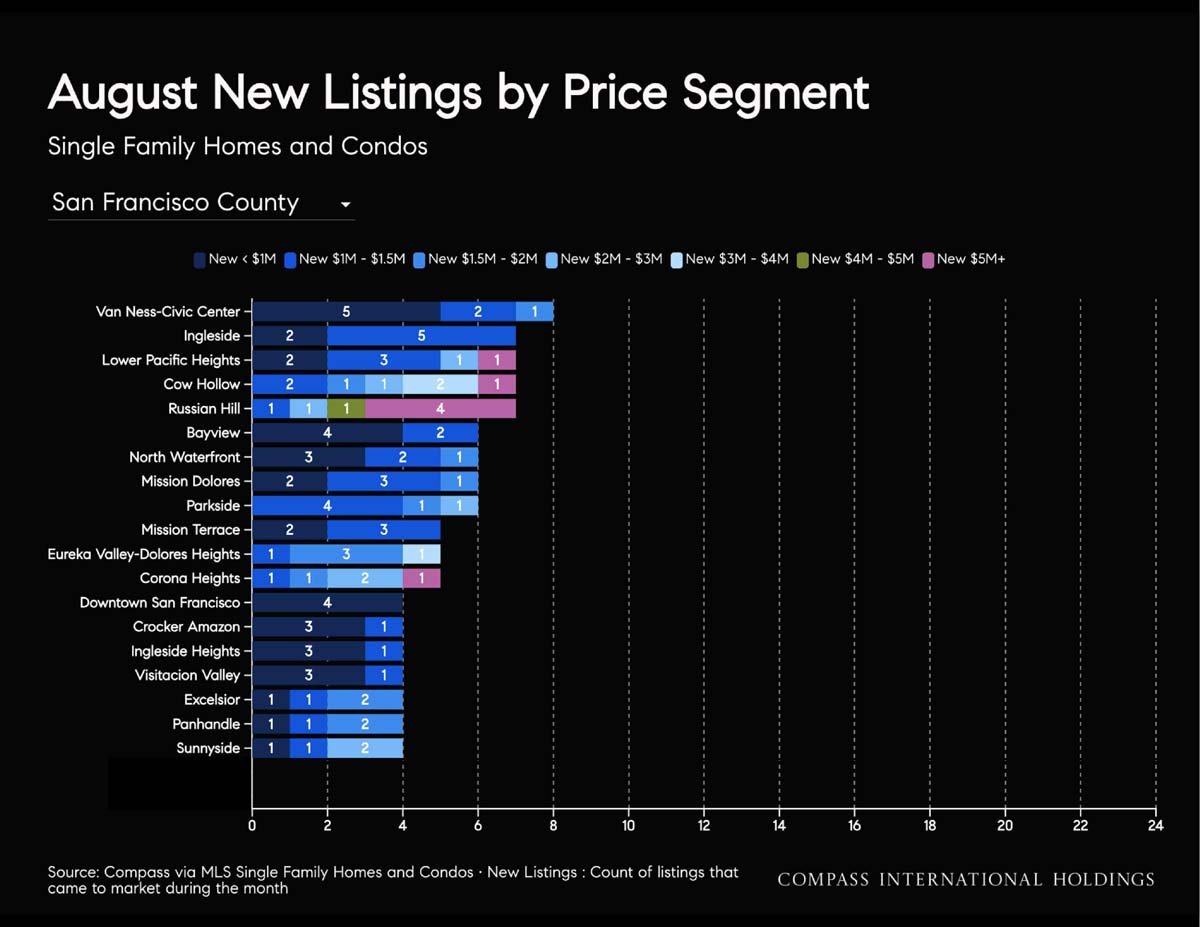
Chart of August new listings by price segment across San Francisco neighborhoods.
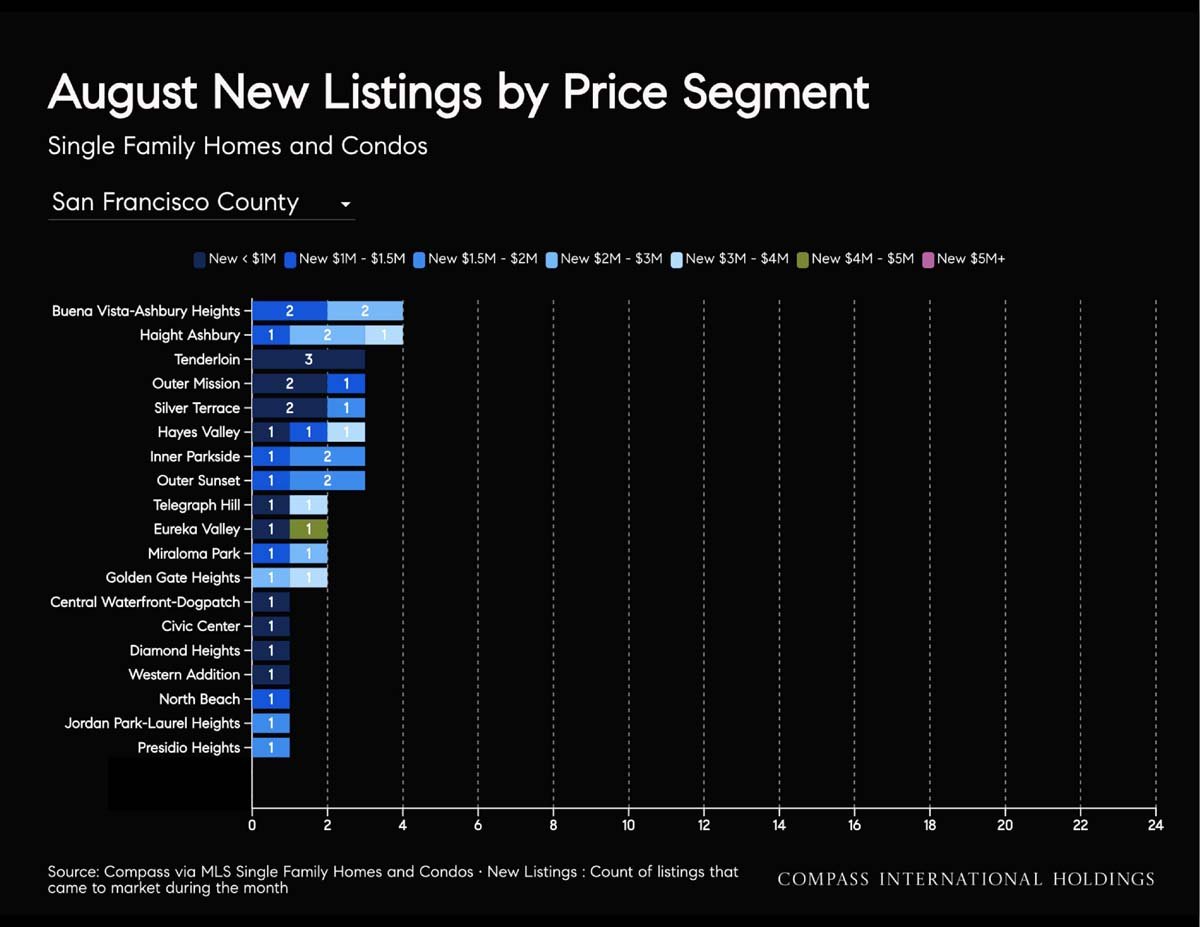
Chart of August San Francisco new listings by neighborhood, stacked by price segment.
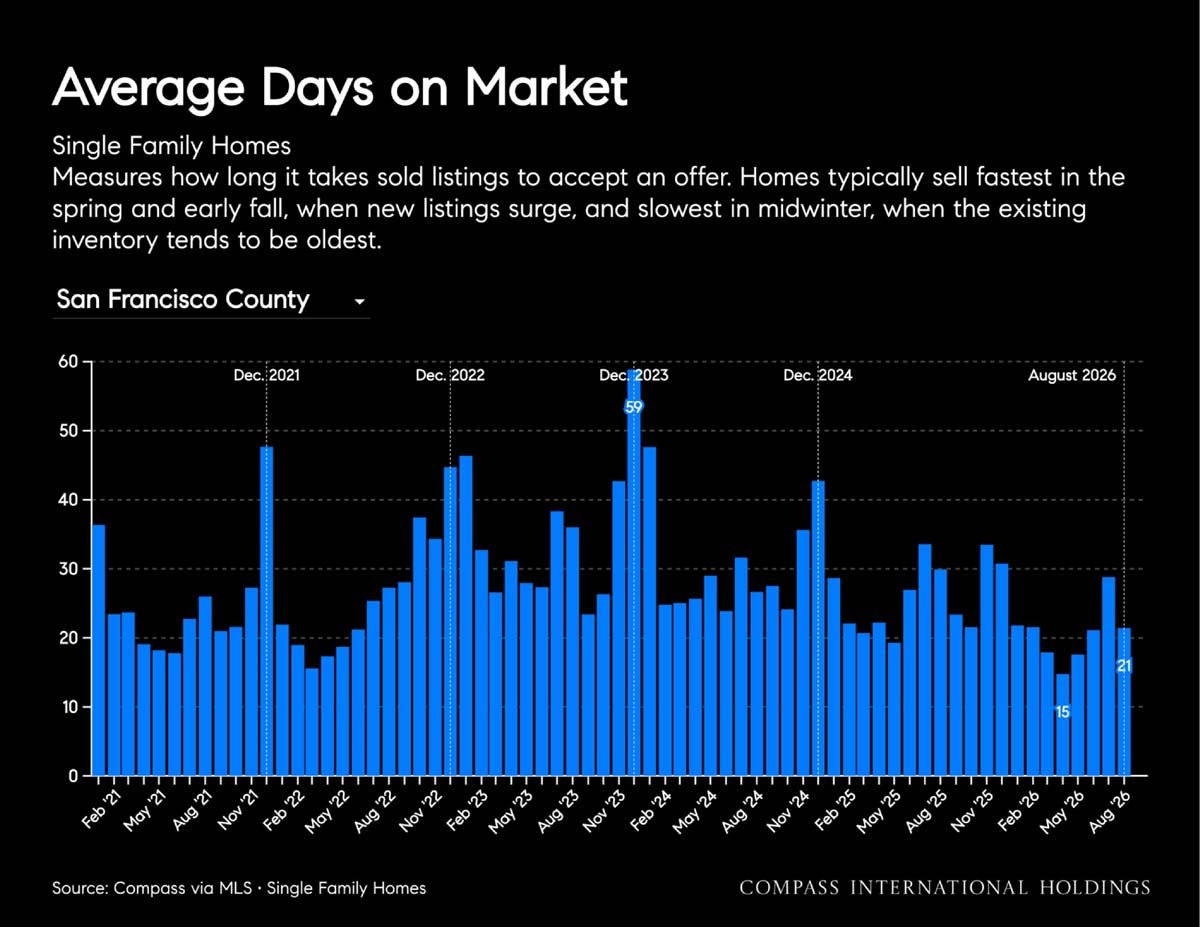
San Francisco County single-family home days-on-market chart, with monthly bars from 2021 through August 2026.
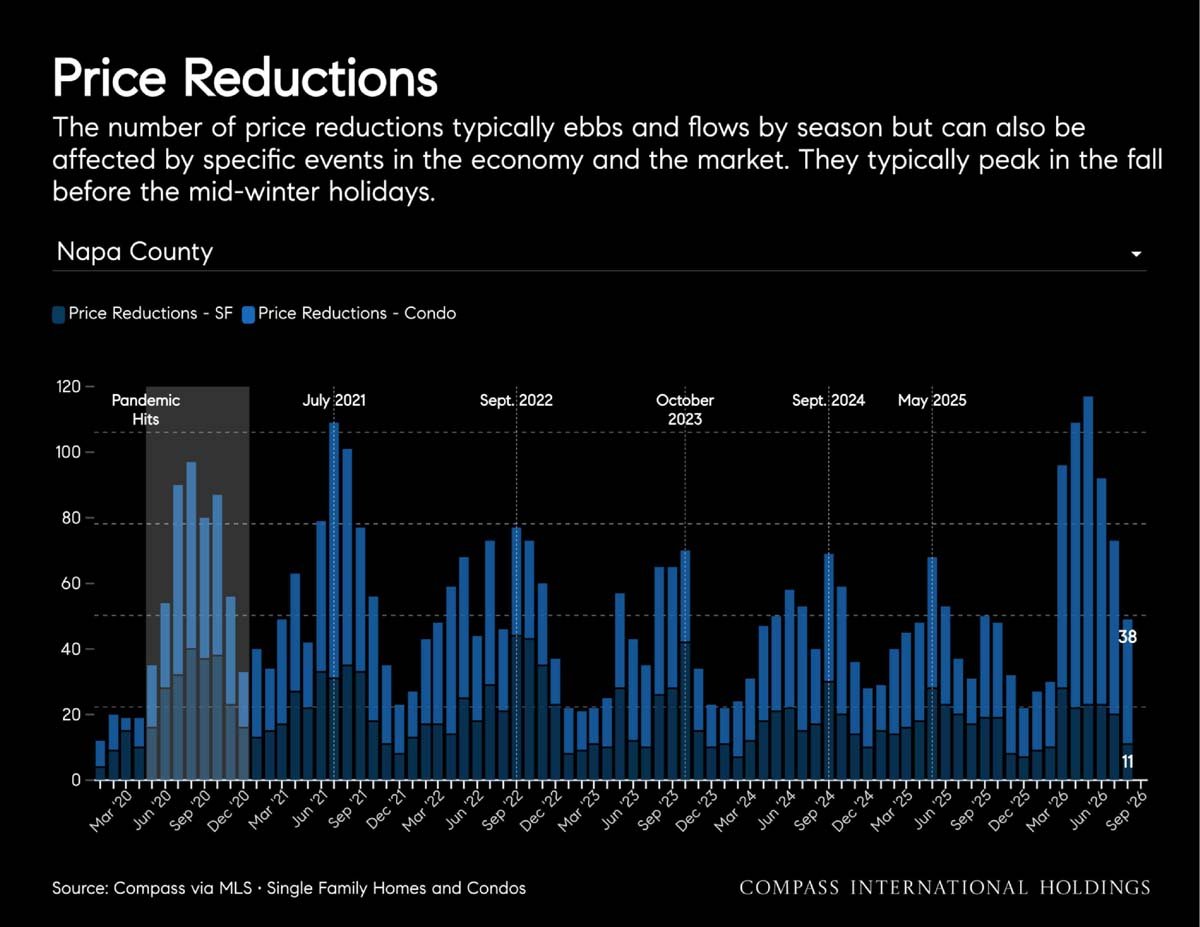
Bar chart of monthly San Francisco home and condo price reductions, with a sharp spike in mid-2026.
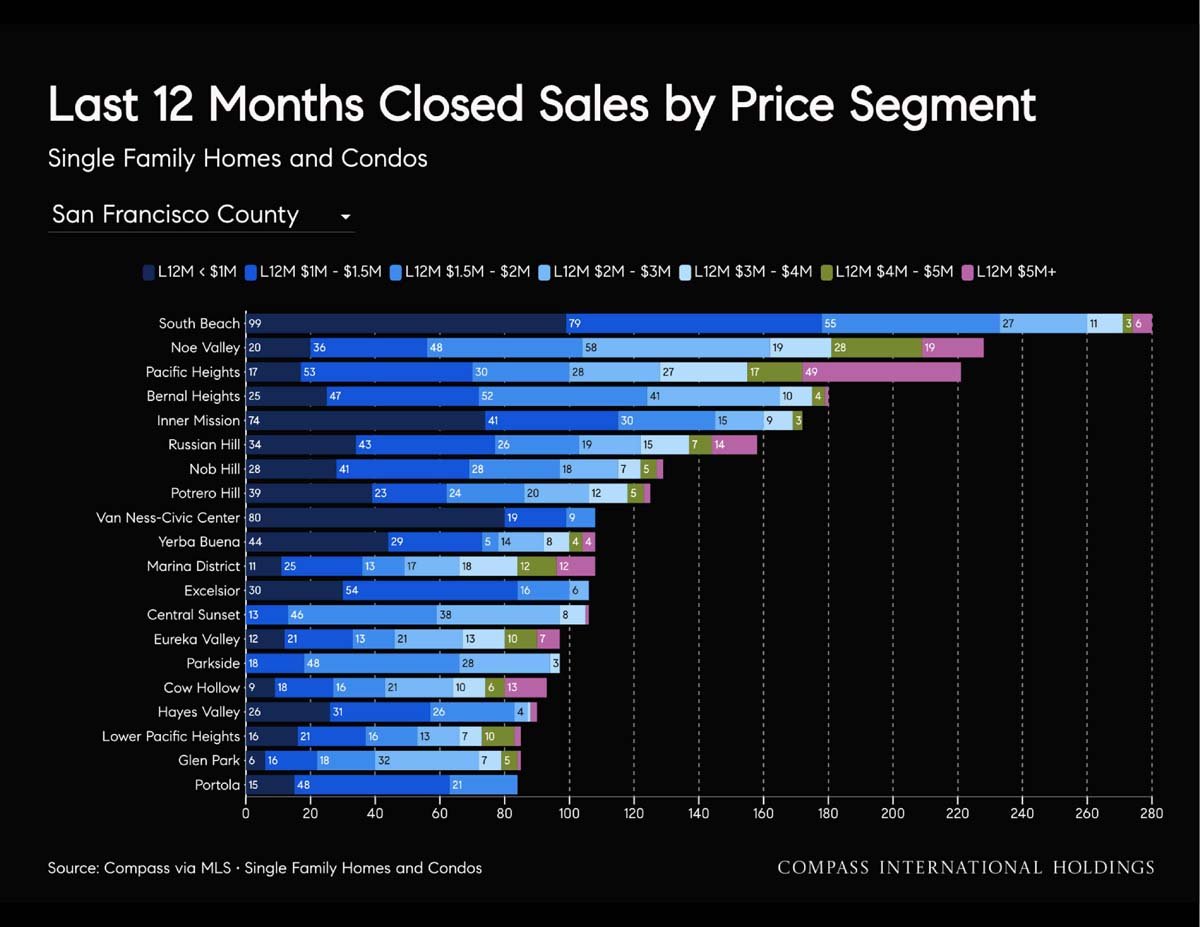
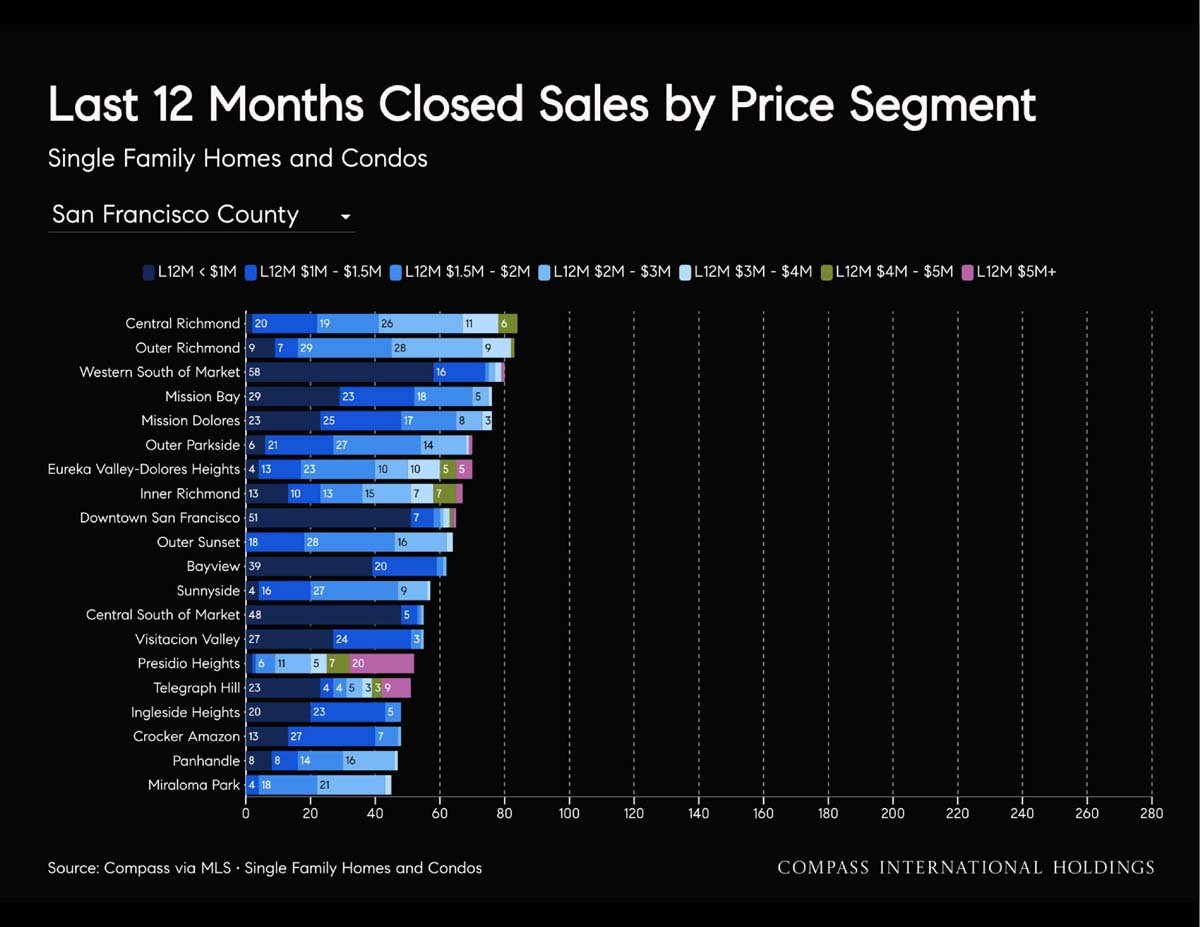
Stacked bar chart of 12-month San Francisco home and condo sales by neighborhood and price range.
Stacked bar chart of San Francisco home and condo sales by neighborhood and price segment over the last 12 months.
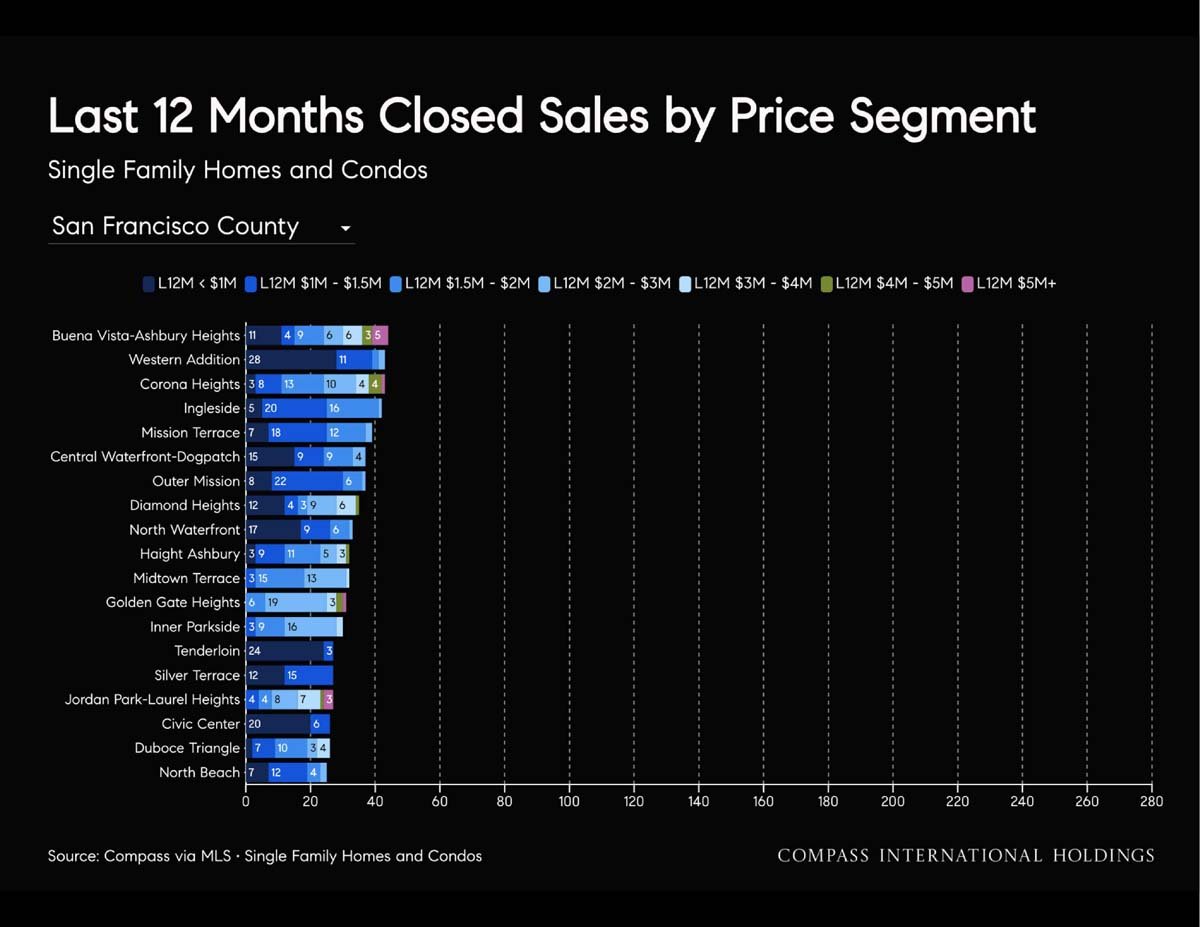
Stacked bar chart of San Francisco neighborhood home sales over the last 12 months, grouped by price segment.
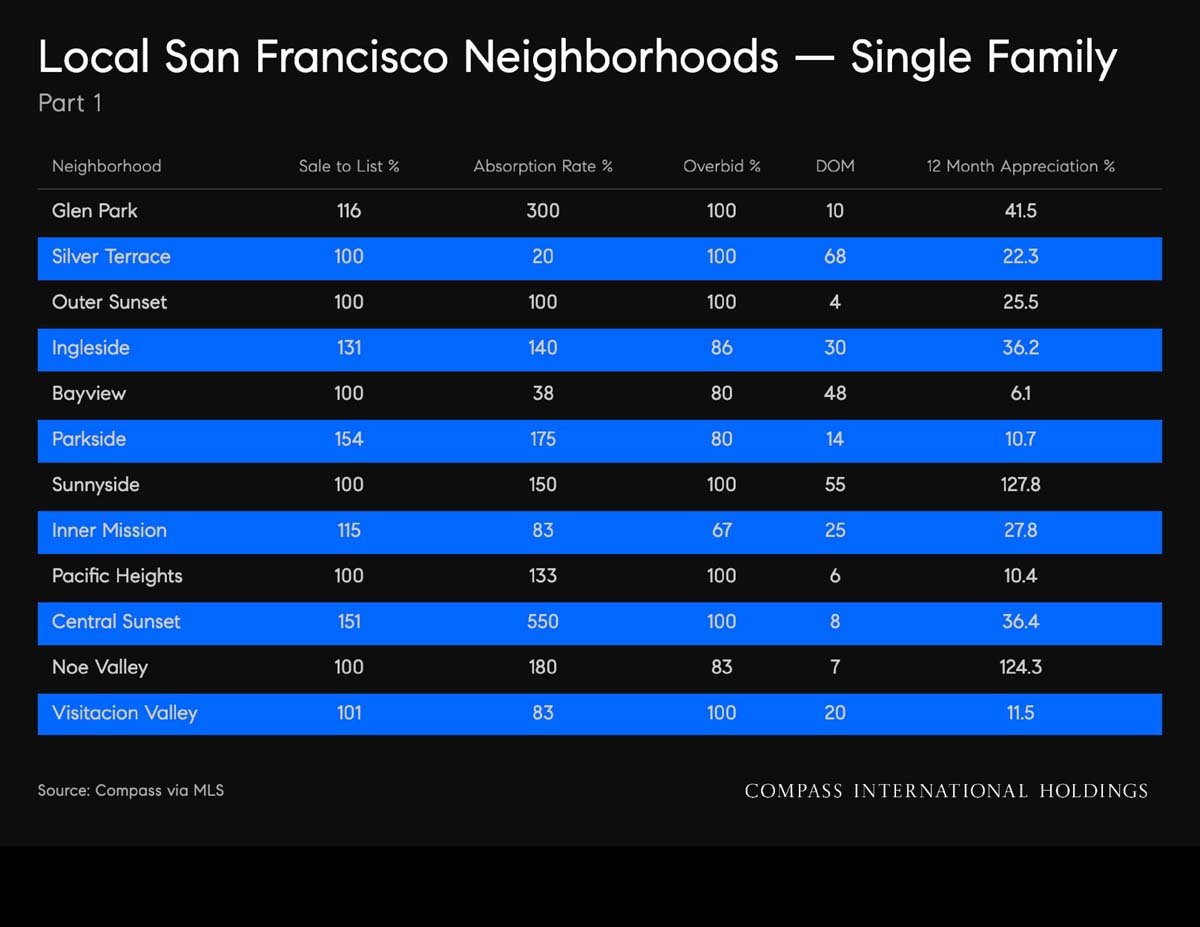
San Francisco single-family neighborhood chart comparing sales and appreciation metrics.
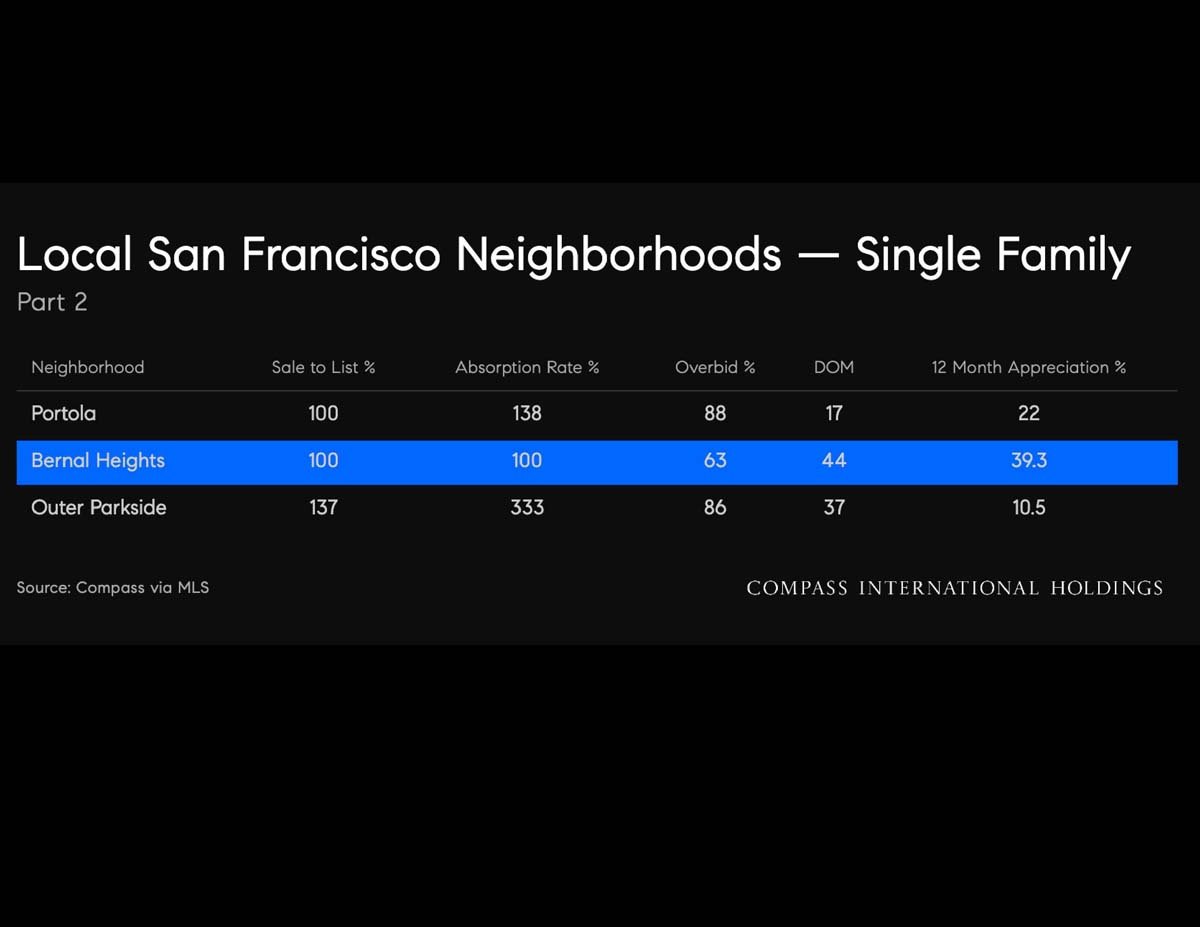
San Francisco single-family market table comparing three neighborhoods, with Bernal Heights highlighted in blue.
Chart comparing condo market statistics across 12 San Francisco neighborhoods, with alternating rows highlighted in blue.
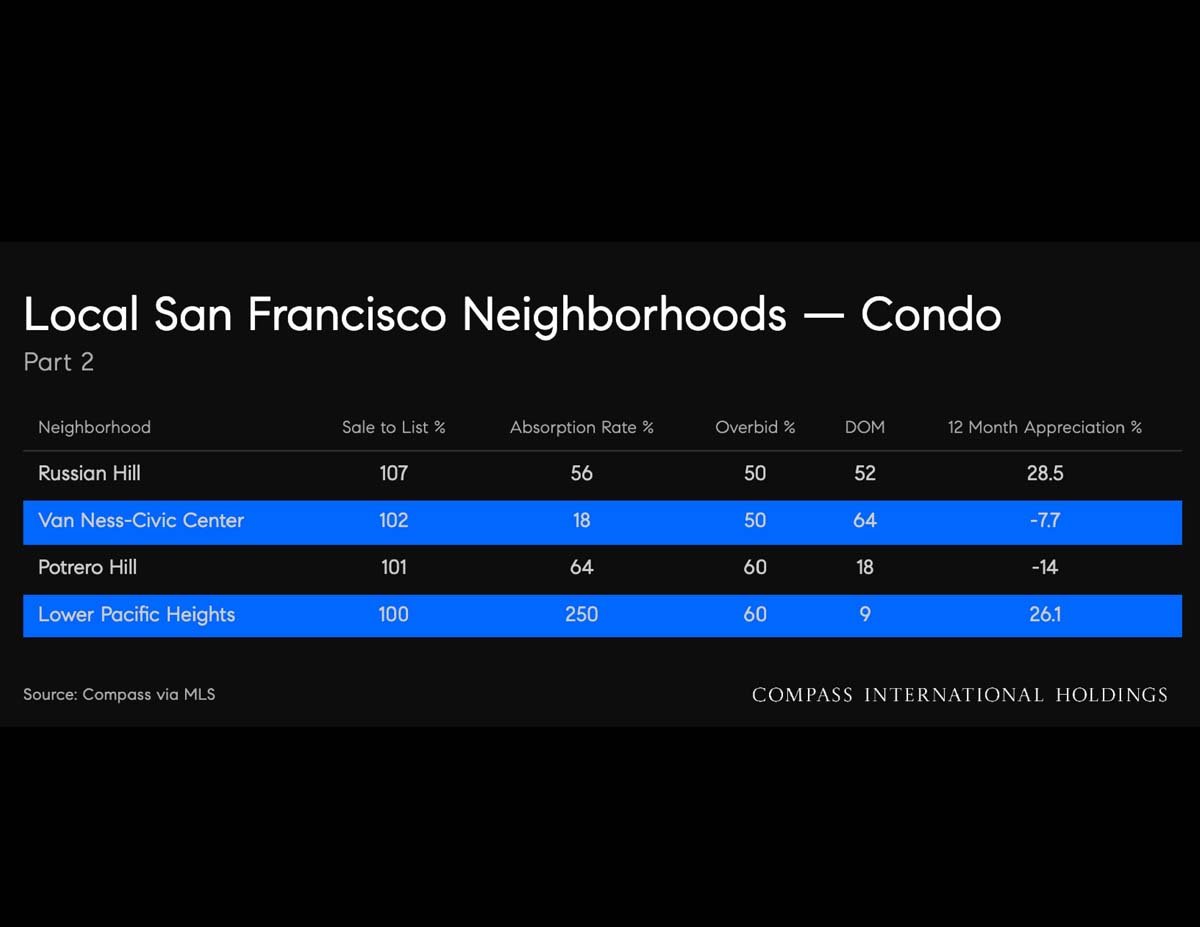
Chart comparing condo market statistics for four San Francisco neighborhoods, with Van Ness-Civic Center and Lower Pacific Heights highlighted.
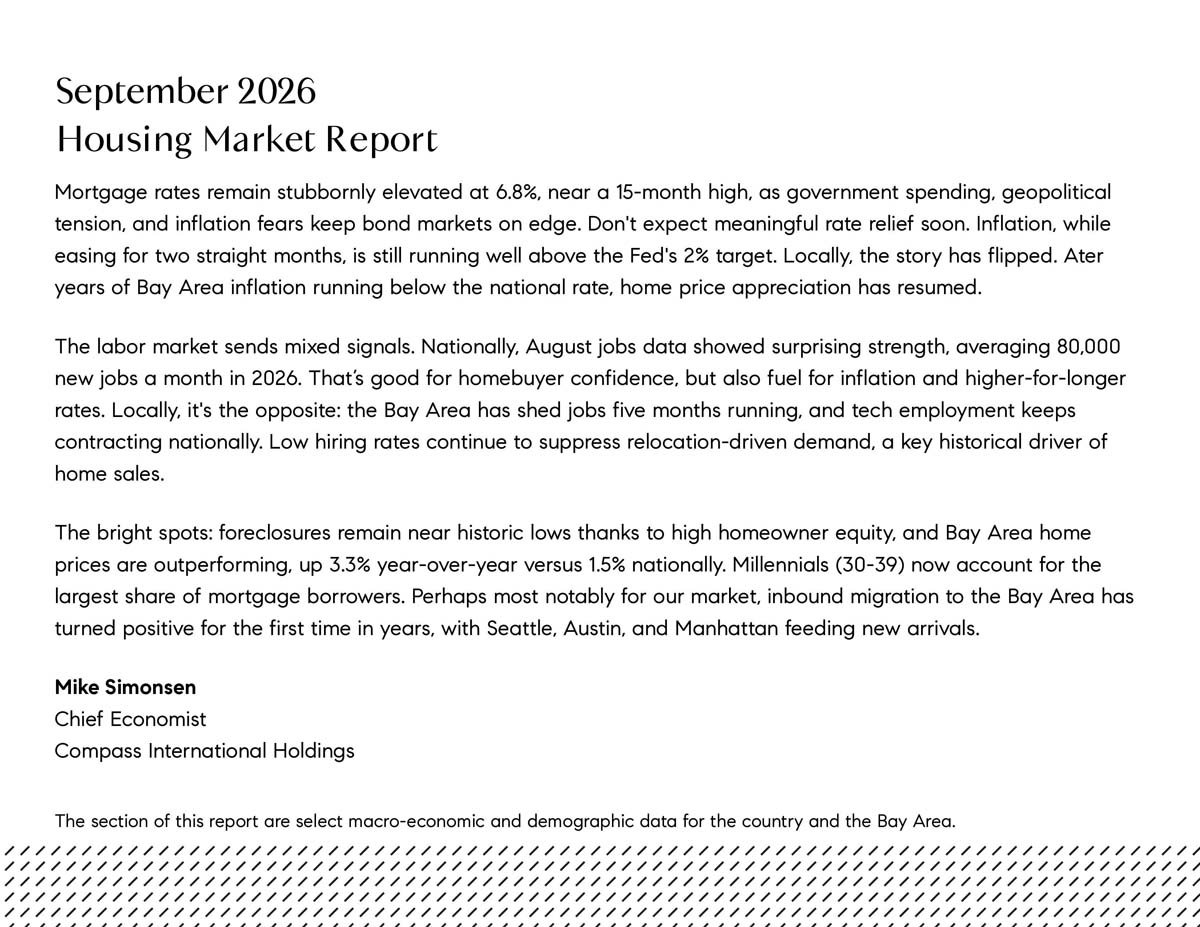
September 2026 housing market report on mortgage rates, employment, home prices, and Bay Area migration.
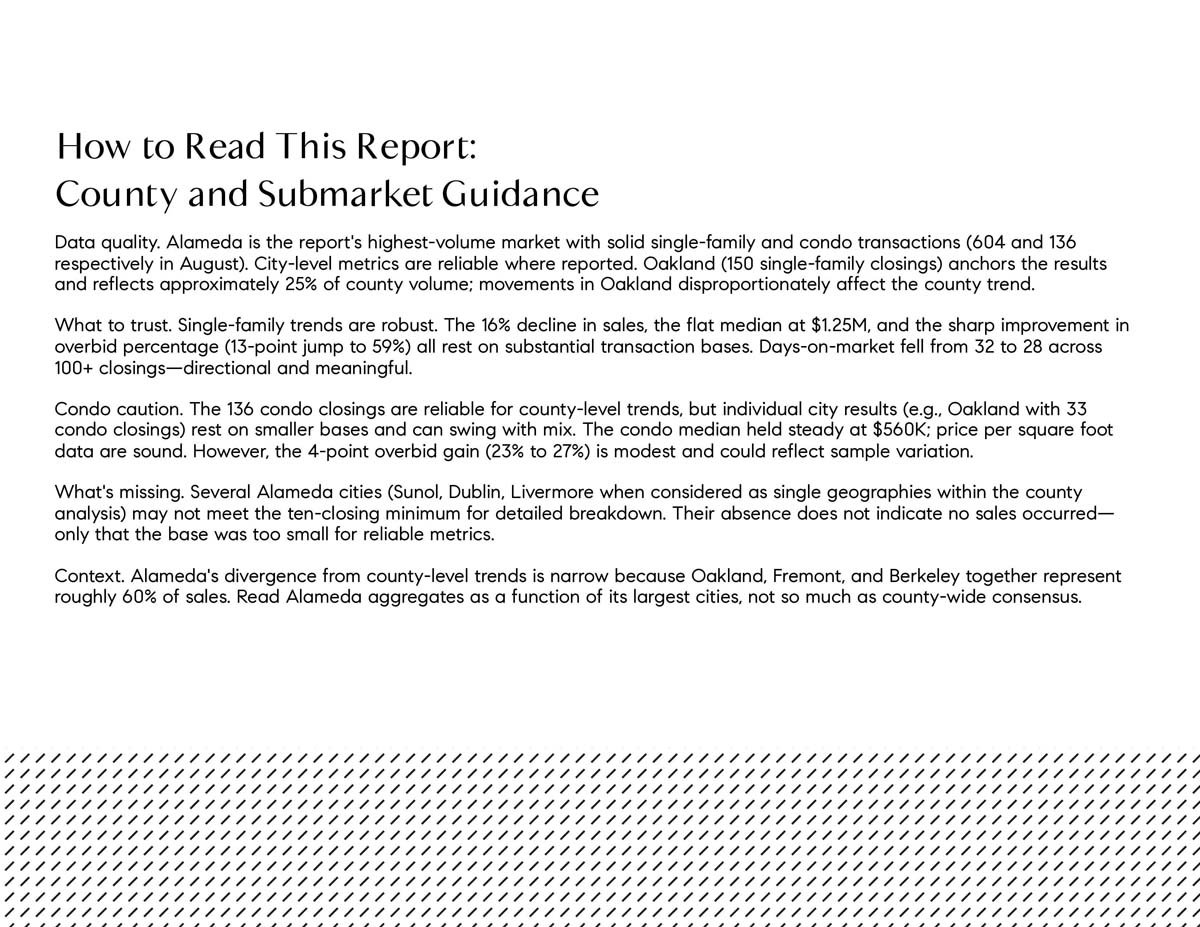
Guidance on interpreting Alameda County single-family and condo market data, including data reliability, caveats, and context.
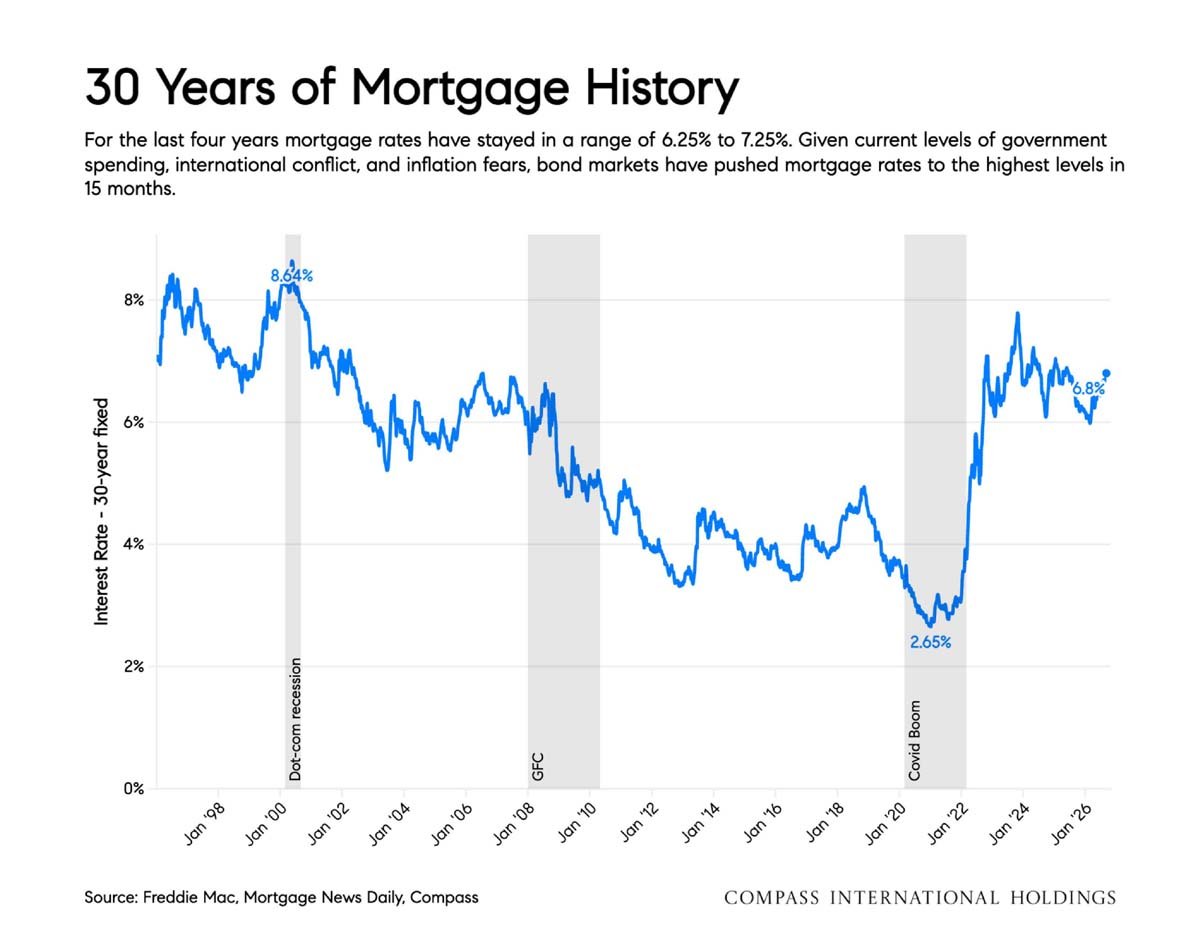
Chart of 30-year fixed mortgage rates from 1998 to 2026, ending at 6.8% after a 2.65% low.
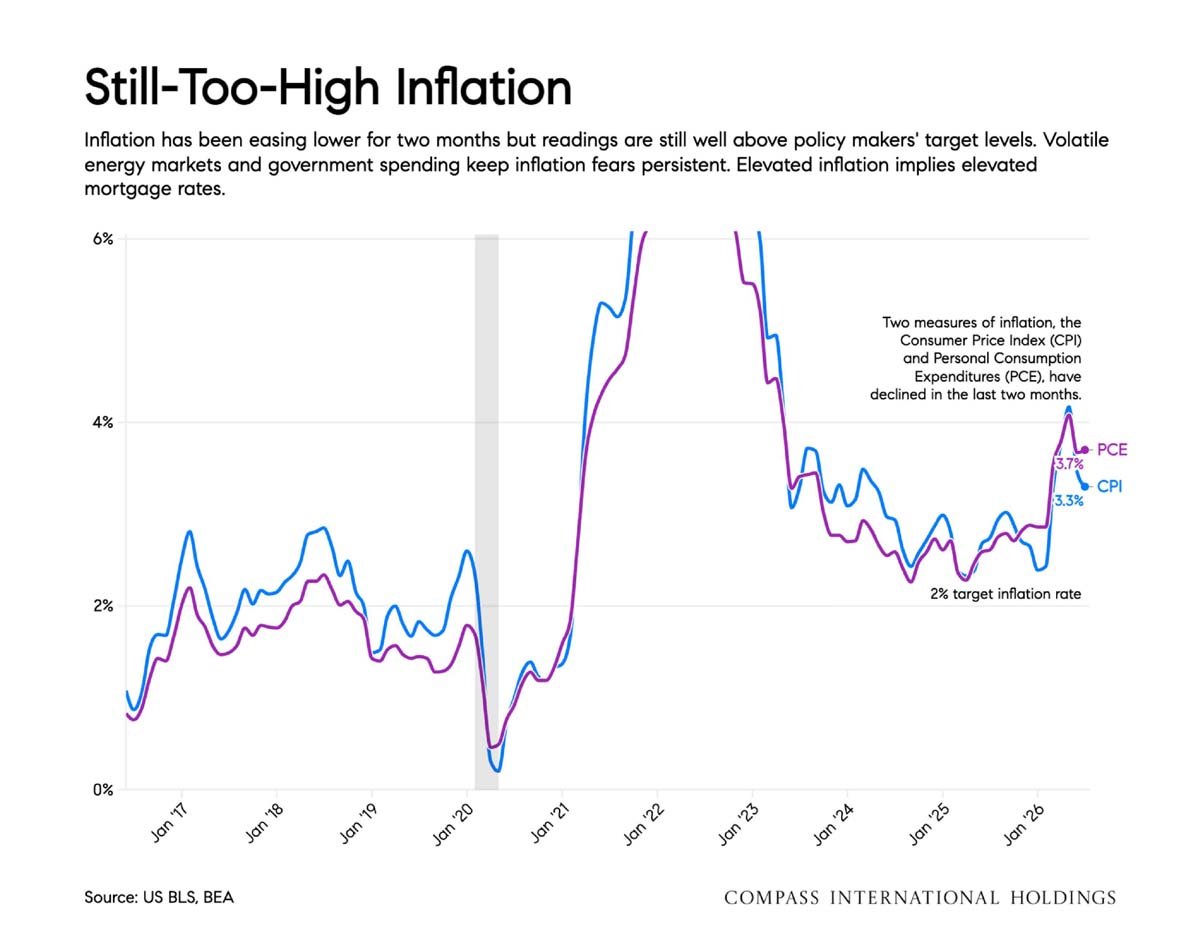
Chart comparing CPI and PCE inflation from 2016 to 2026, with both latest rates above the 2% target.
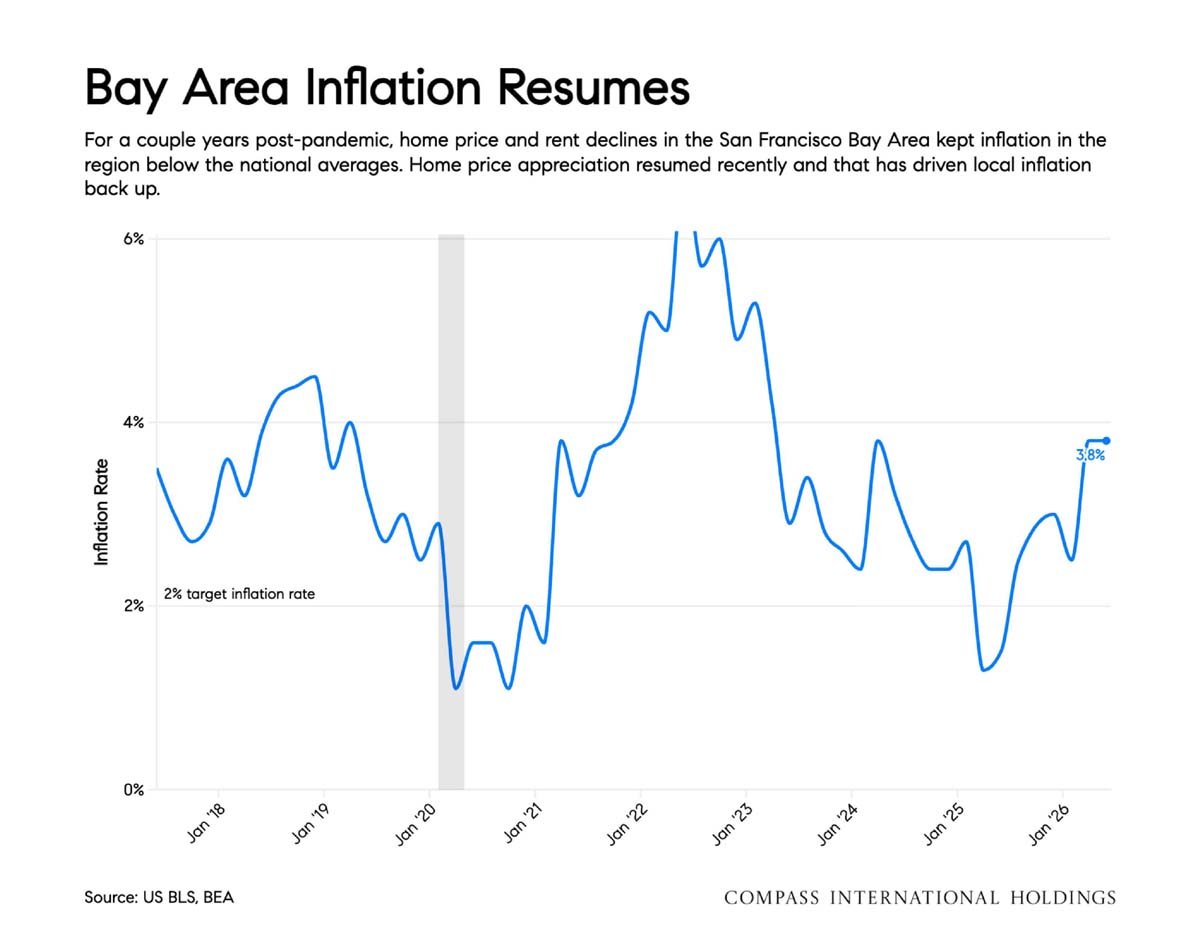
Bay Area inflation chart, with a 2022 peak near 6% and a 2026 reading of 3.8%.
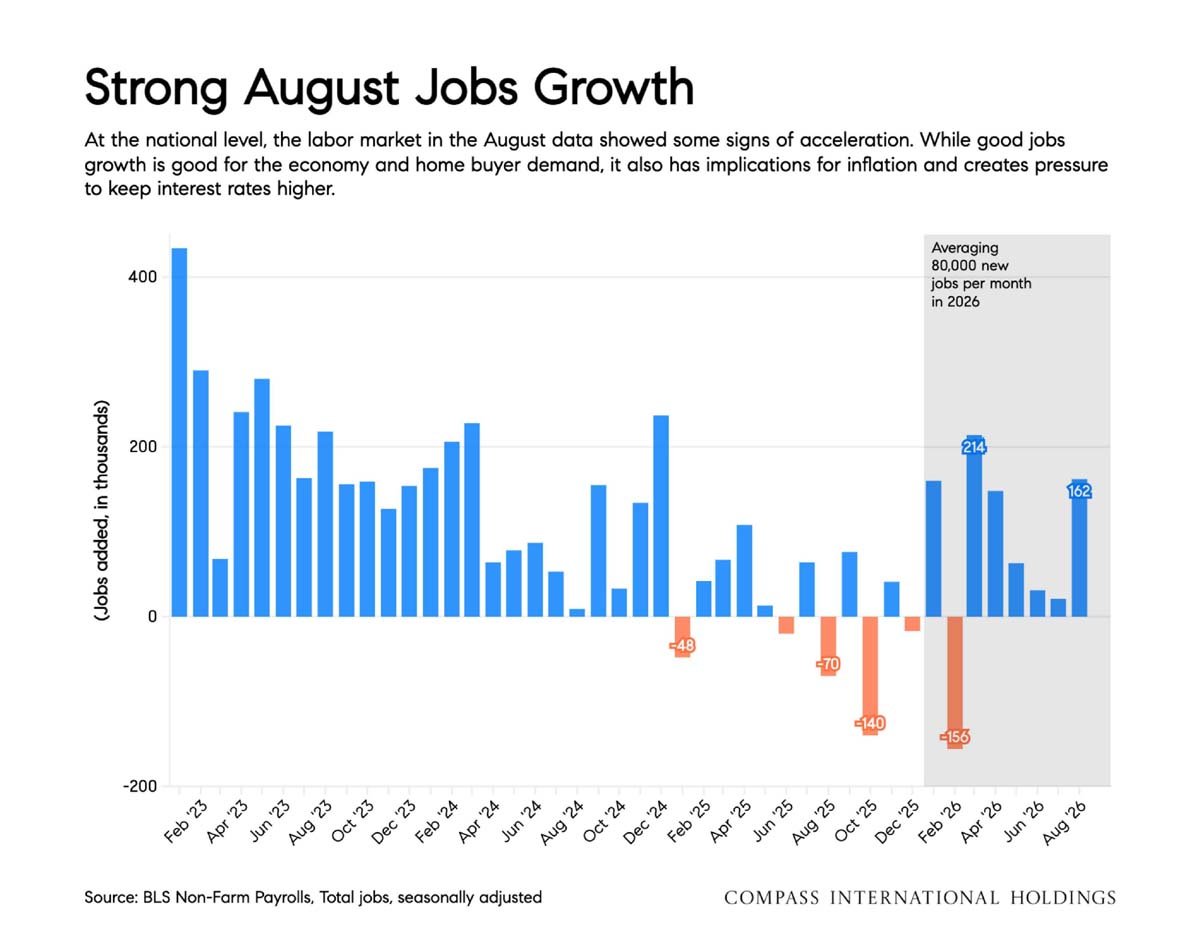
Bar chart of monthly U.S. job growth through August 2026, with an 80,000-job monthly average noted for 2026.
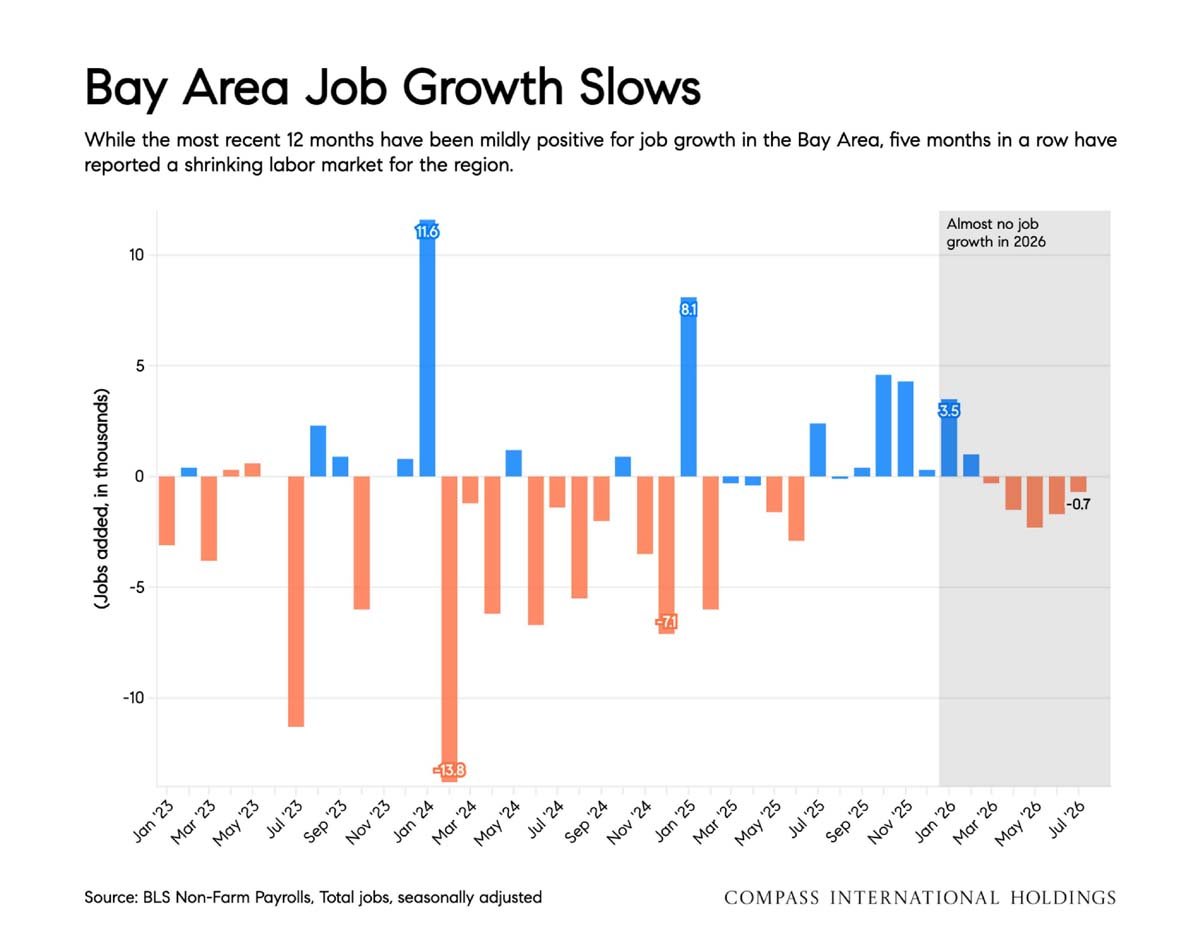
Chart of Bay Area monthly job growth, showing mostly losses in 2026 and a latest reading of -0.7 thousand.
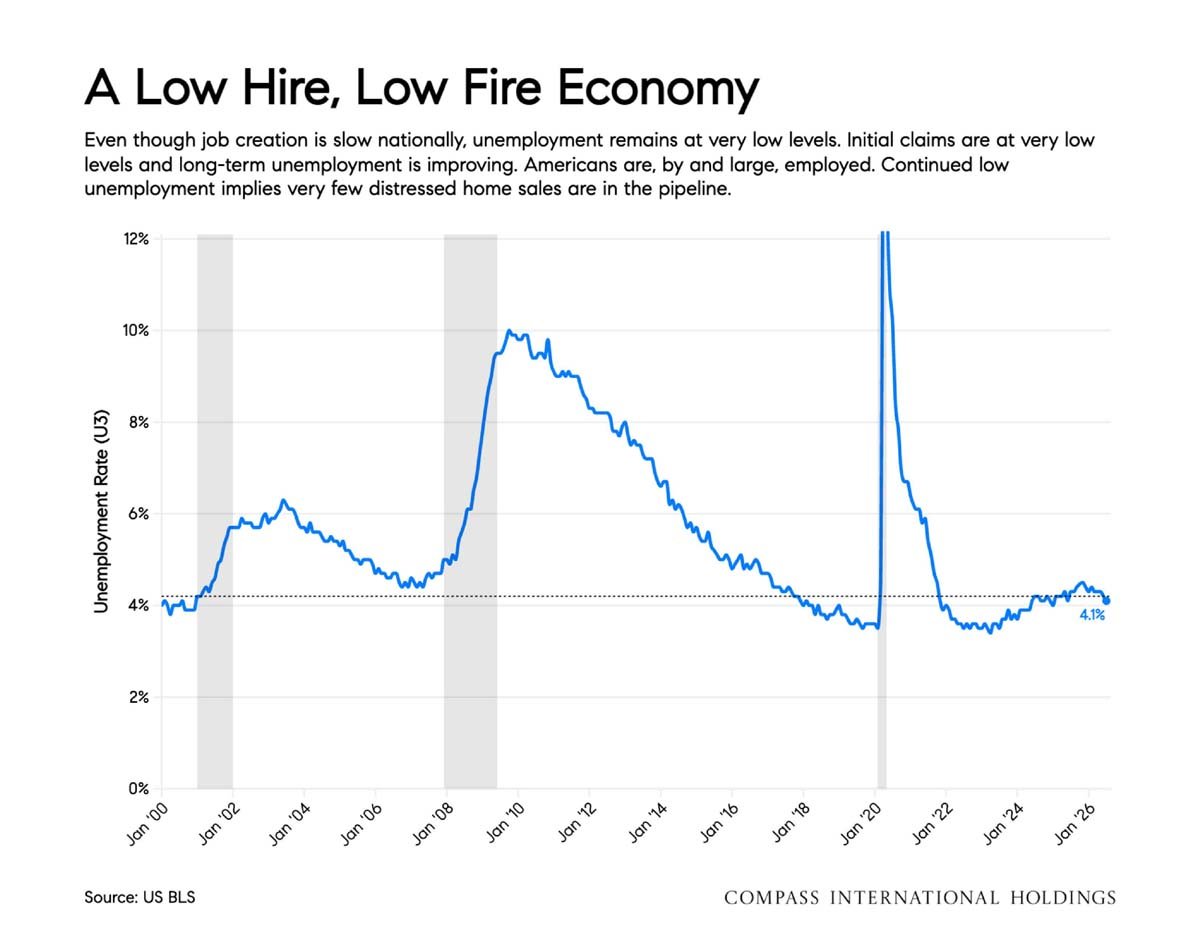
Line chart of U.S. unemployment from 2000 to 2026, ending at 4.1%.
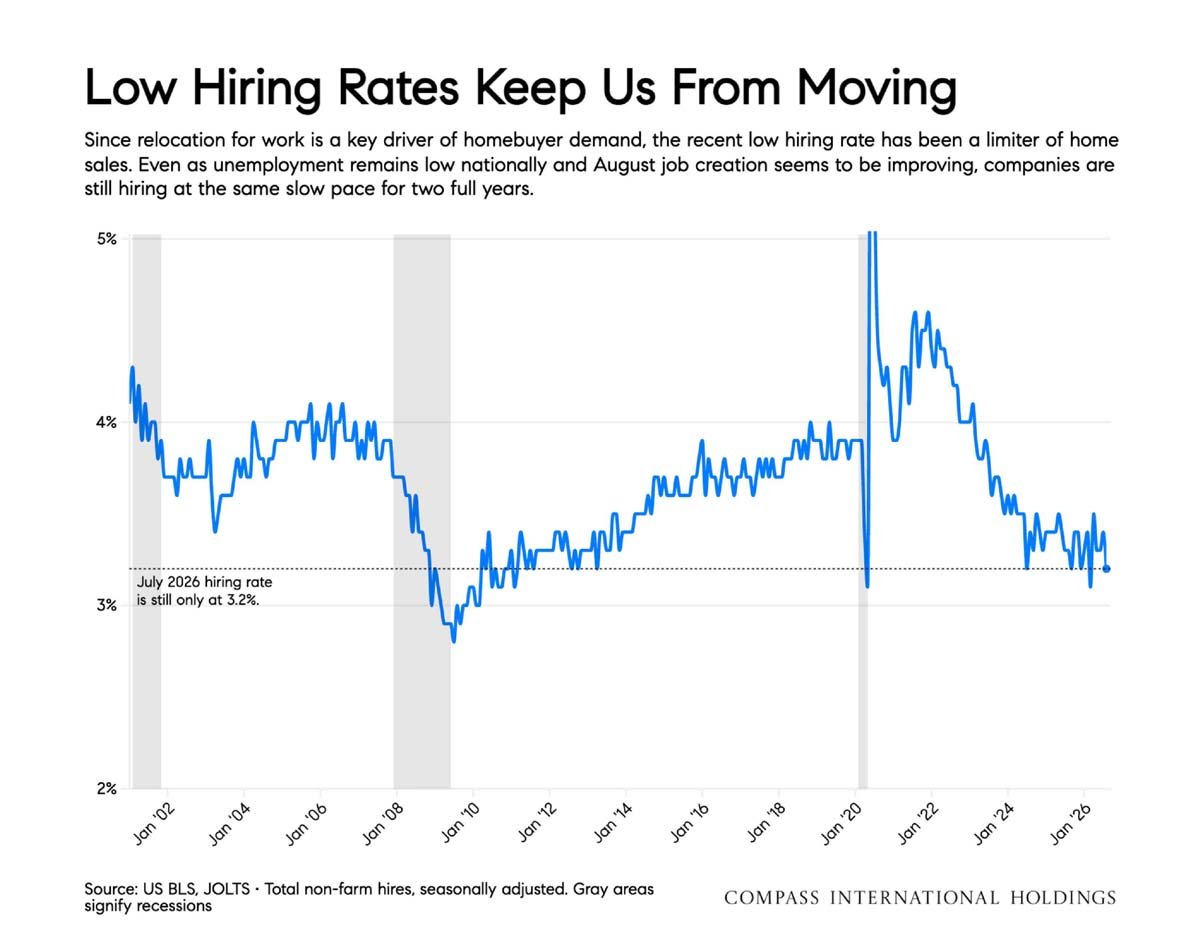
Line chart of U.S. hiring rates from 2002 to 2026, highlighting a 3.2% rate in July 2026.
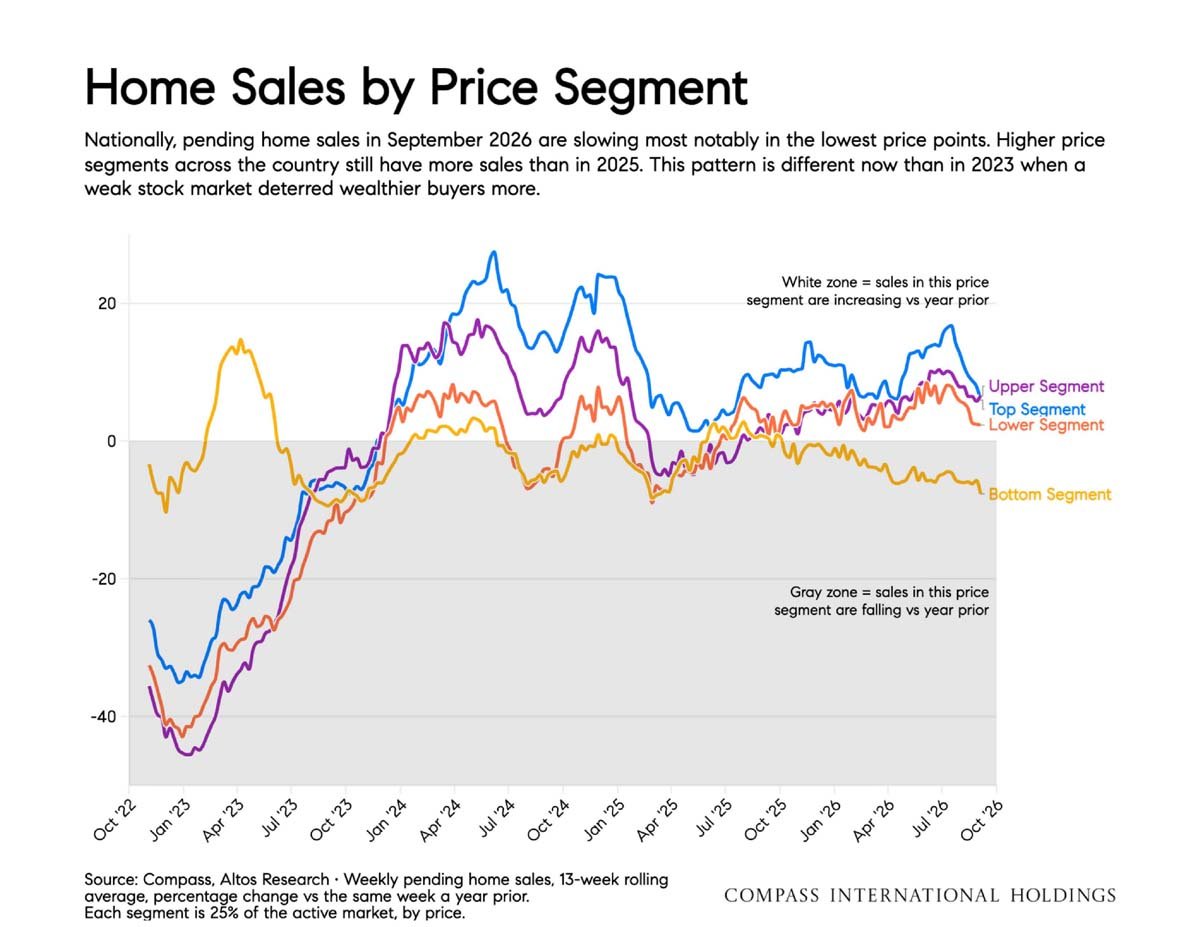
Chart of year-over-year pending home sales by price segment, October 2022–October 2026; higher segments outperform lower ones.
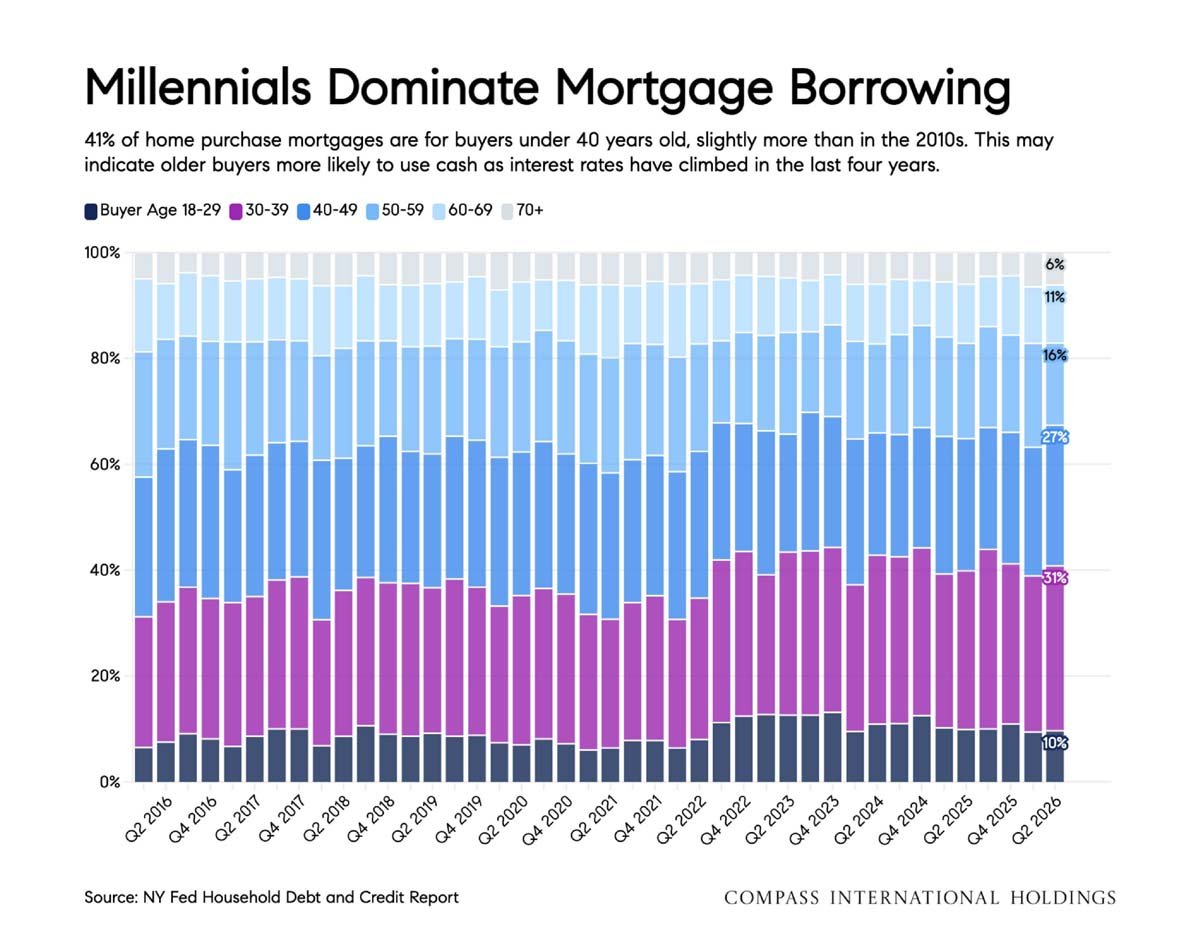
Chart of home purchase mortgage borrowers by age from 2016 to 2026, highlighting that 41% are under 40.
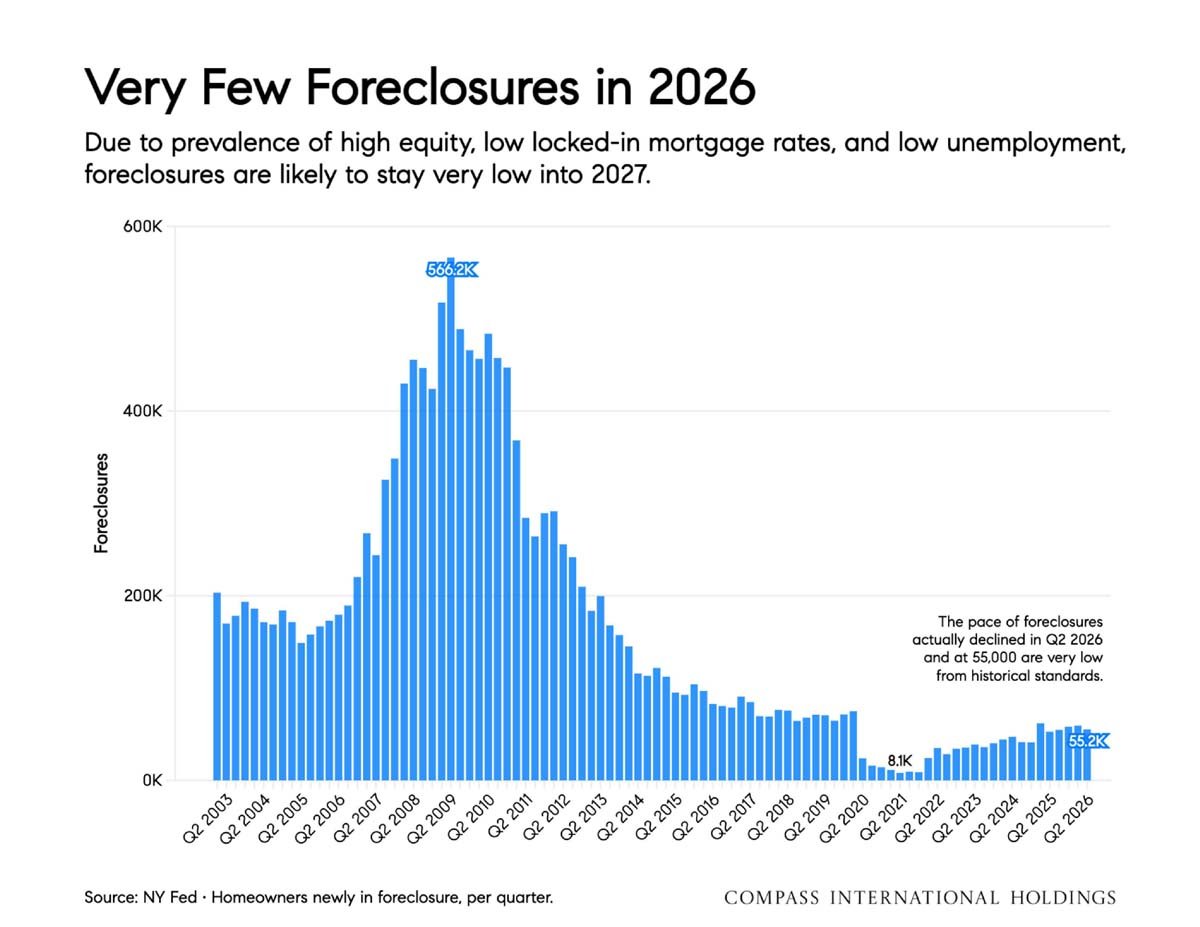
Bar chart of quarterly foreclosures from 2003 to 2026, peaking at 566.2K and reaching 55.2K in 2026.
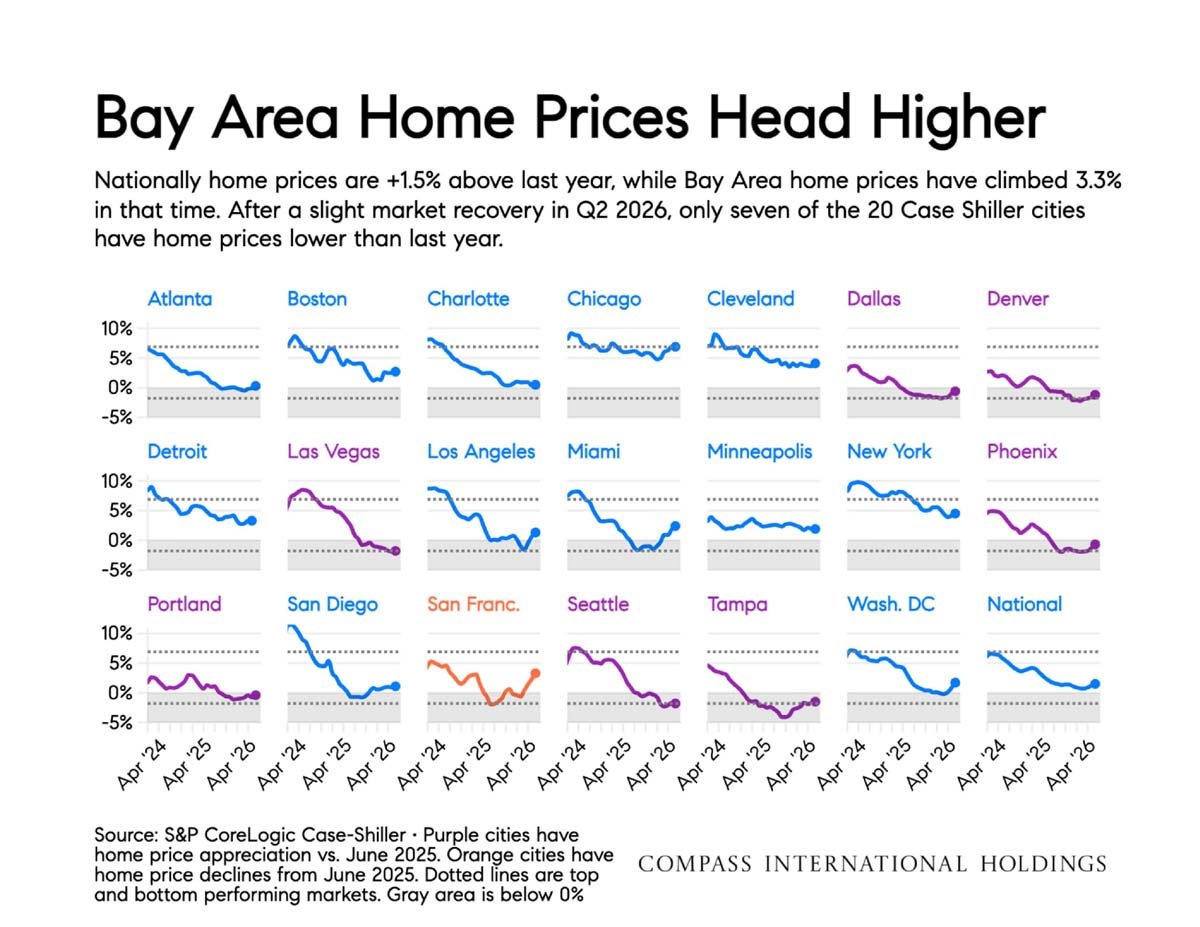
Bay Area home prices rose 3.3% year over year, with trends shown for 20 cities.
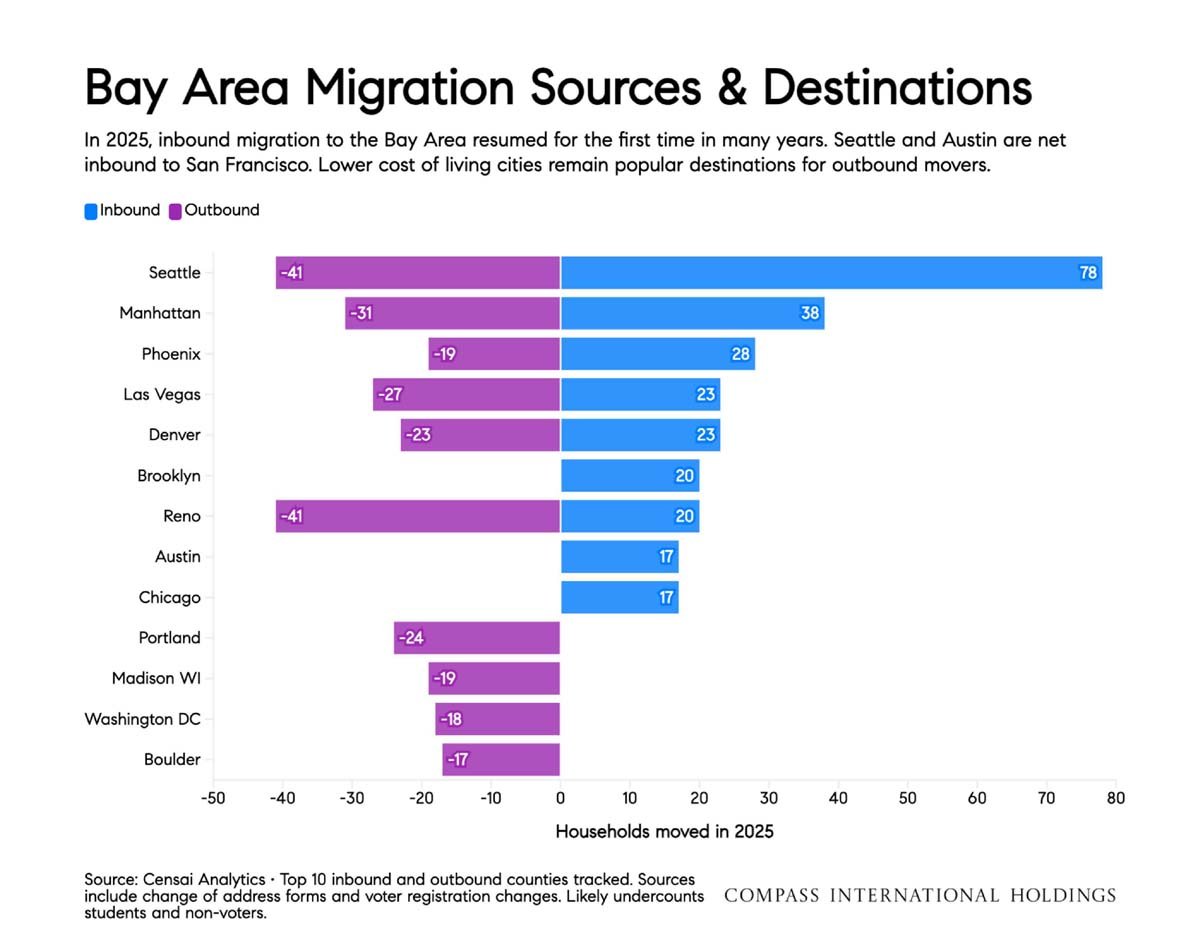
Chart compares 2025 Bay Area inbound and outbound household migration across cities, led by Seattle inbound.
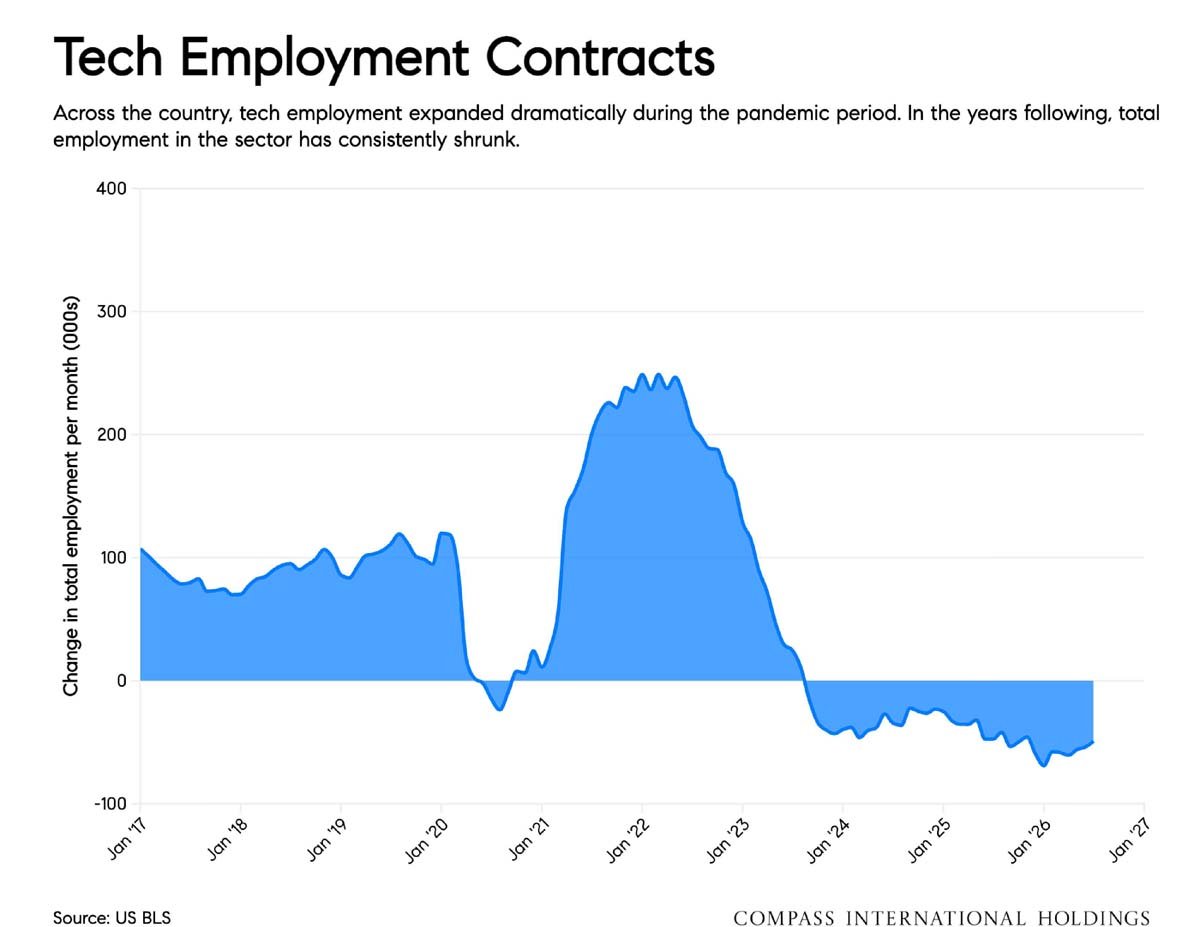
Chart of U.S. tech employment change, peaking in 2022 before falling below zero from 2023 through 2026.
Compass

Work With Jane

Get assistance in determining the current property value, crafting a competitive offer, writing and negotiating a contract, and much more. Contact me today.

Follow Me on Instagram