November 2026 San Francisco House & Condo Market Outlook

November 2026 San Francisco House & Condo Market Outlook

San Francisco's single-family market was exceptionally tight in October. Active listings fell 20% from a year ago to 222, leaving 0.9 months of supply, and homes sold in 14 days on average, the fastest of any month since at least 2020. 86% of homes sold above list, up 9%, the highest October level since at least 2020. The median rose 29% to $2,390,000, the highest of any month since at least 2020. Condos were also strong, with overbidding at 68%, though condo price cuts rose from a low base.

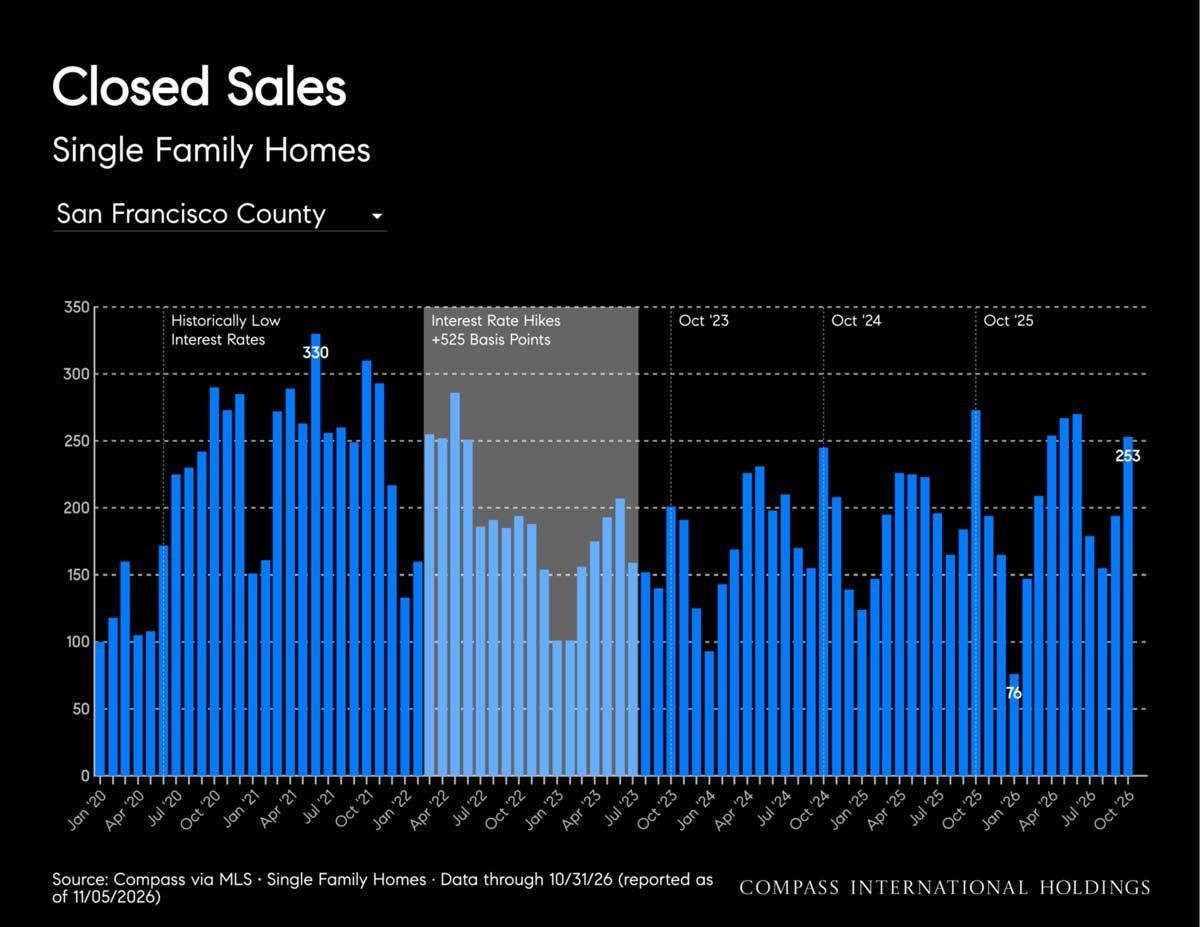
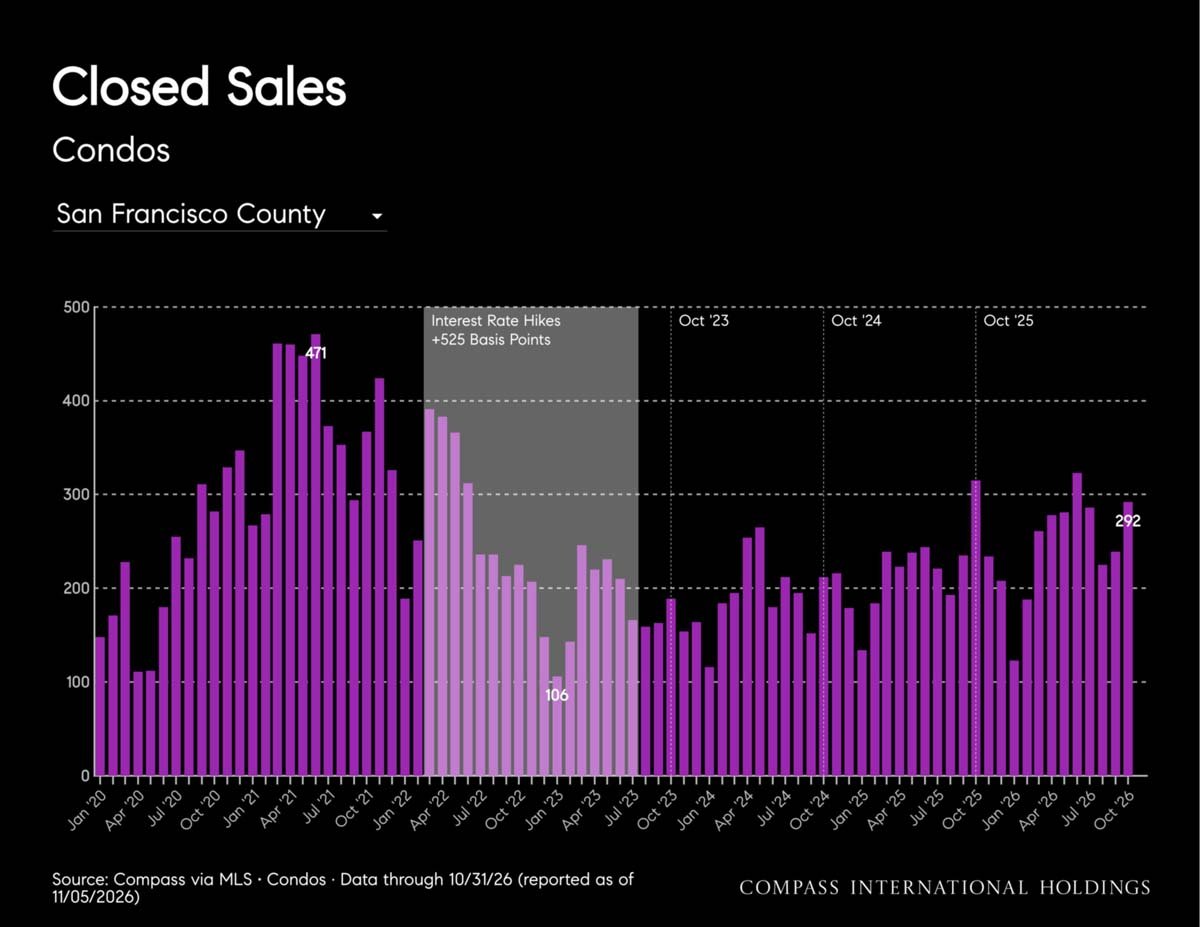
  • Sales: 253 single-family homes closed in October, down 7% YoY and up 30% from September. Condo closings fell 7% YoY to 292.
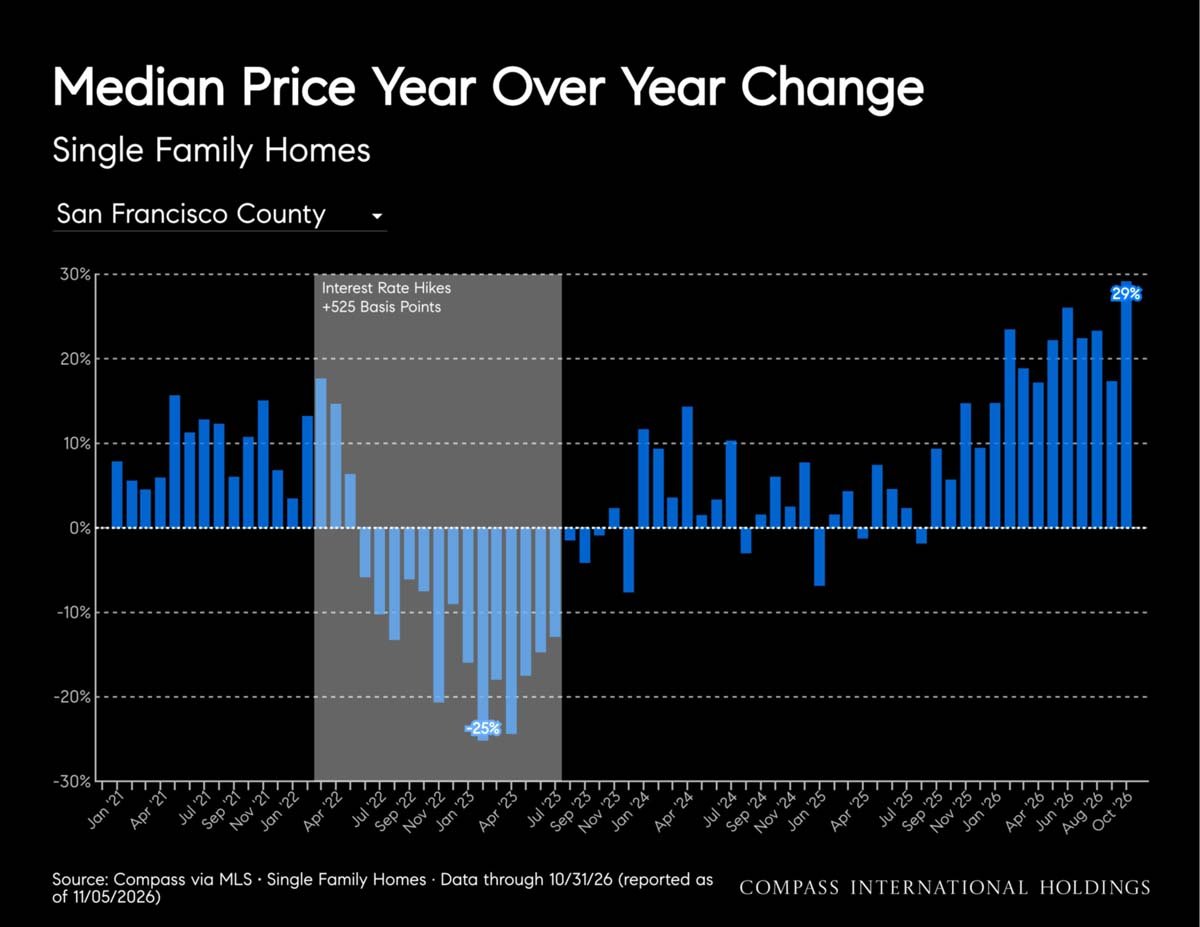
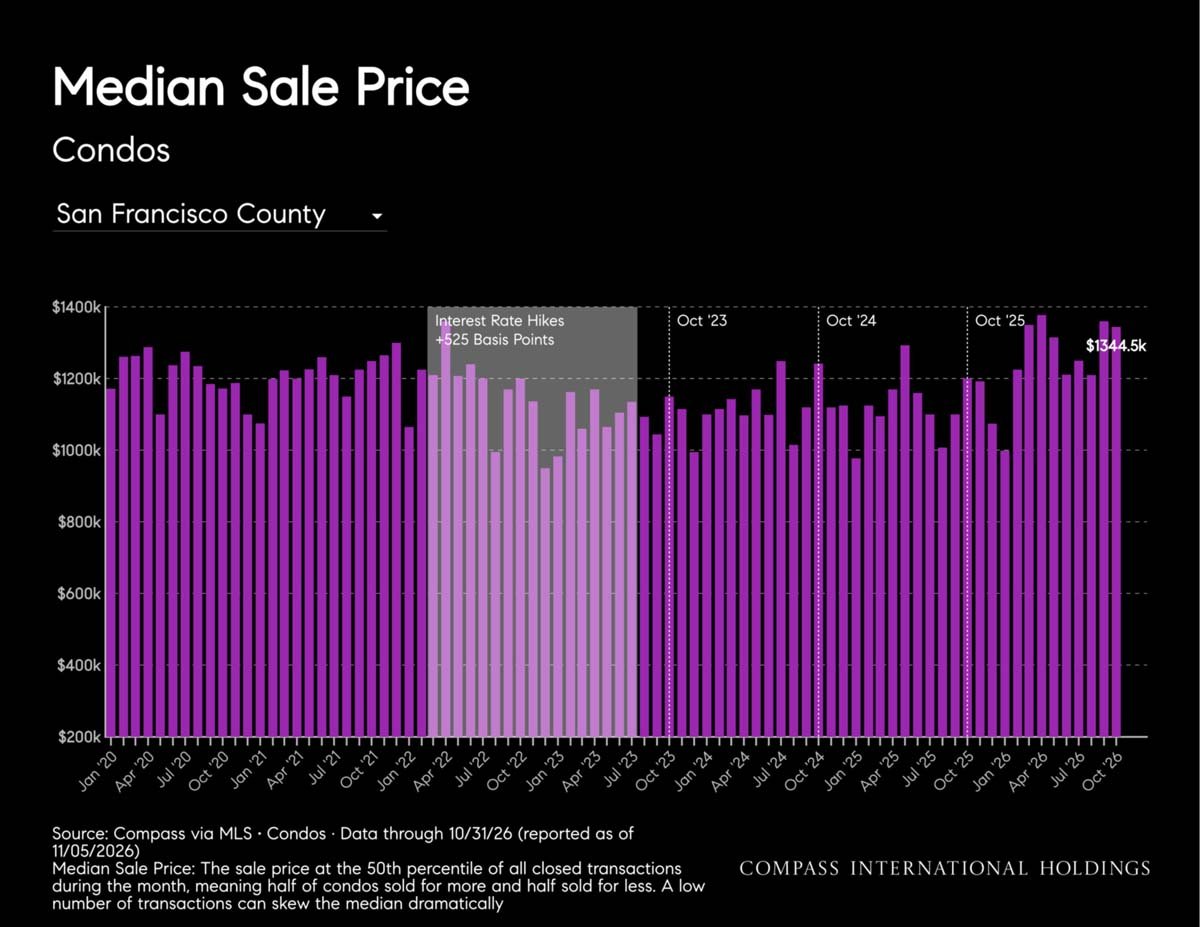
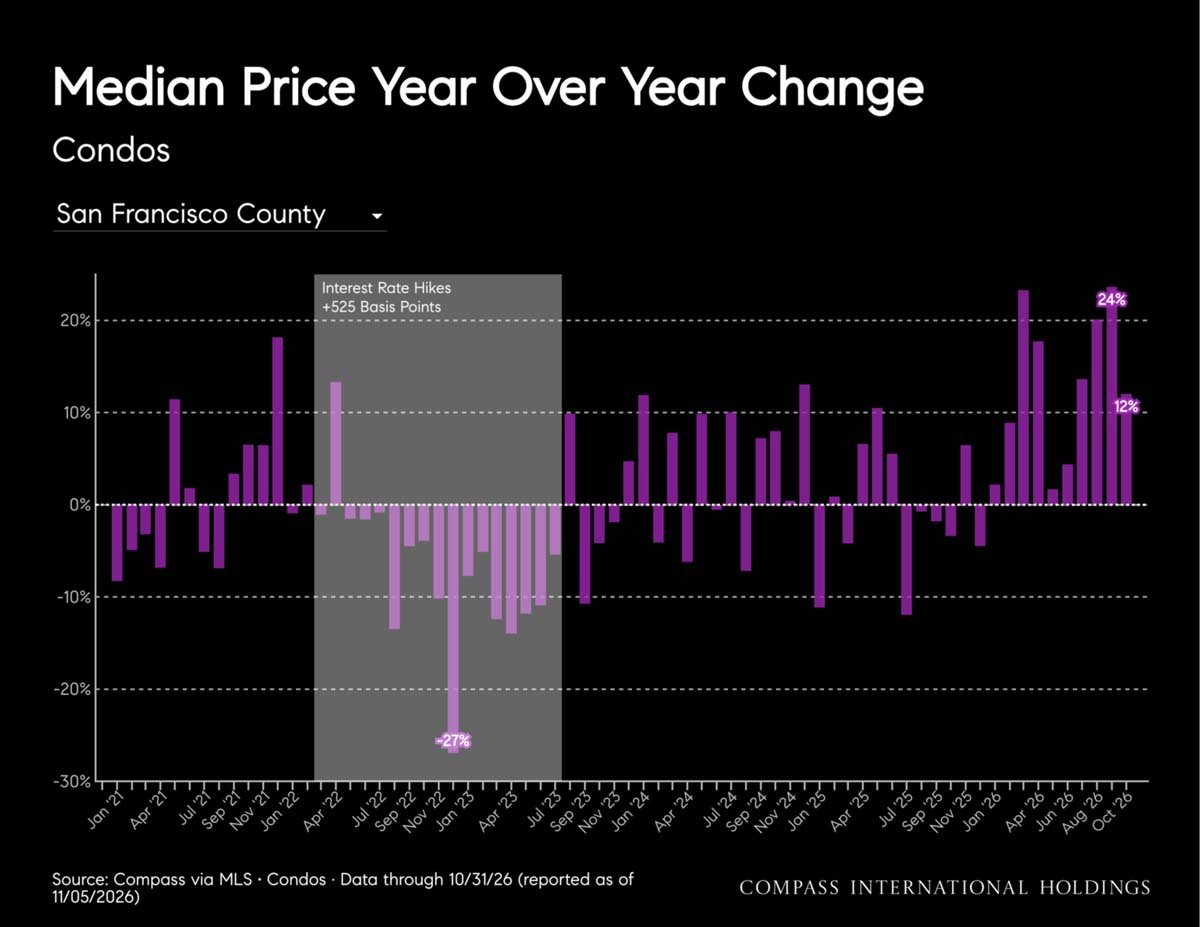
  • Prices: The single-family median rose 29% YoY to $2,390,000. The condo median rose 12% YoY to $1,344,500, the highest October median since at least 2020.
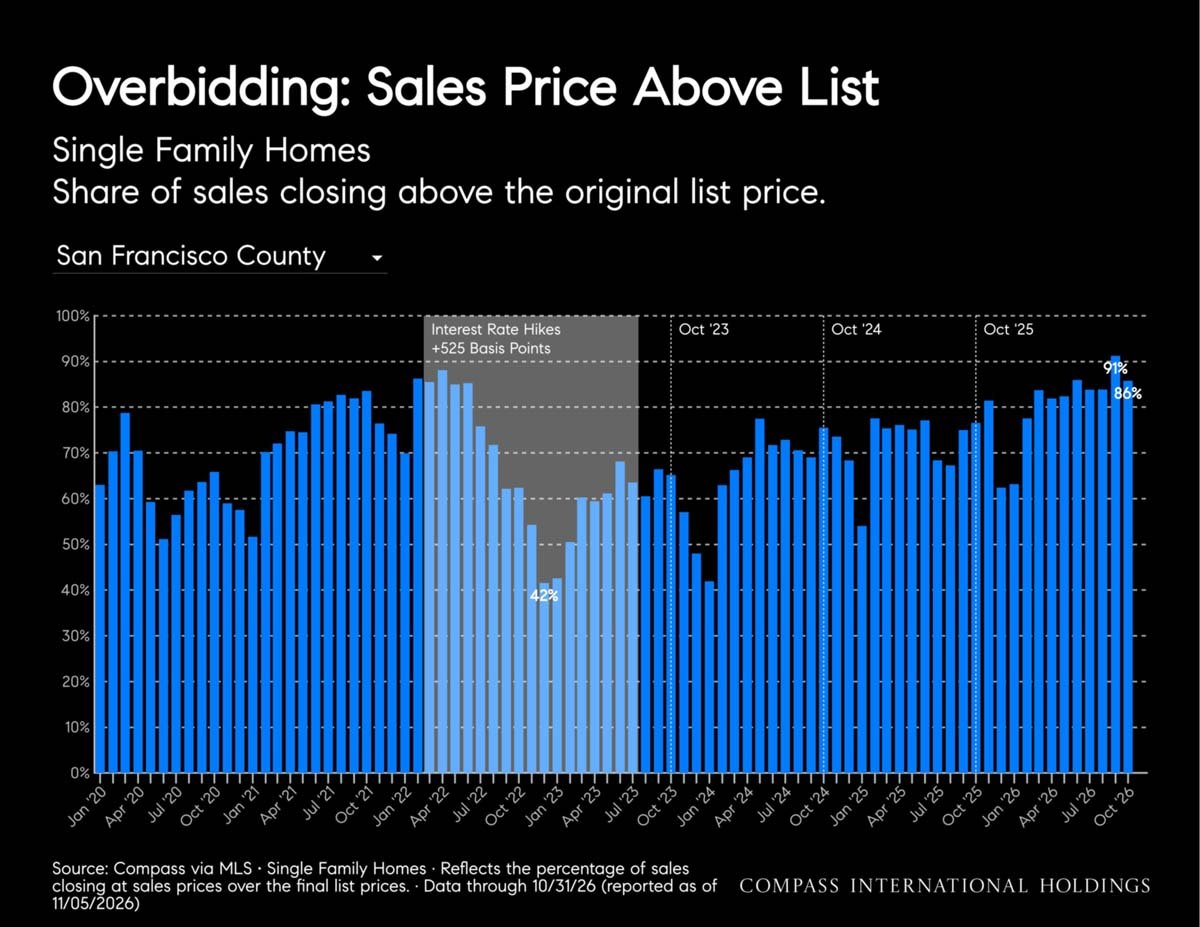
  • Competition: 86% of single-family sales closed above list, up 9% YoY. Condo overbidding was 68%, up 25%; both are the highest October levels since at least 2020.
  • Inventory: Active single-family listings fell 20% YoY to 222, while new listings rose 5% to 287. Condo active listings fell 24% to 545. Both active counts are the lowest October levels since at least 2020.
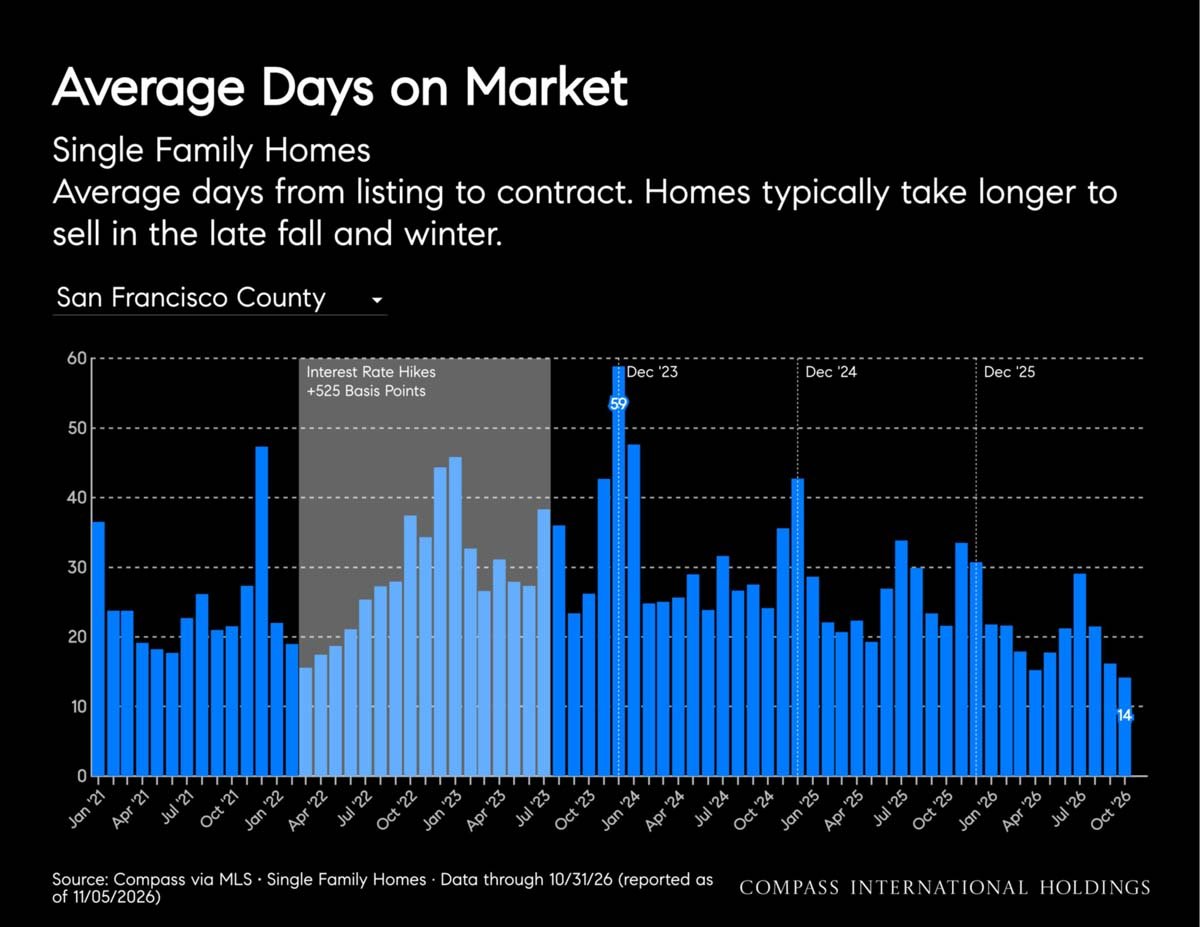
  • Single family: Days on market fell to 14 days from 22 a year ago, while months of supply was 0.9, the lowest October level since at least 2020. Price reductions rose to 23 from 19, with the reduction rate at 7%.
  • Condos: Condo supply fell to 1.9 months from 2.3 and condo days on market fell 16% to 36.
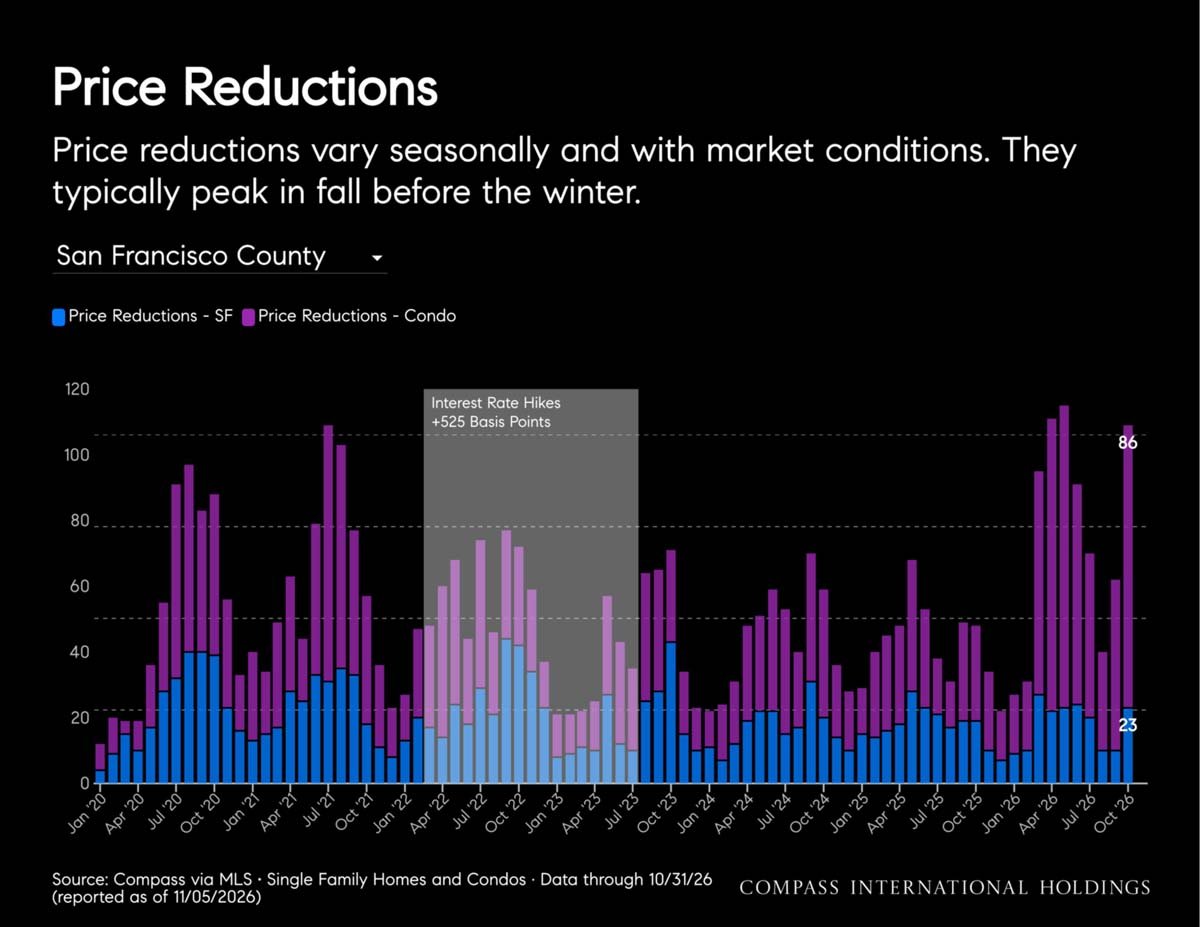
  • Price cuts rose from a low base: 18% of condo listings took one, up 13%, the highest October level since at least 2020.
  • MOM: Single-family closings rose 30% from September and the median rose 16%, while months of supply fell to 0.9 from 1.2. Overbidding eased 5% to 86%. Condo price reductions rose 65%.
  • Bottom line: A very tight, highly competitive market for both property types; rising condo price cuts are the one sign of buyer pushback.
  • Data quality: A 16% one-month rise in the single-family median likely reflects the mix of homes sold, so the 29% YoY gain should be interpreted cautiously.
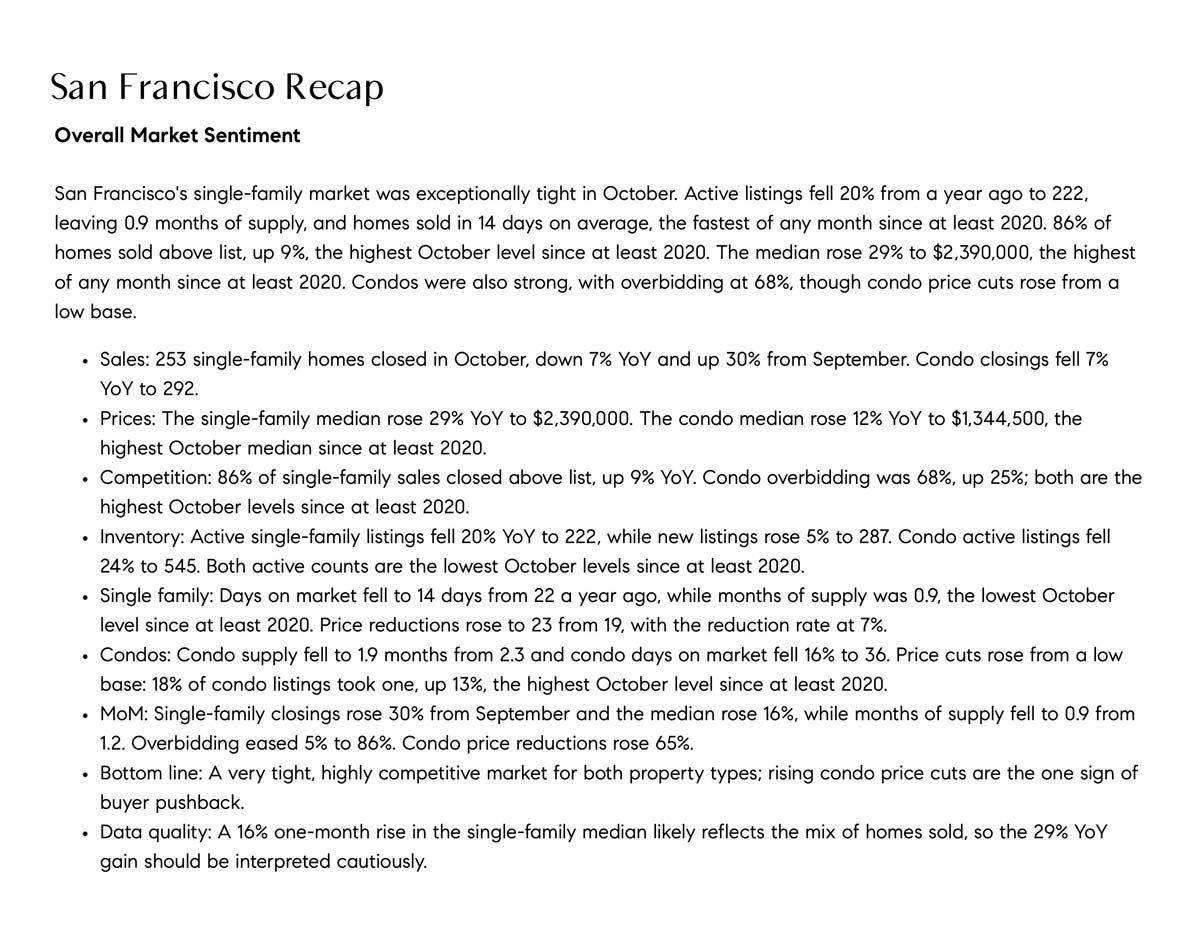
San Francisco market recap with October housing sales, prices, competition, inventory, and supply statistics.
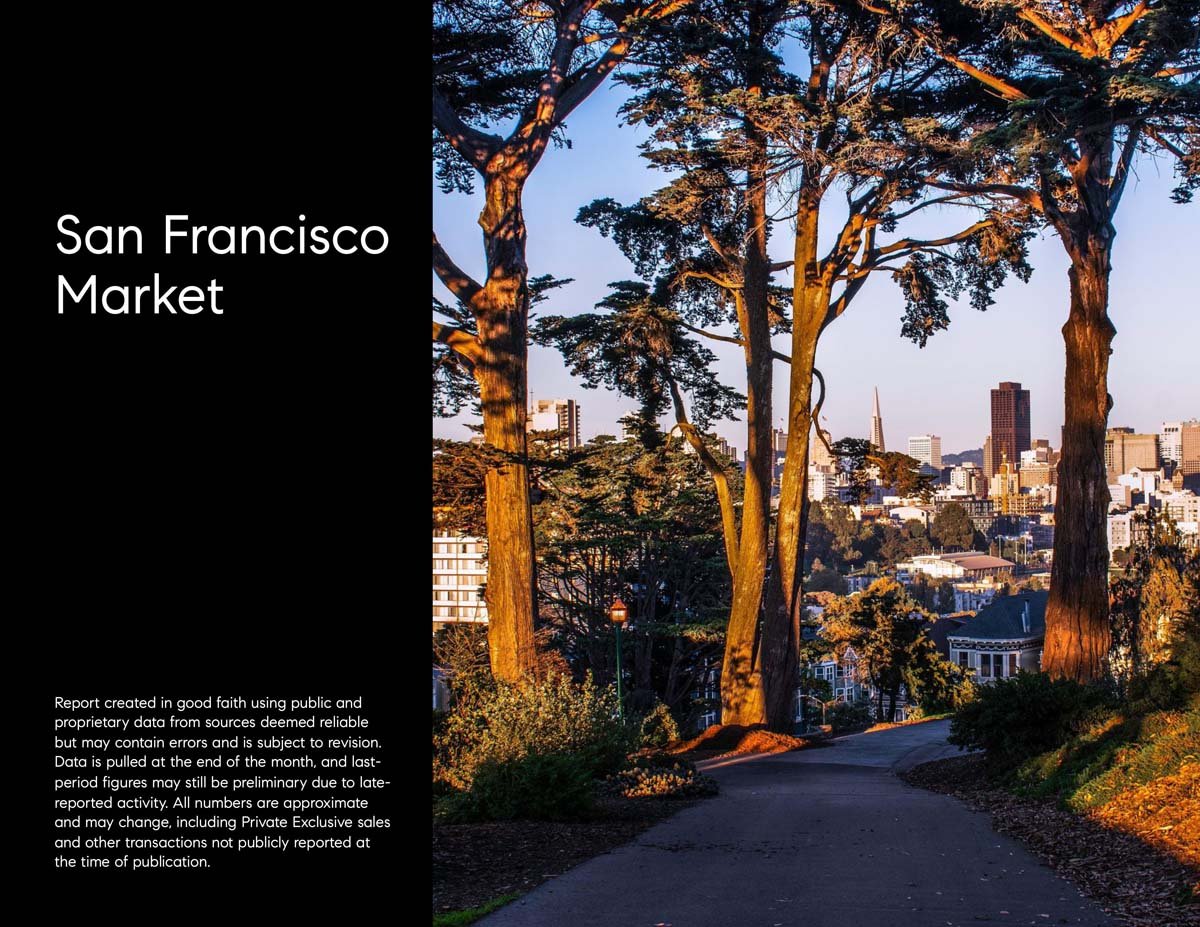
San Francisco Market
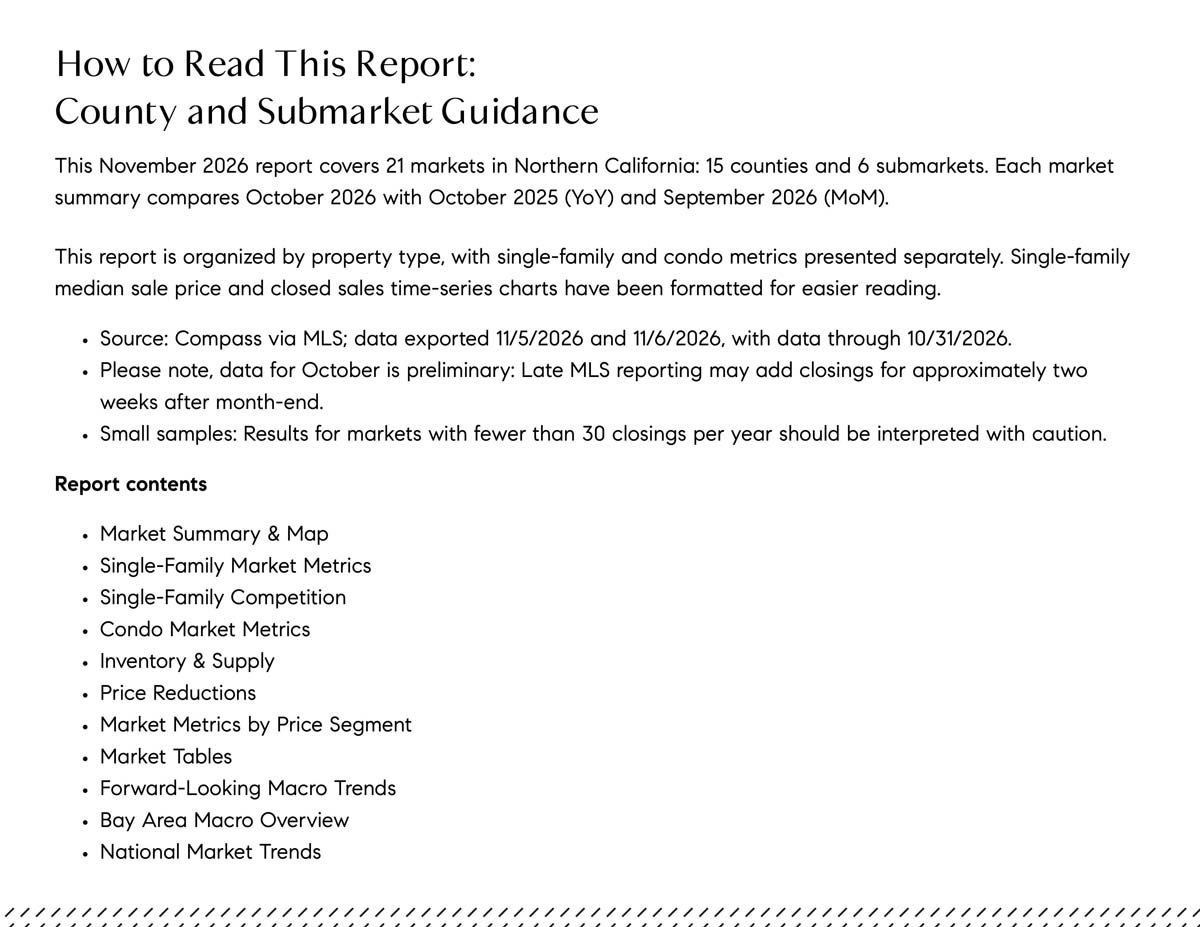
November 2026 San Francisco housing market report: county and submarket guidance and contents
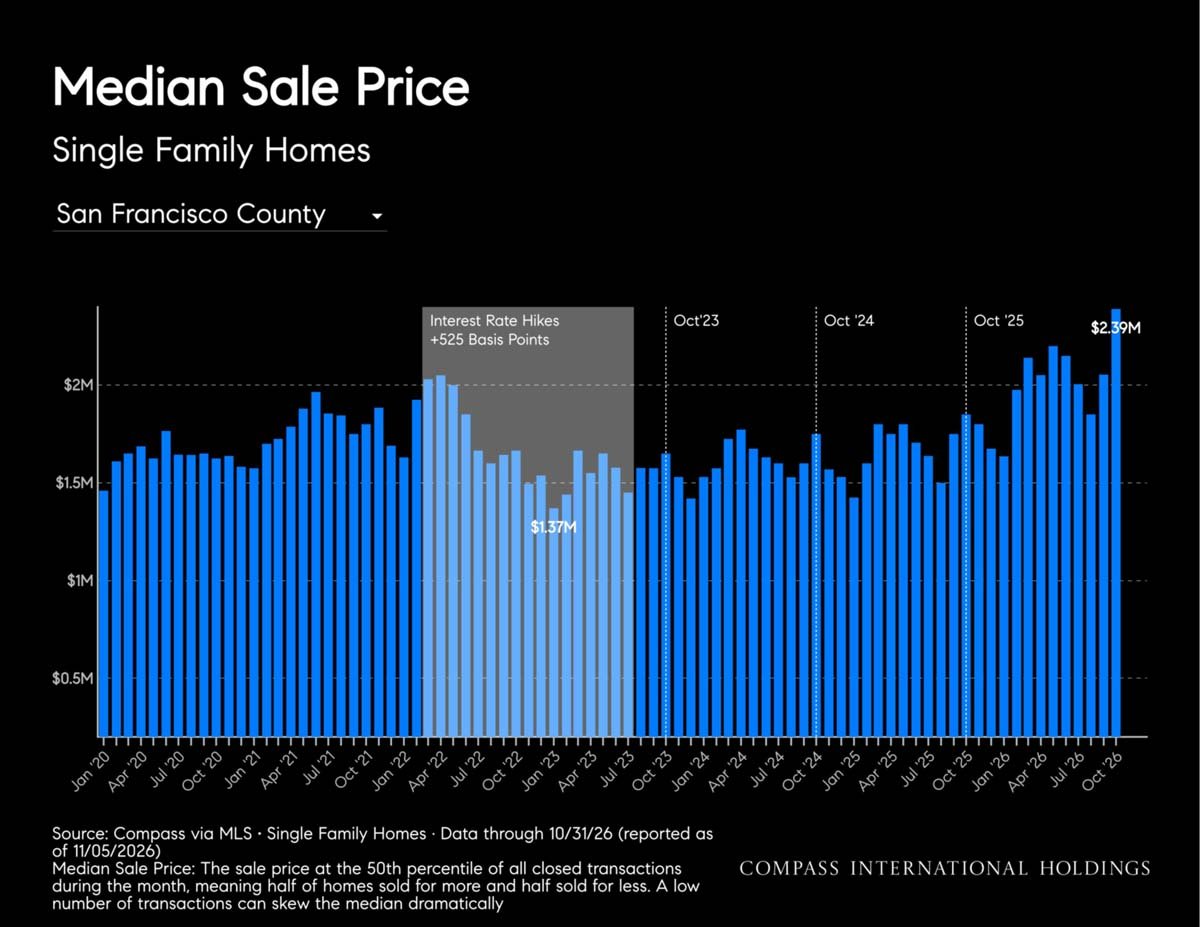
Bar chart of San Francisco single-family home median sale prices, Jan 2020–Oct 2026, reaching $2.39M.
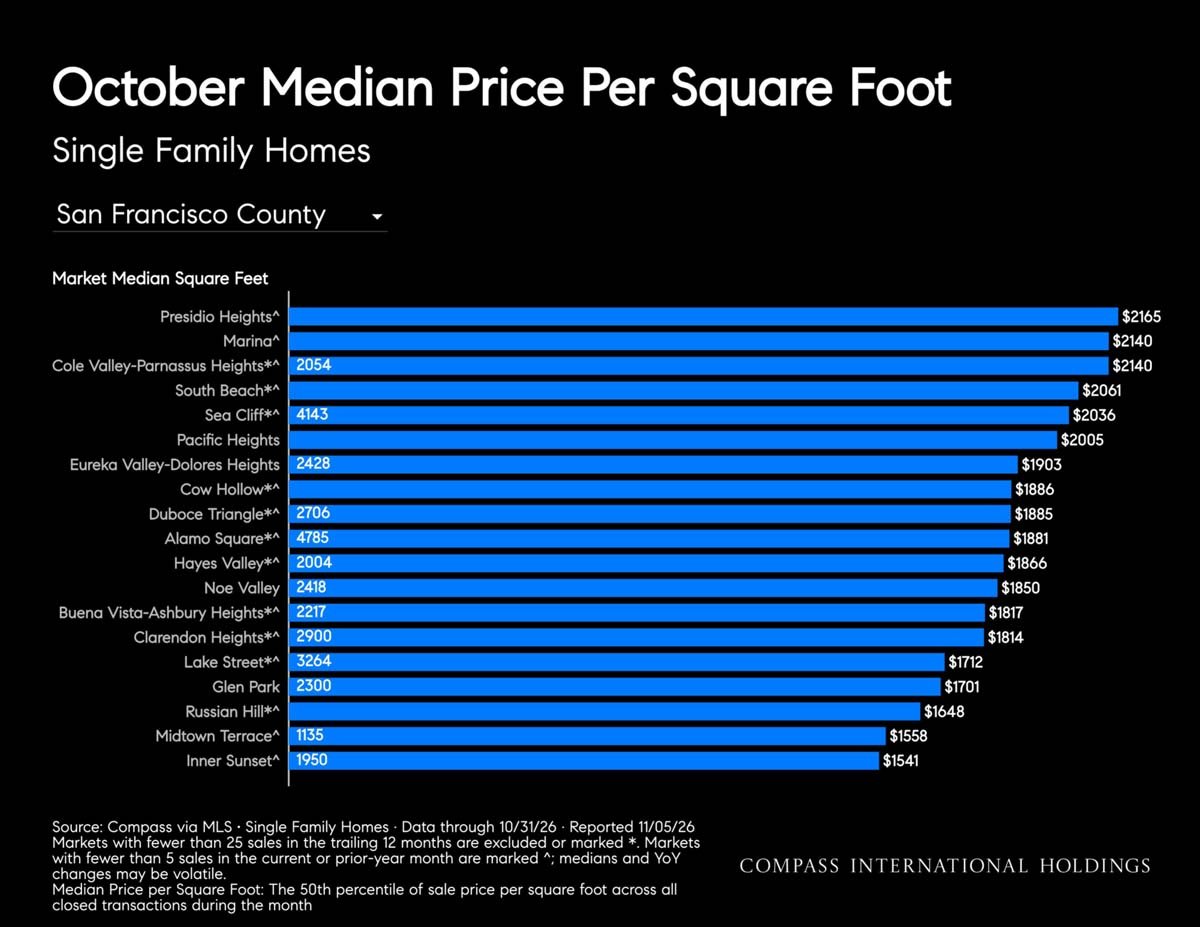
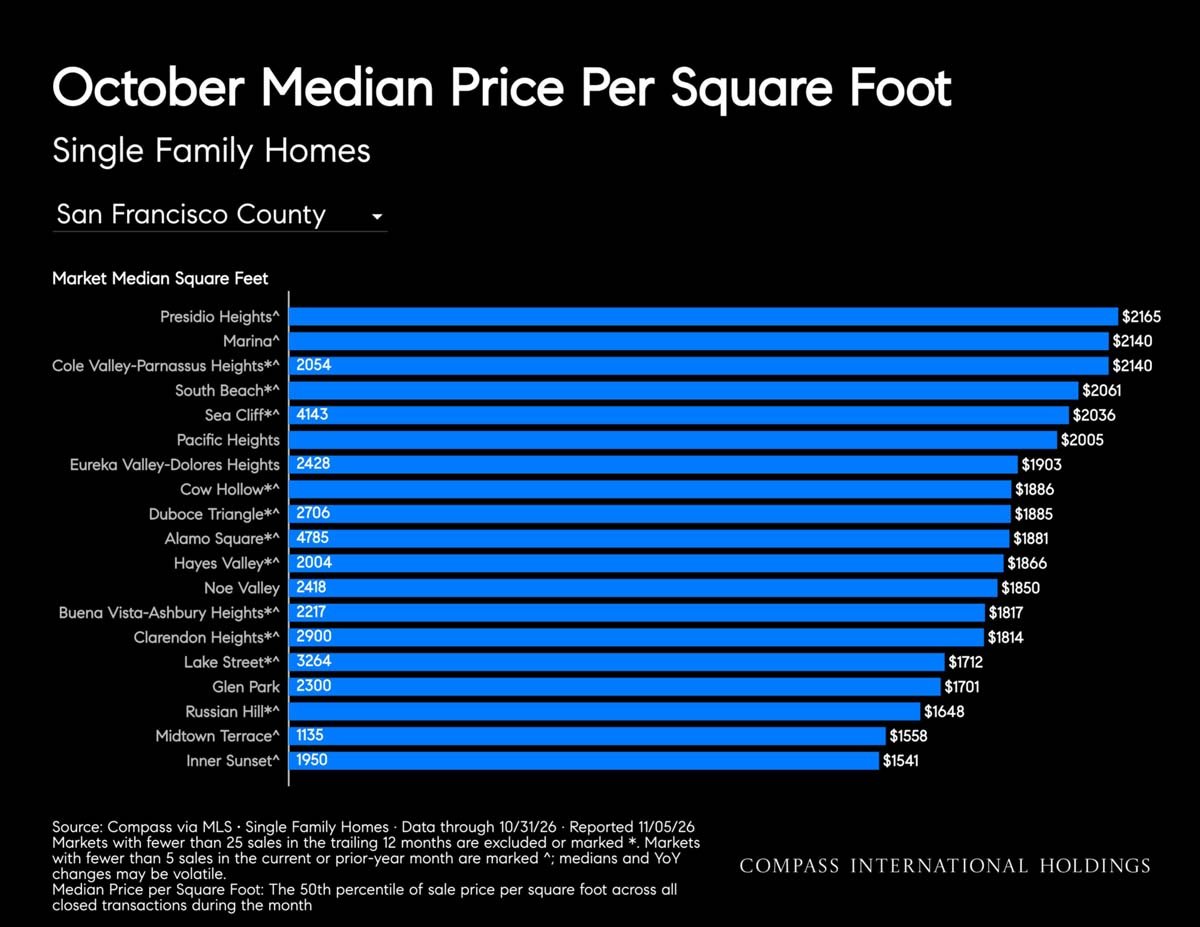
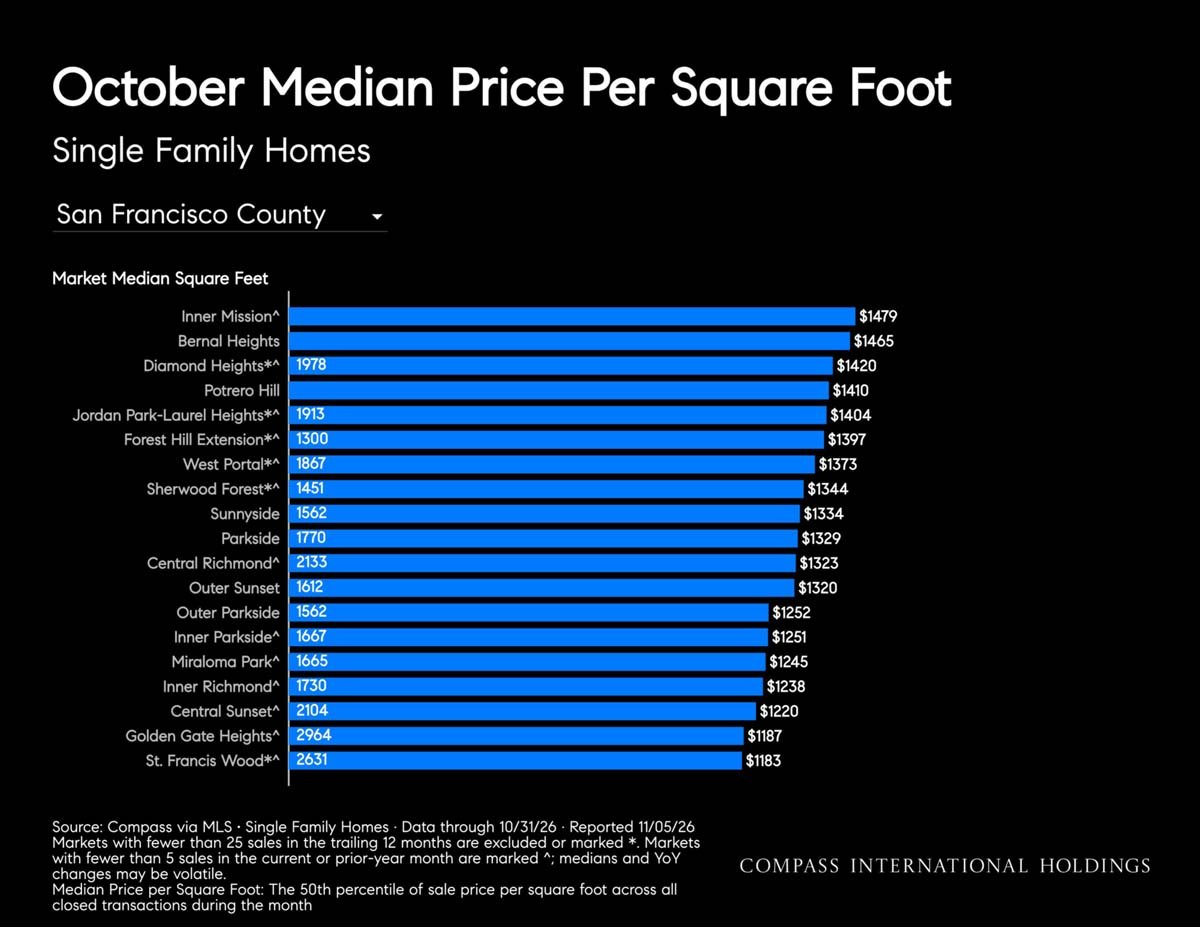
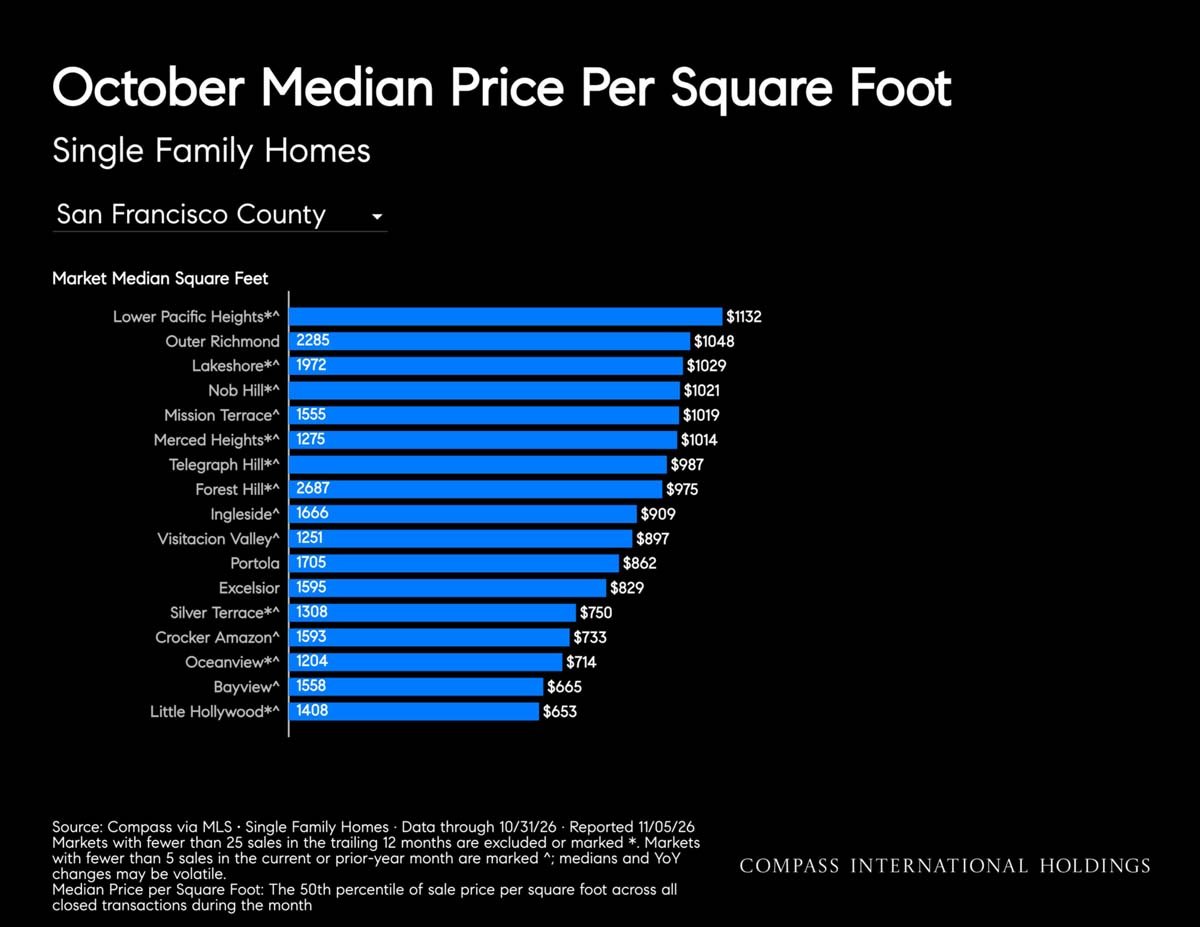
October median price per square foot for San Francisco single-family homes, by neighborhood.
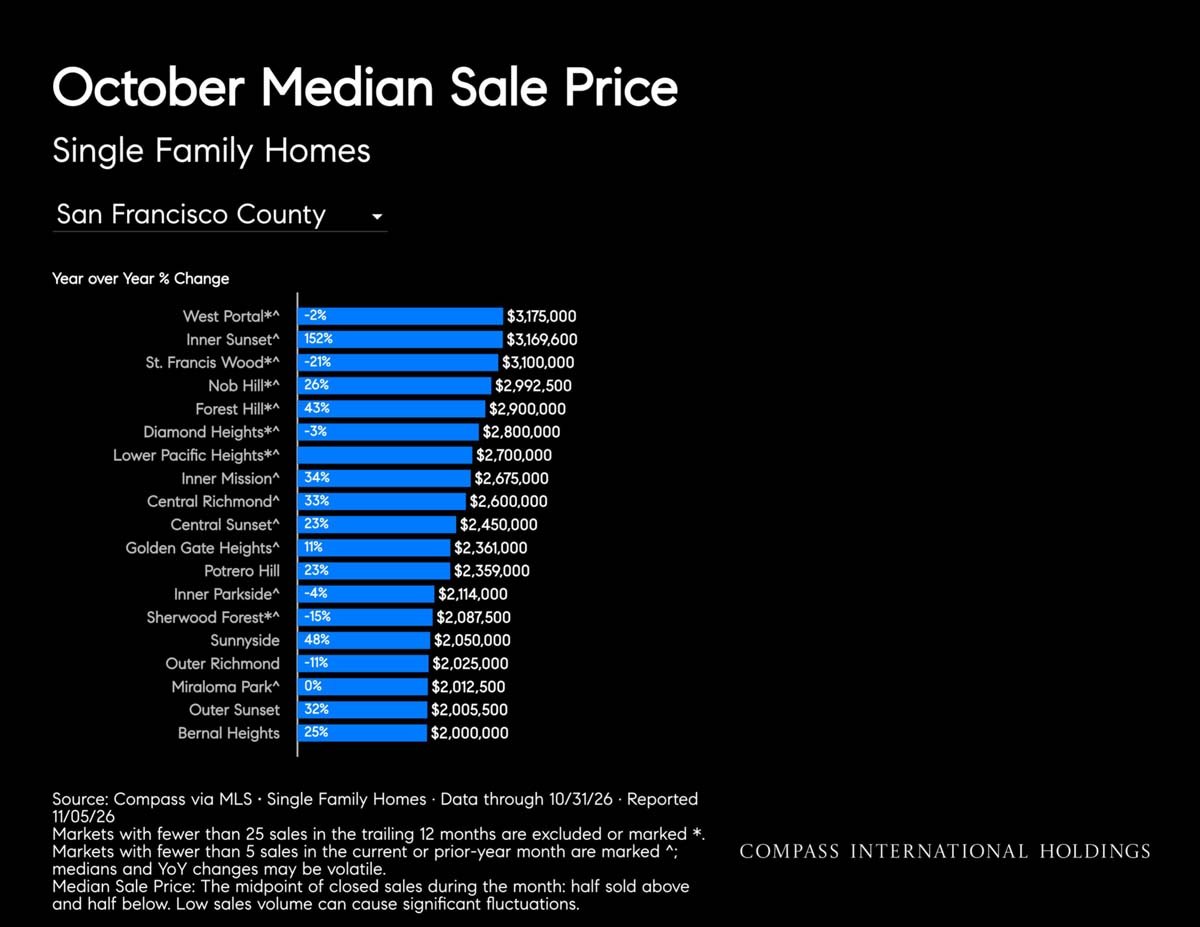
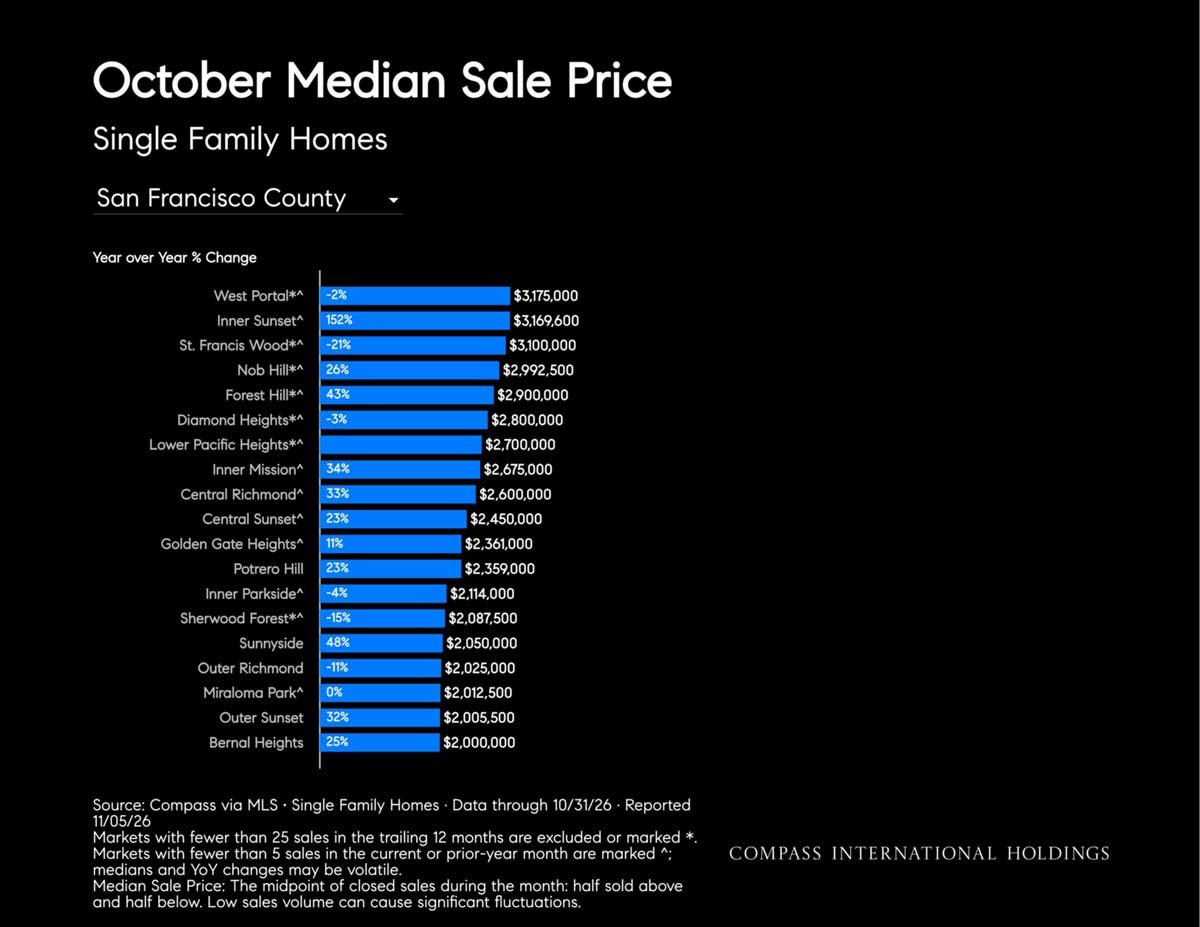
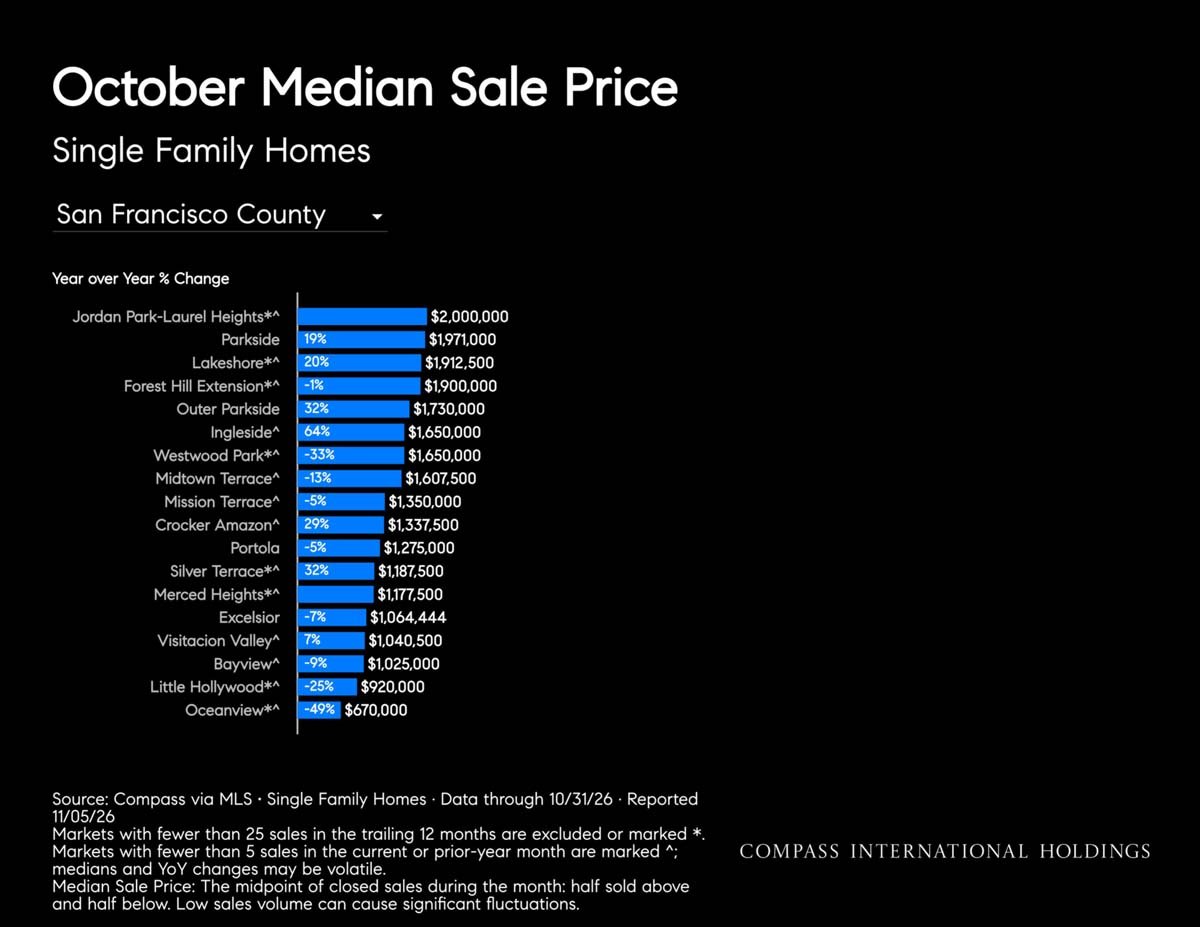
Bar chart of October median single-family home sale prices by San Francisco neighborhood.
Chart of October median sale prices for San Francisco single-family homes by neighborhood.
October median sale prices for San Francisco single-family homes by neighborhood, with year-over-year changes.
Chart of San Francisco County single-family home median price year-over-year changes, ending at 29% in October 2026.
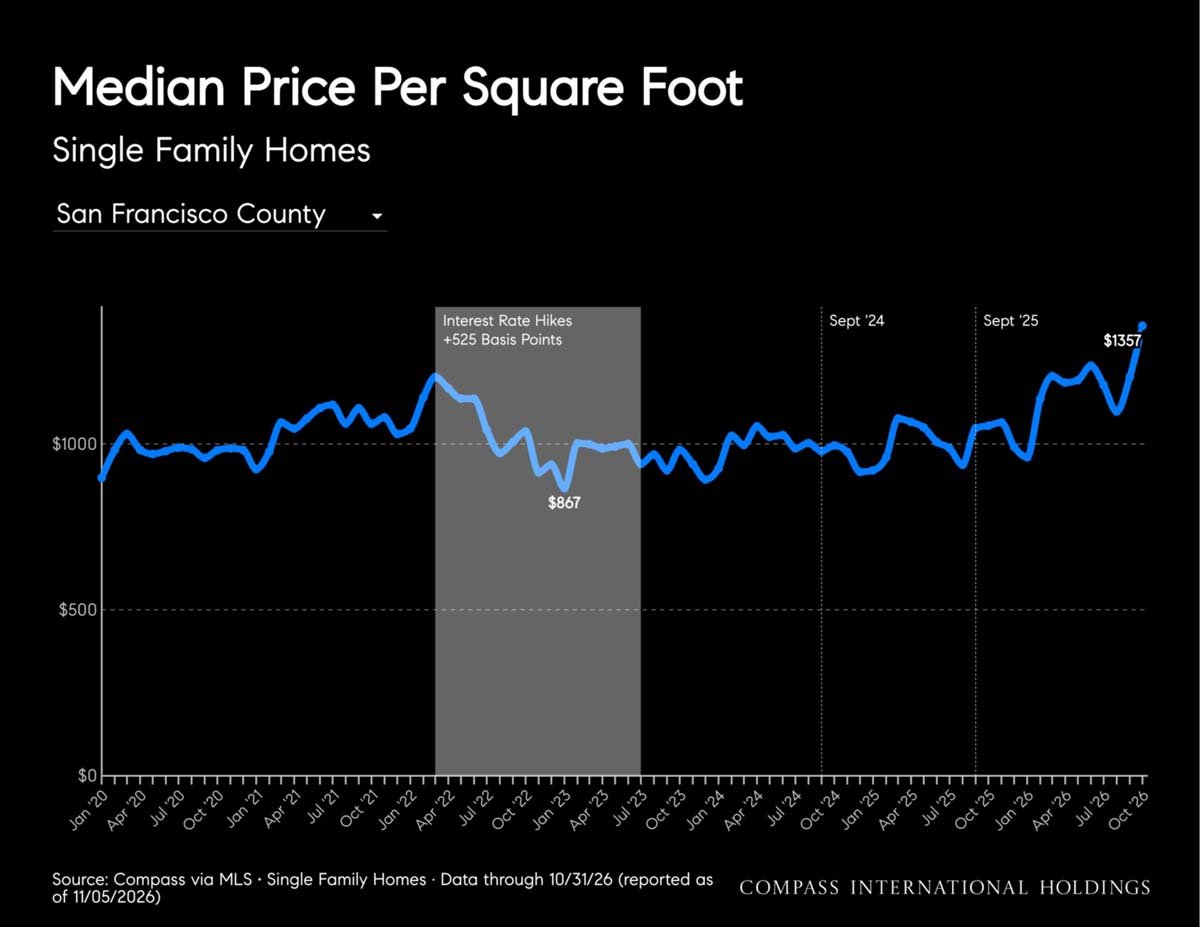
Median price per square foot for San Francisco single-family homes, January 2020–October 2026.
Bar chart comparing October median price per square foot for San Francisco single-family home neighborhoods.
Bar chart of October median price per square foot for San Francisco single-family homes by neighborhood.
Chart of San Francisco County single-family home sales from January 2020 to October 2026, with monthly closed sales and interest-rate annotations.
San Francisco single-family home sales above list price rise to 91% in October 2026.
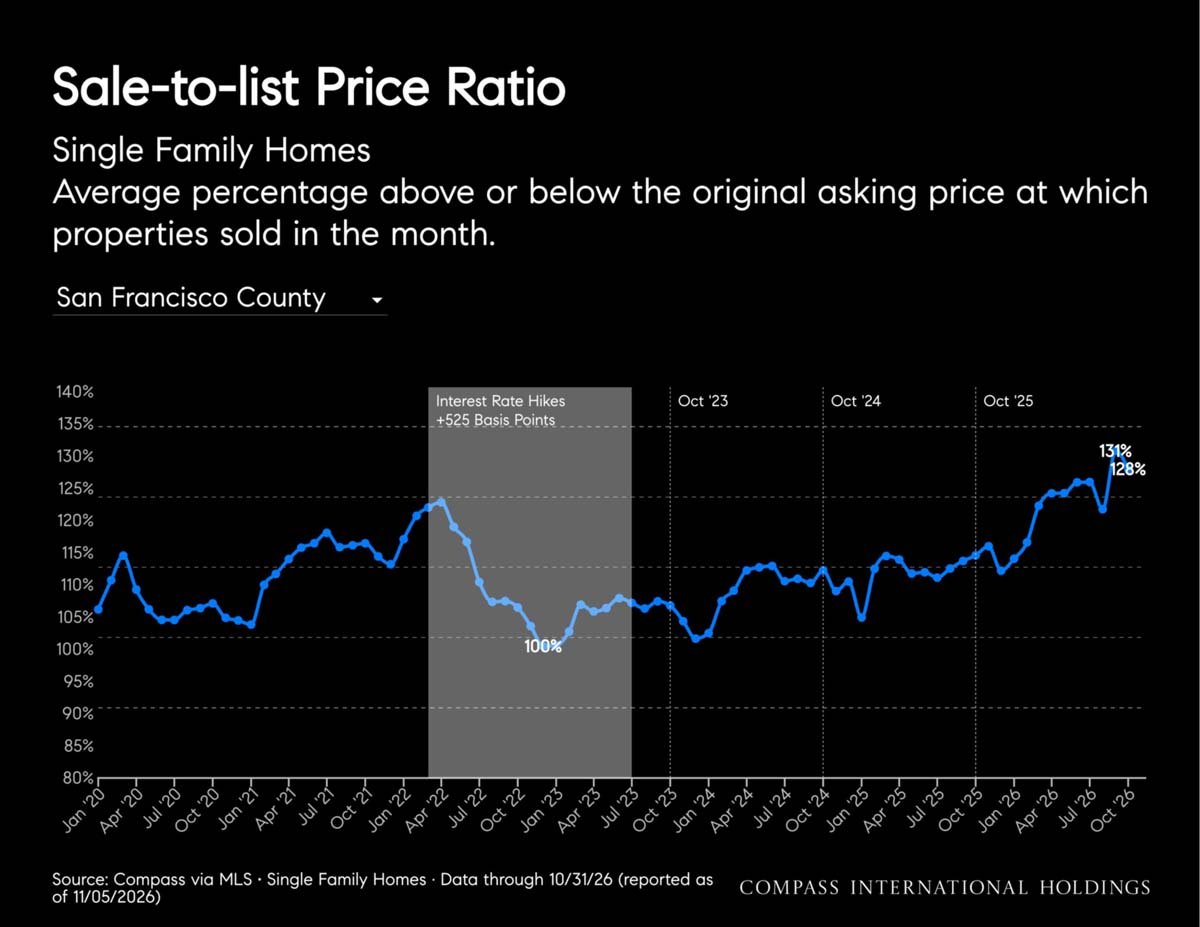
San Francisco County single-family home sale-to-list price ratio chart, 2020–October 2026.
Average days on market for San Francisco single-family homes, January 2021 to October 2026
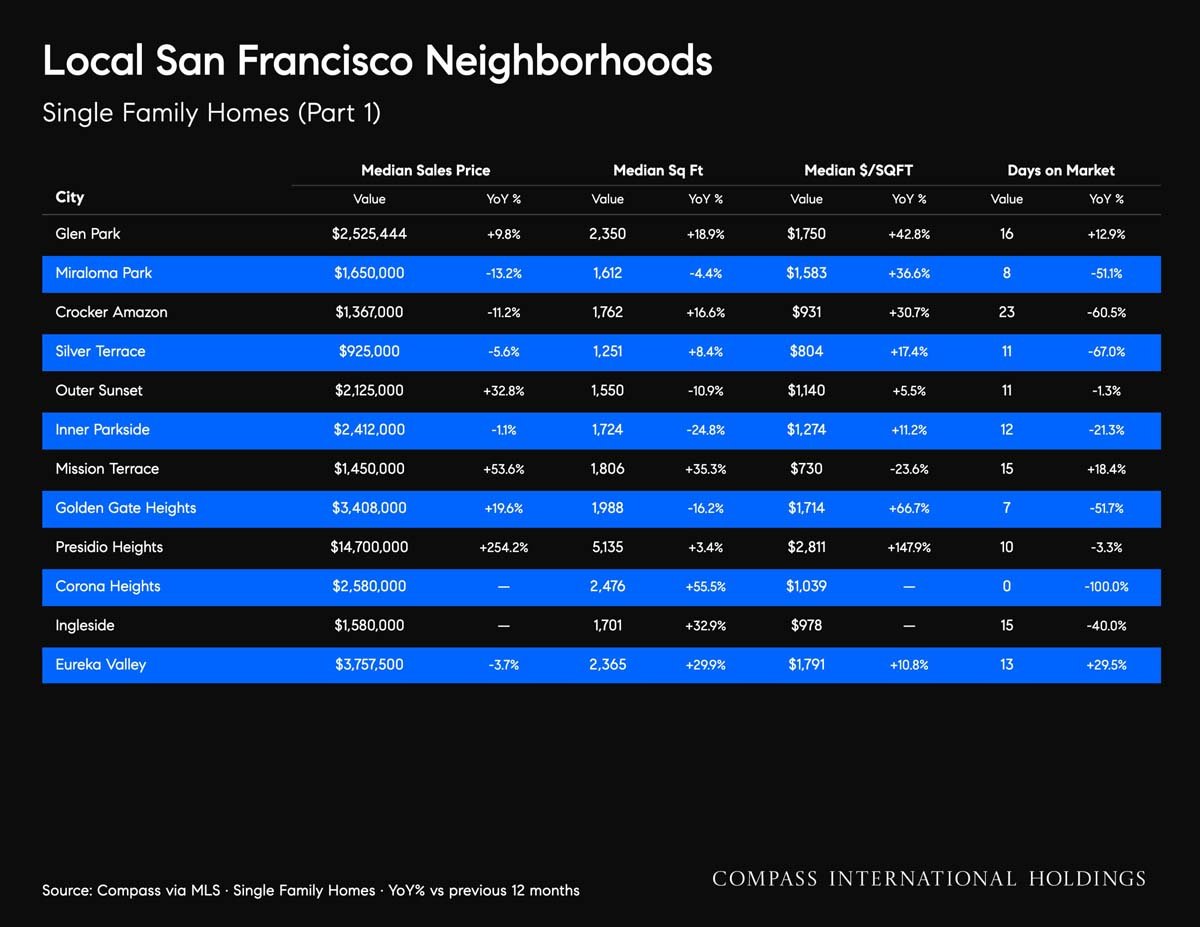
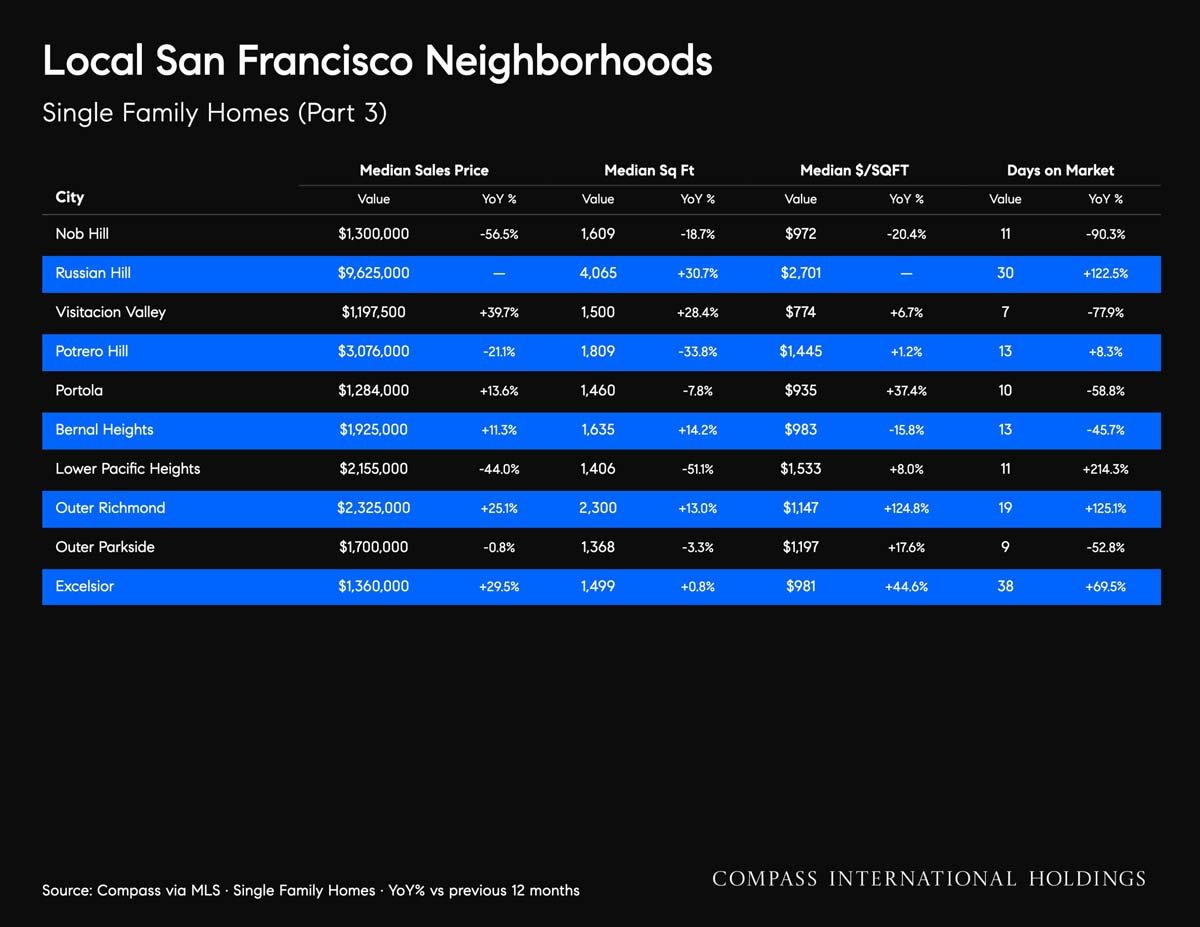
San Francisco neighborhood single-family home market statistics, including prices, square footage, and days on market.
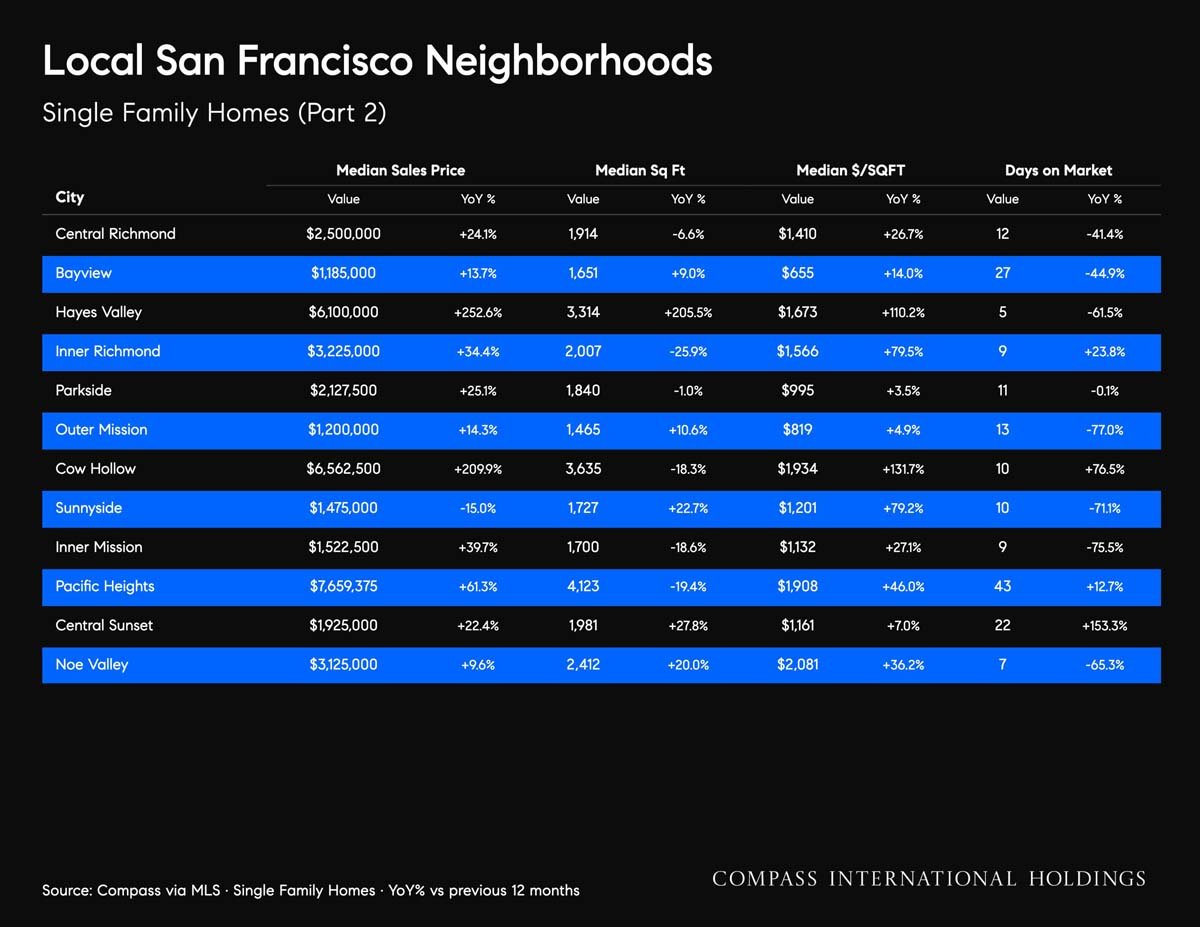
San Francisco single-family home neighborhood sales statistics and year-over-year market changes.
November 2026 San Francisco single-family home market table by neighborhood, showing prices, square footage and days on market.
November 2026 San Francisco House & Condo Market Outlook
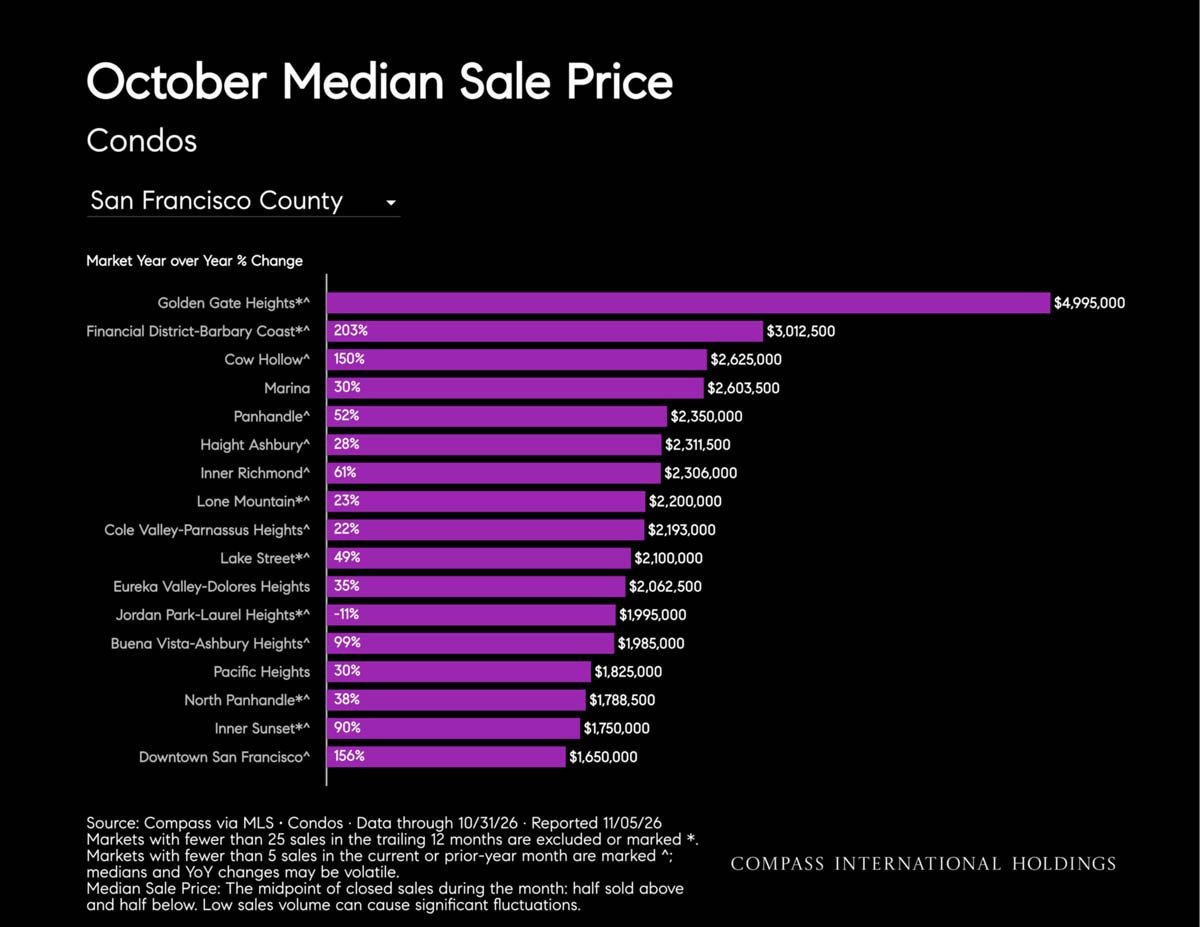
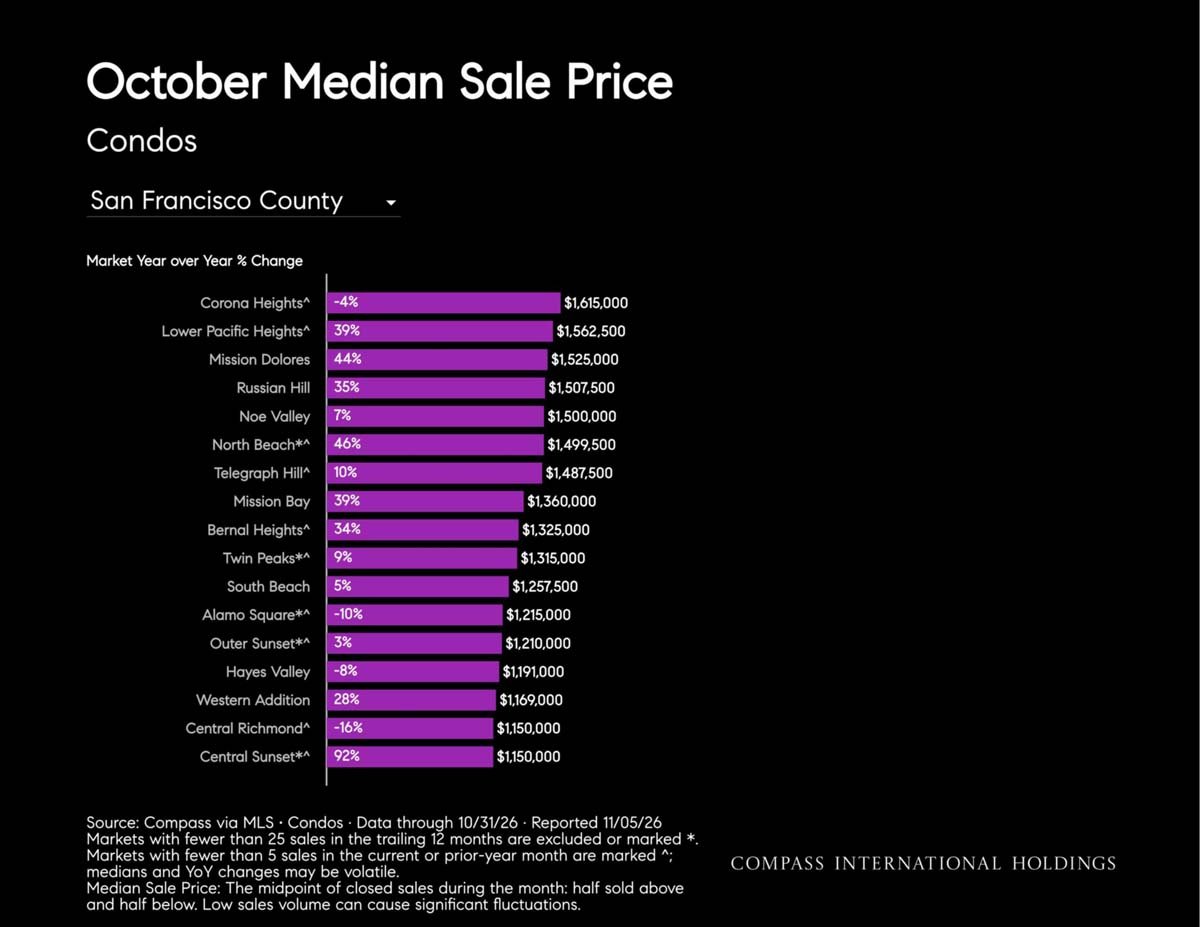
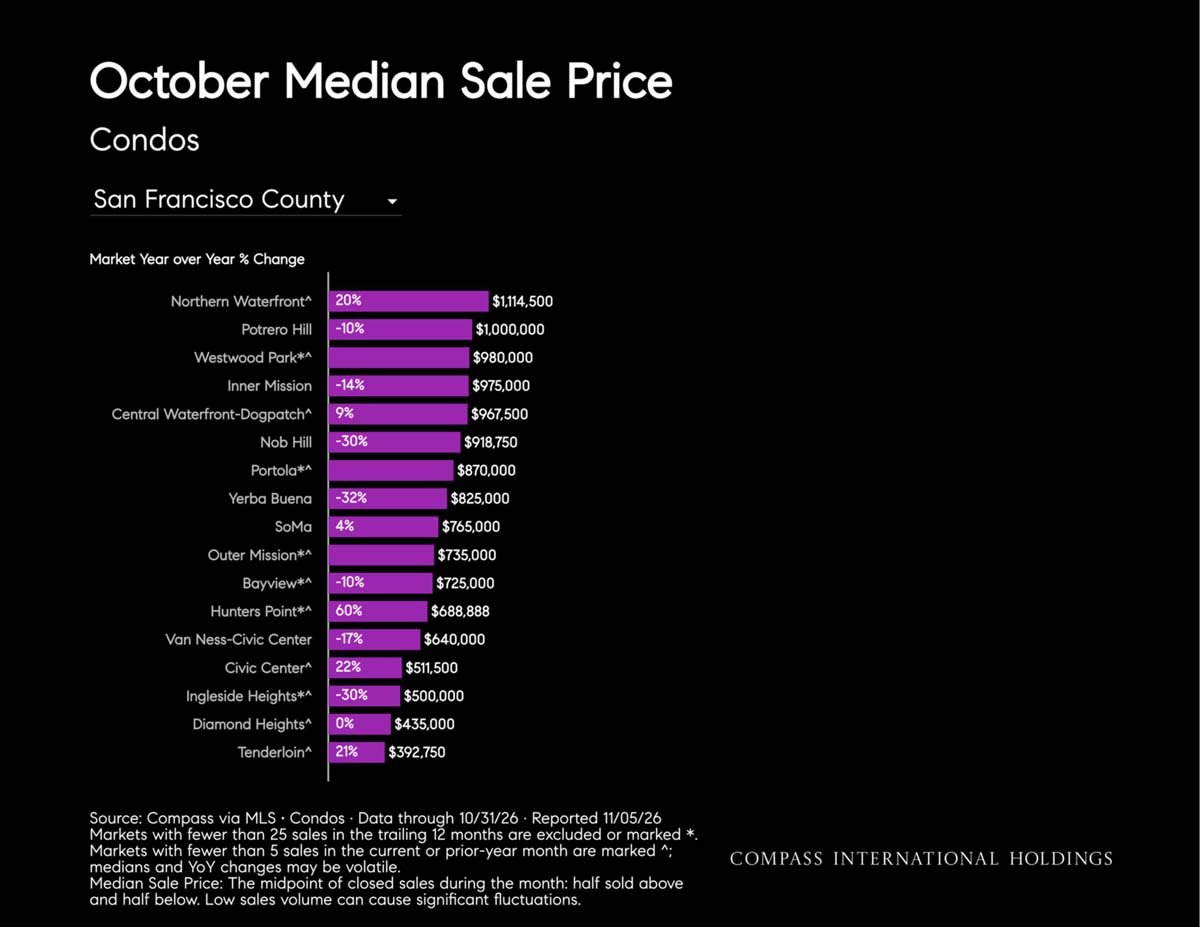
October median condo sale prices in San Francisco County by neighborhood
Chart of October median condo sale prices and year-over-year changes across San Francisco neighborhoods.
Chart of October condo median sale prices by San Francisco neighborhood, with year-over-year changes.
November 2026 San Francisco House & Condo Market Outlook
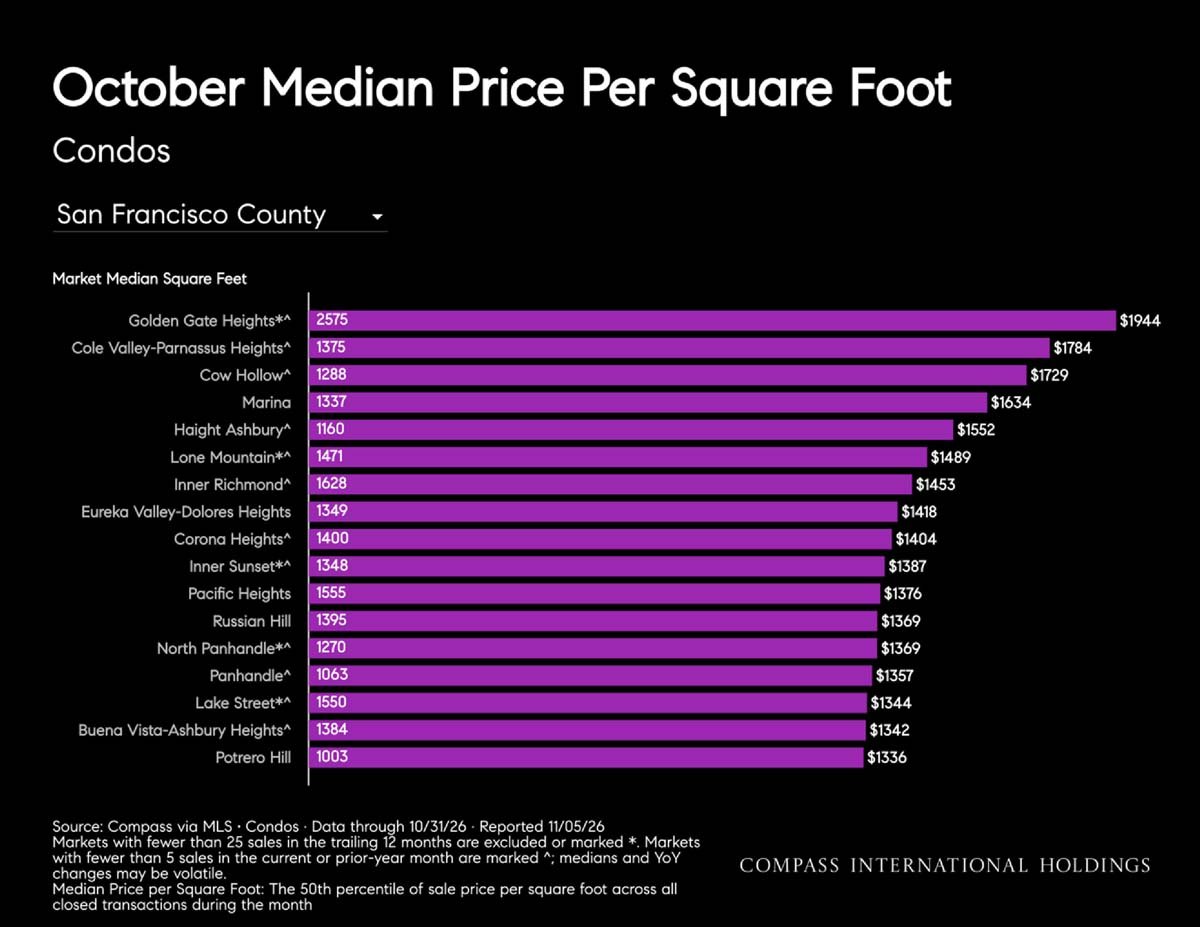
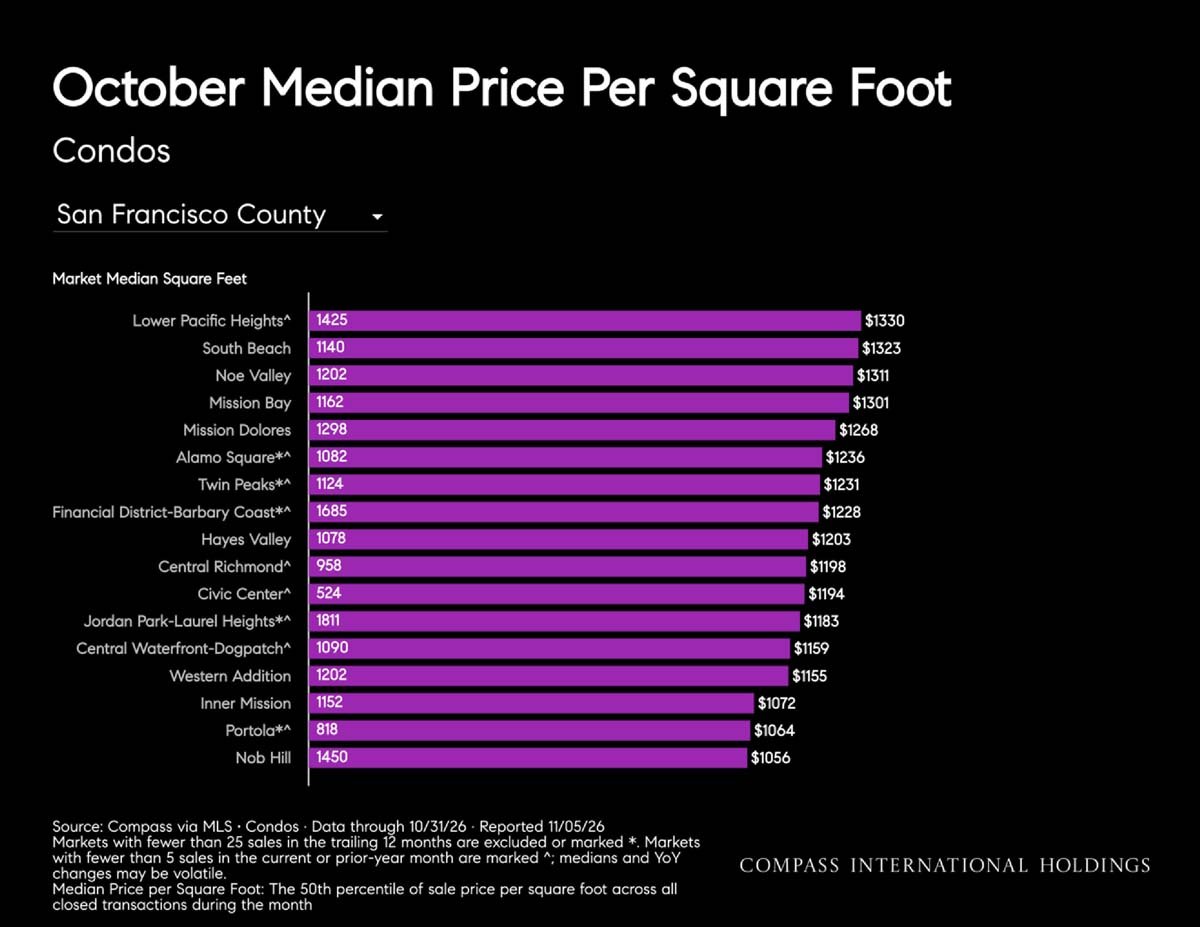
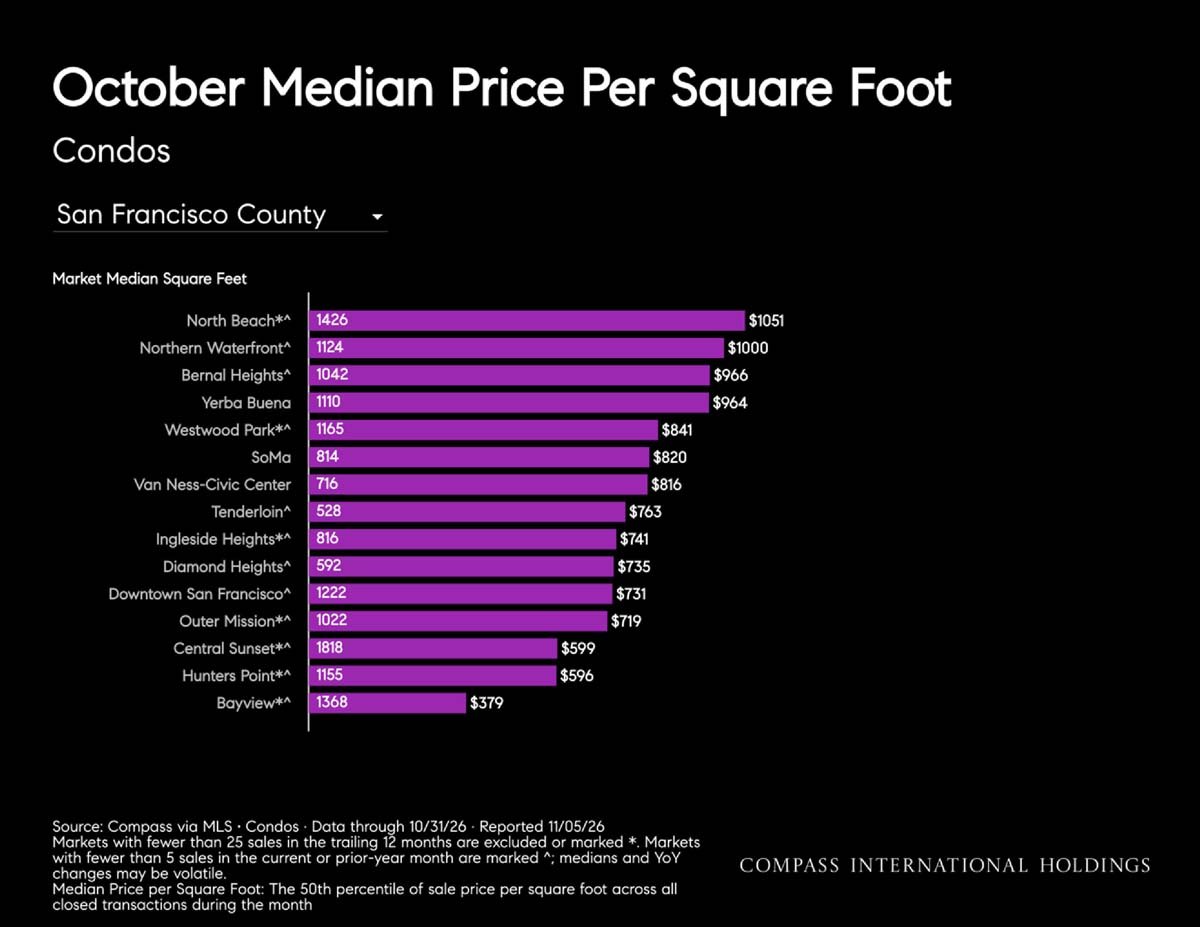
October median condo price per square foot by San Francisco neighborhood, led by Golden Gate Heights at $1,944.
October median condo price per square foot by San Francisco neighborhood.
Bar chart comparing October median condo prices per square foot across San Francisco neighborhoods.
Chart of monthly San Francisco County condo closed sales from January 2020 to October 2026.
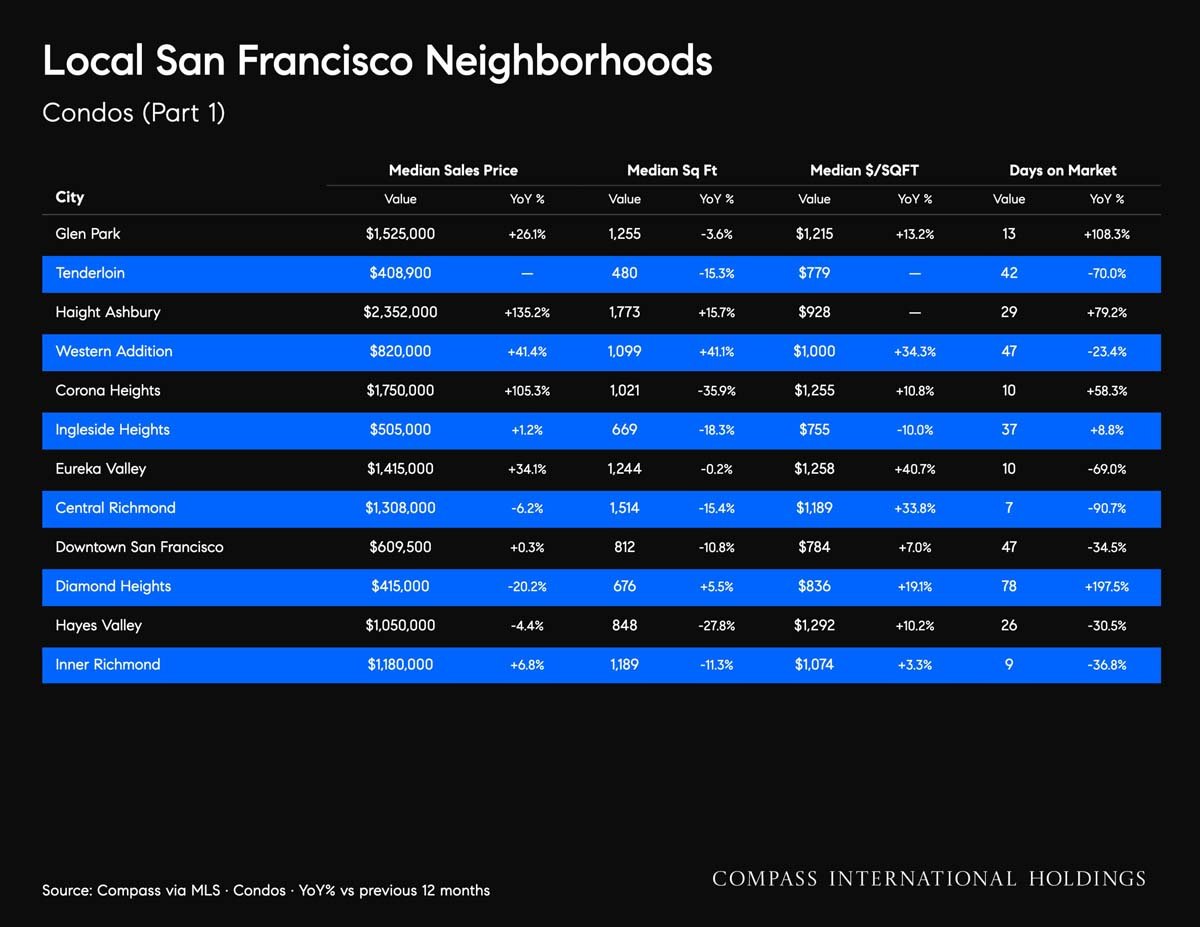
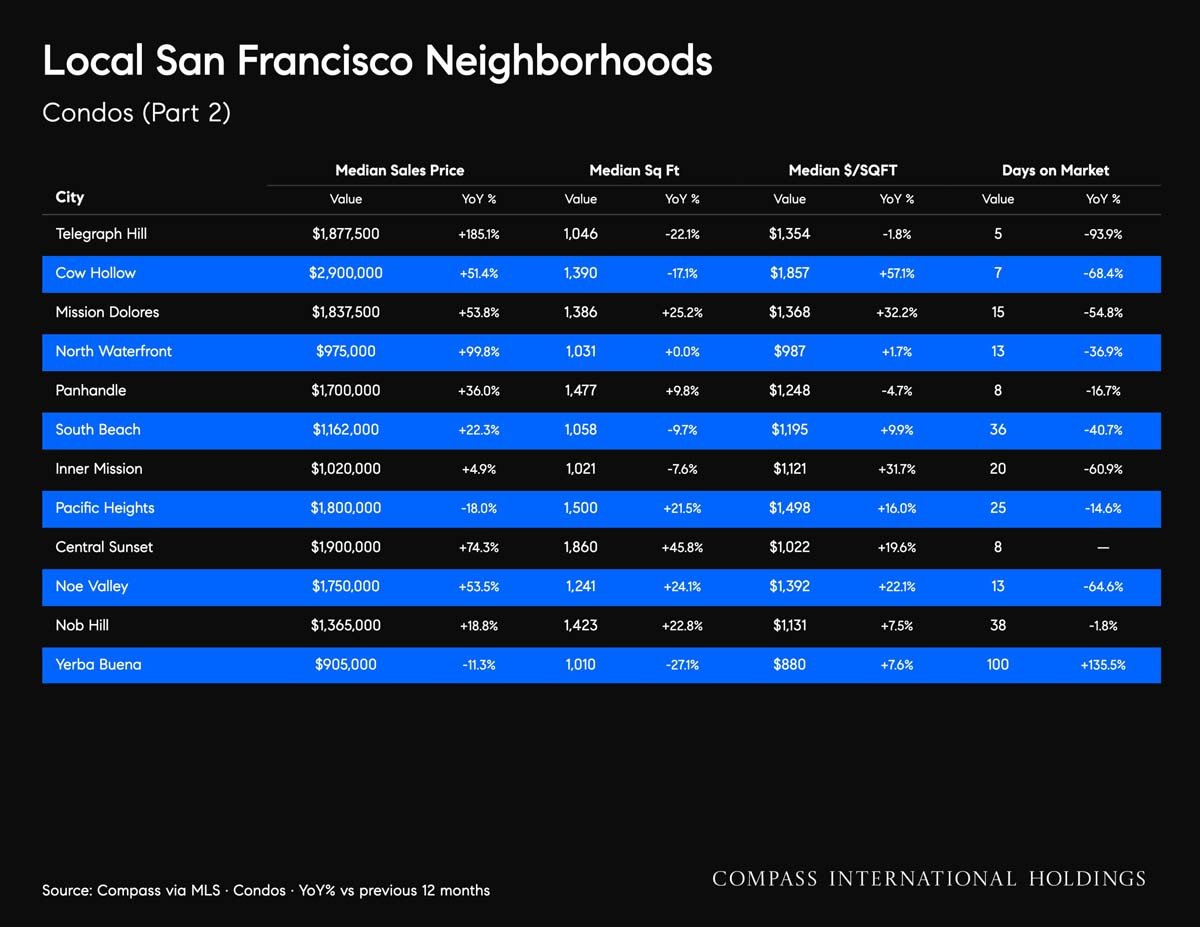
San Francisco condo market statistics by neighborhood, including prices, square footage, and days on market.
November 2026 San Francisco condo market table comparing prices, square footage, price per square foot, and days on market across neighborhoods.
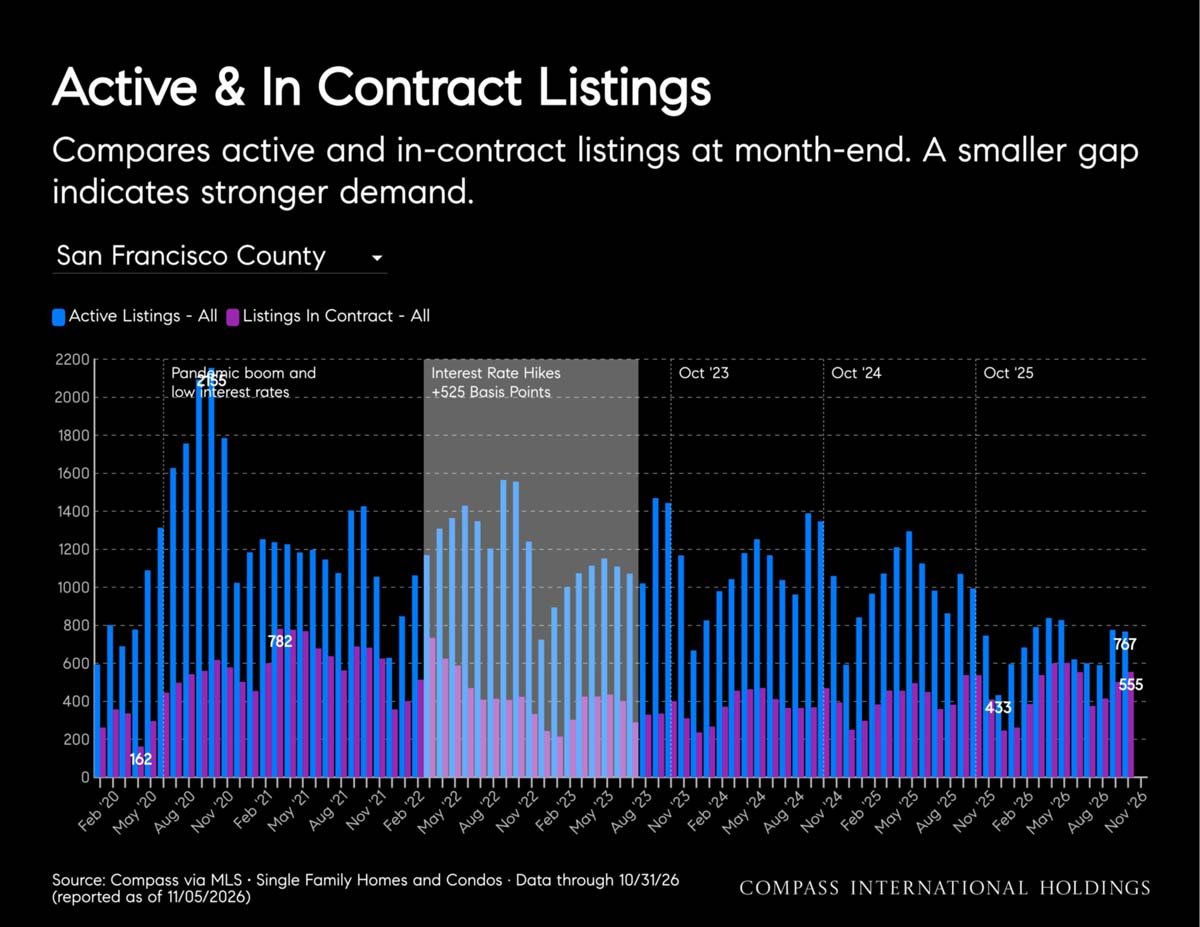
Bar chart compares San Francisco County active and in-contract listings from February 2020 to November 2026.
Price reductions
November 2026 San Francisco House & Condo Market Outlook
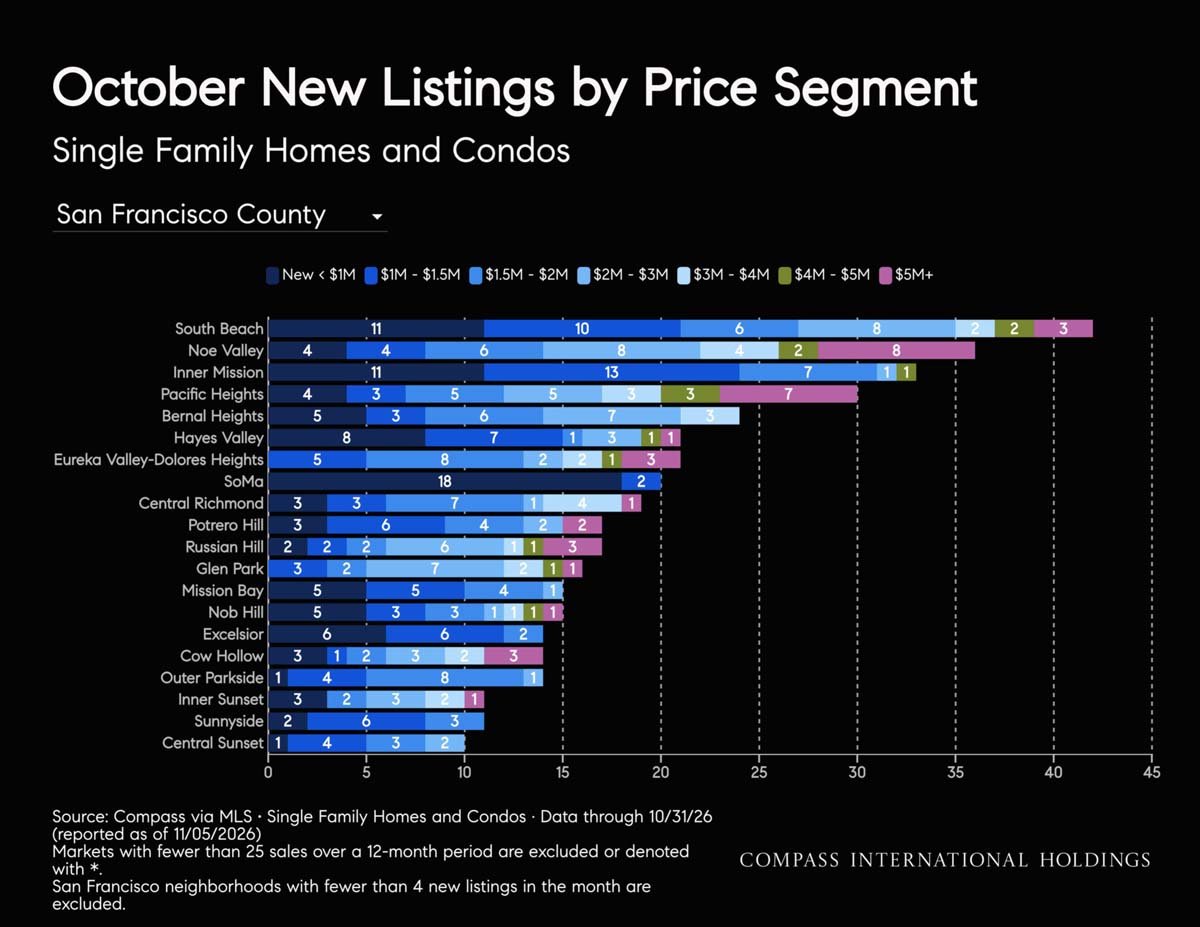
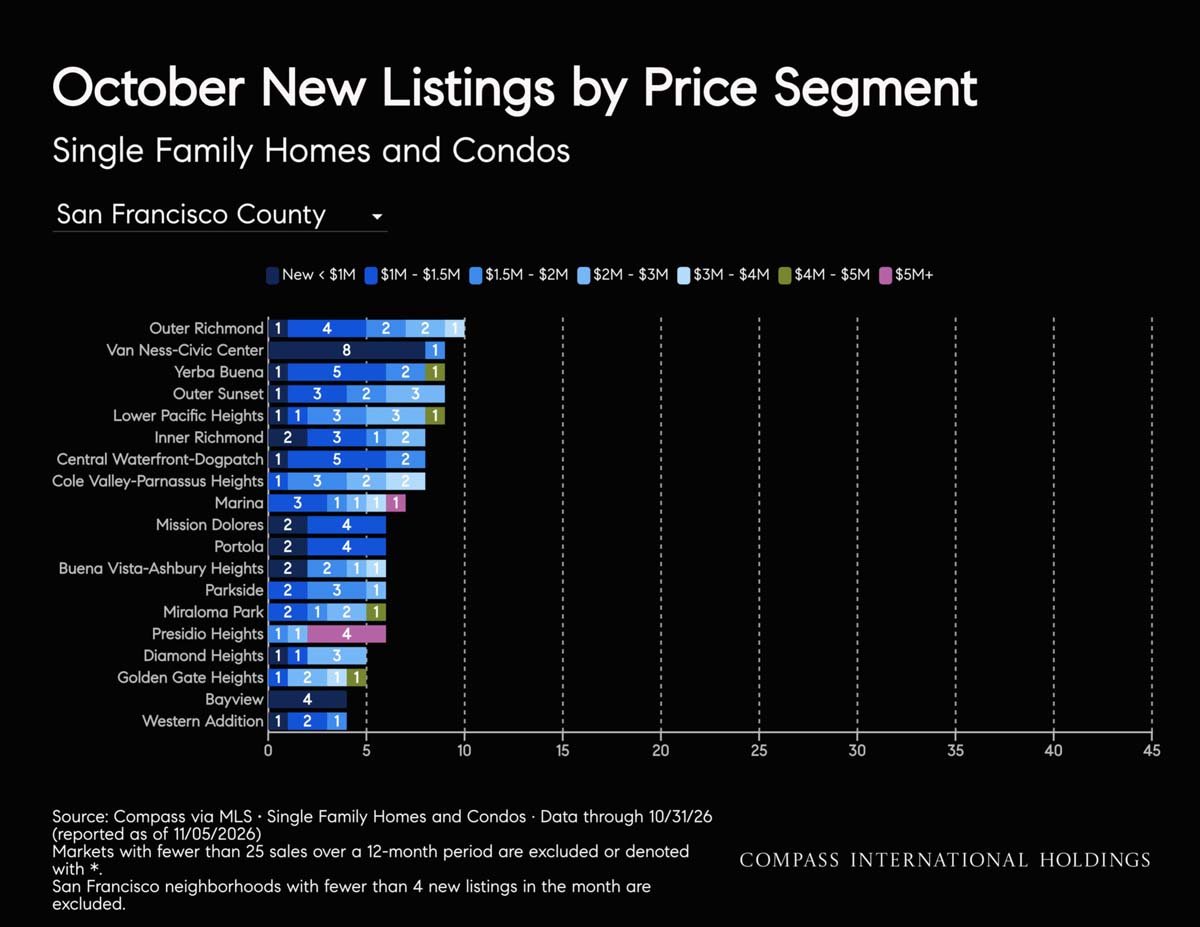
October new listings by price segment in San Francisco neighborhoods, shown as a stacked bar chart.
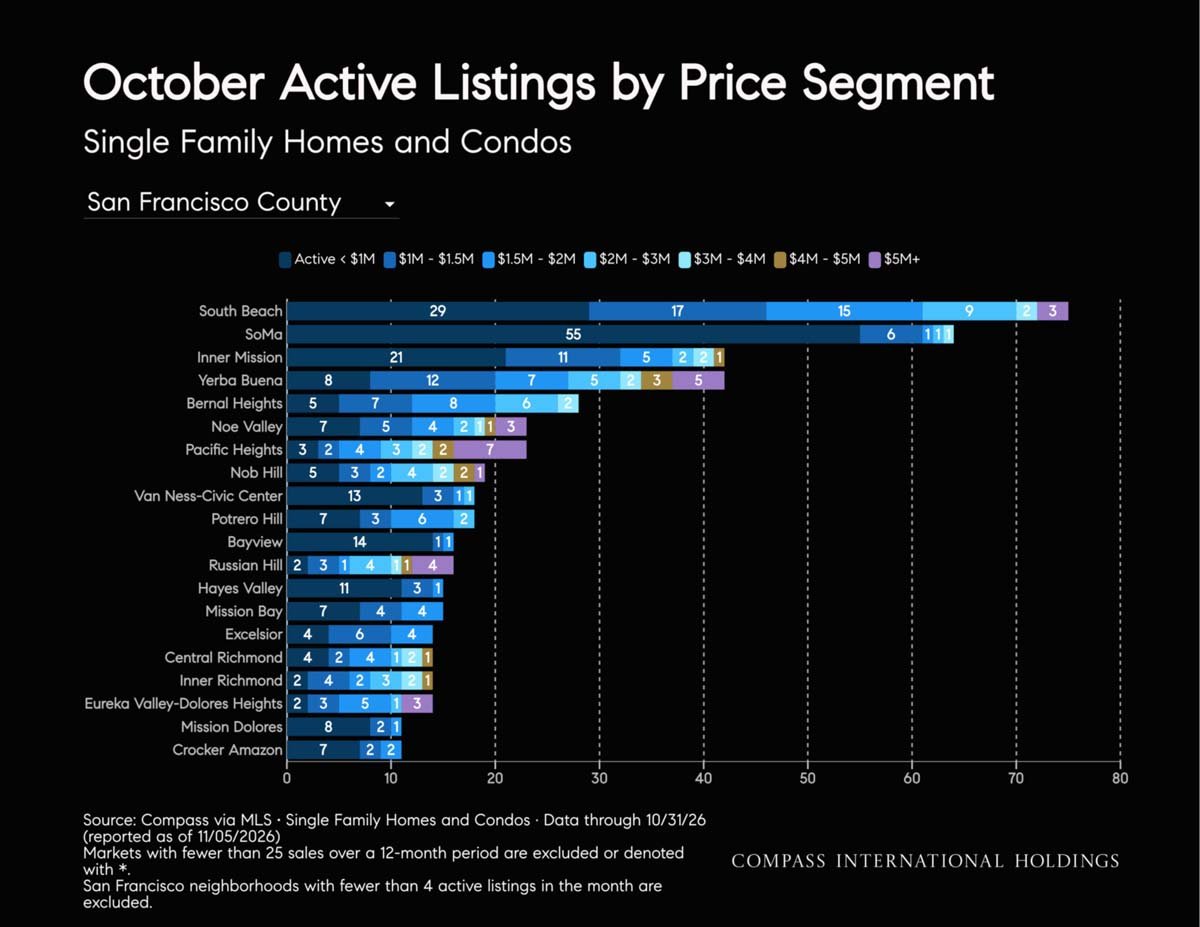
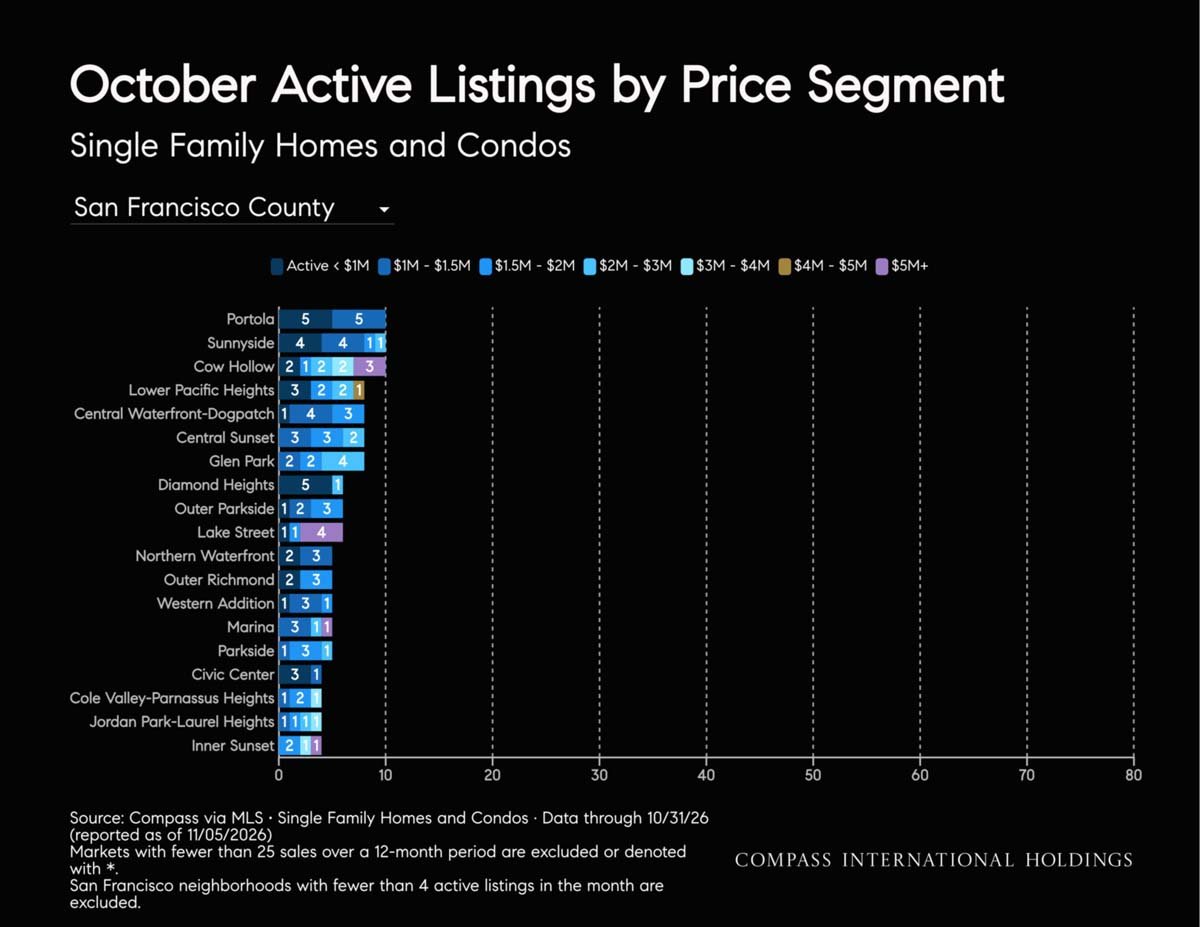
October San Francisco active listings by price segment, shown across neighborhoods for homes and condos.
October active listings by price segment in San Francisco County, shown by neighborhood and price range.
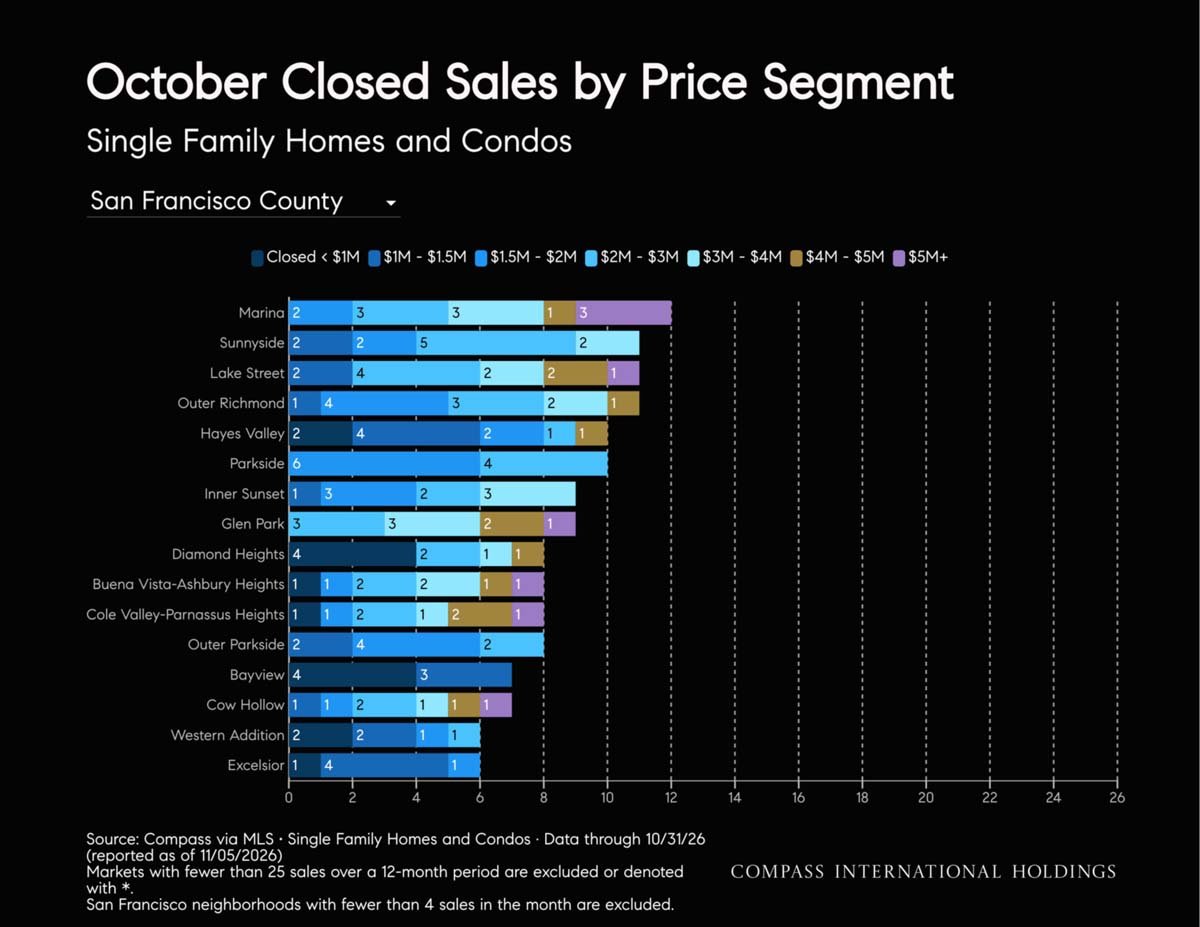
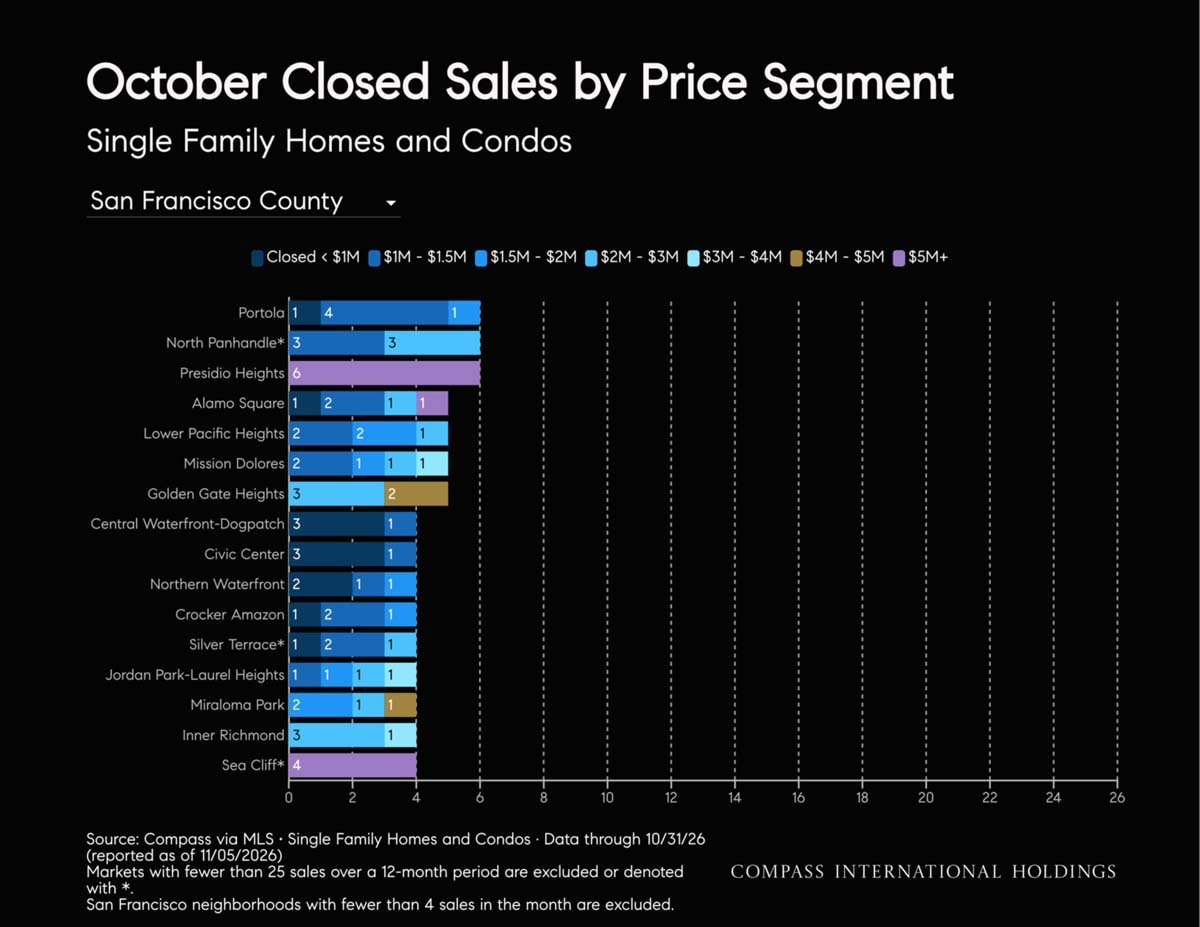
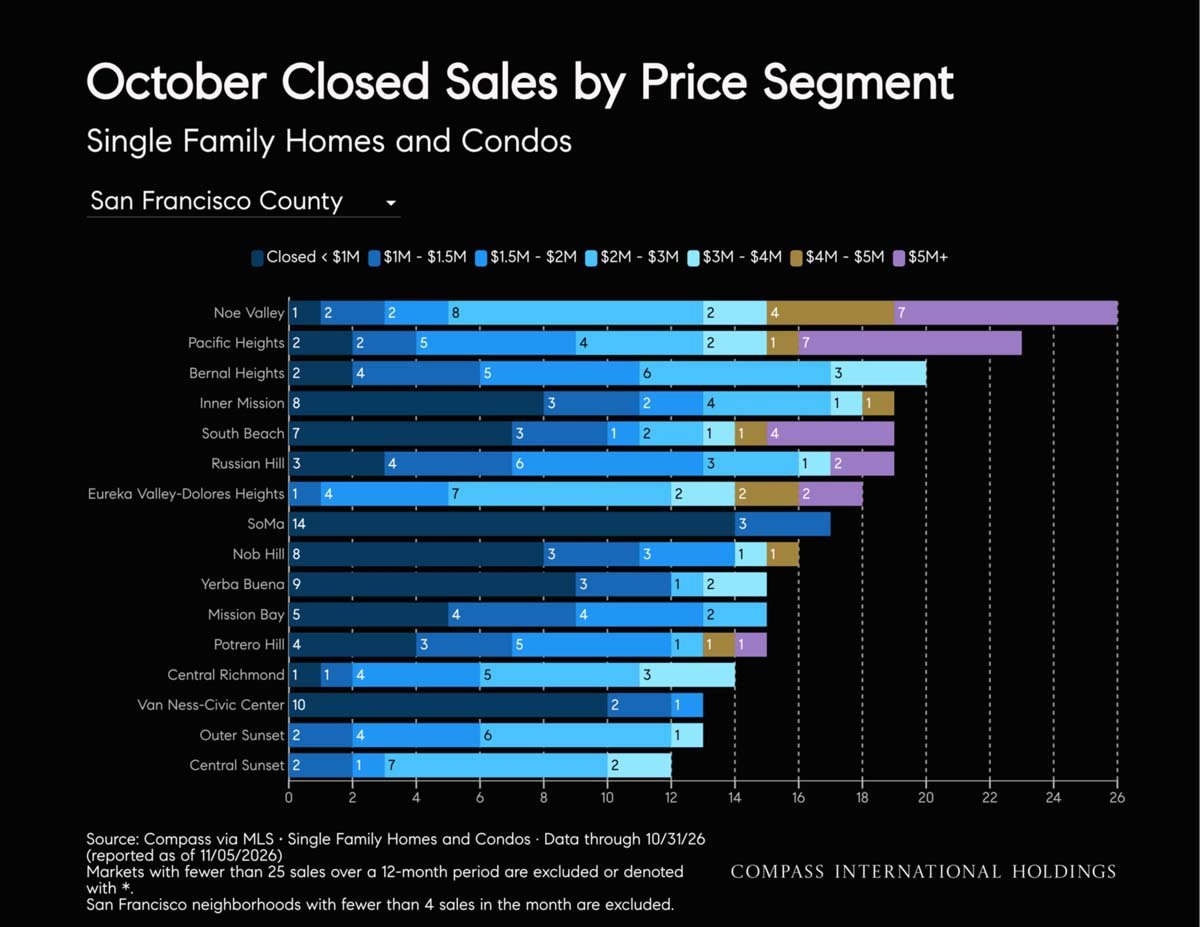
October closed home and condo sales by price segment across San Francisco neighborhoods.
Chart of October closed home and condo sales by price segment across San Francisco neighborhoods.
Stacked bar chart of October closed home and condo sales by price segment across San Francisco neighborhoods.
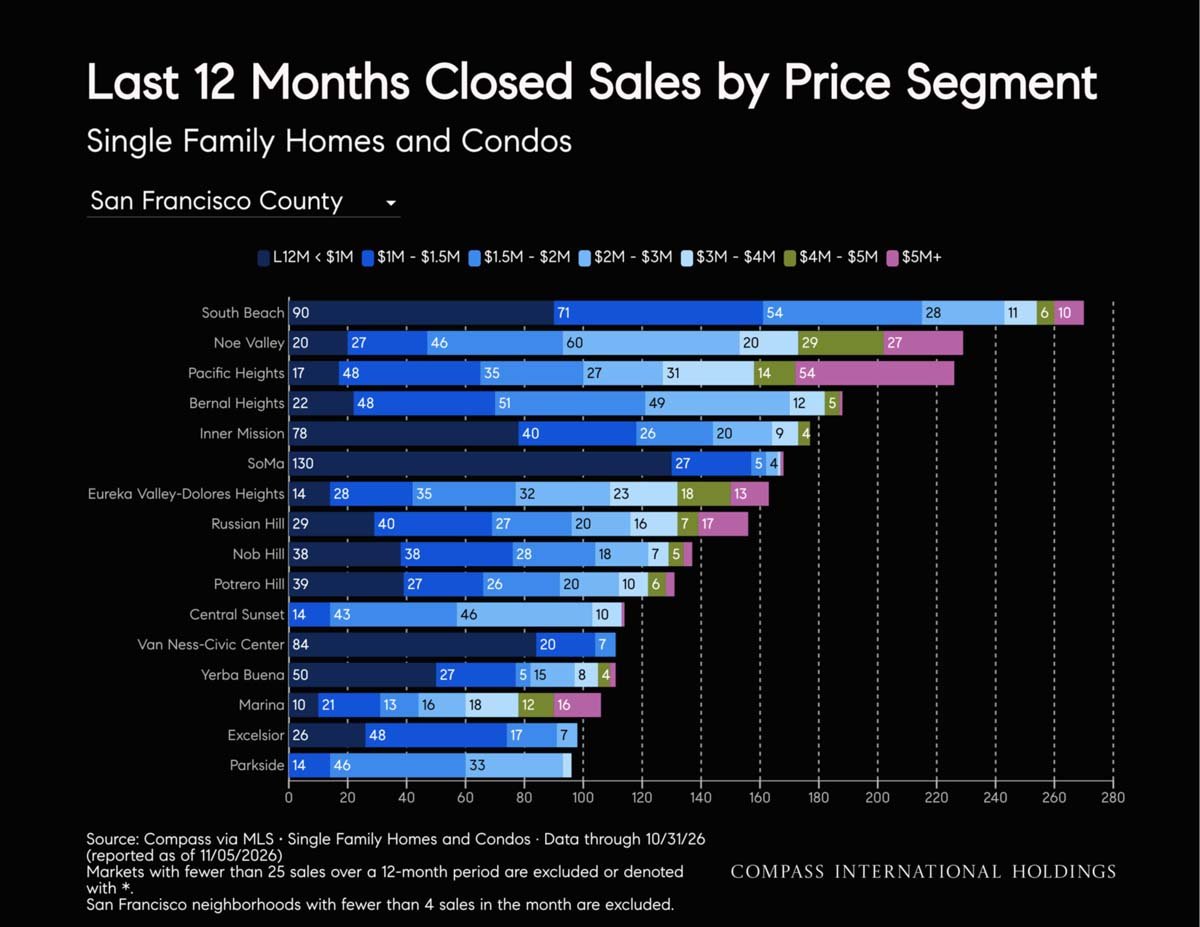
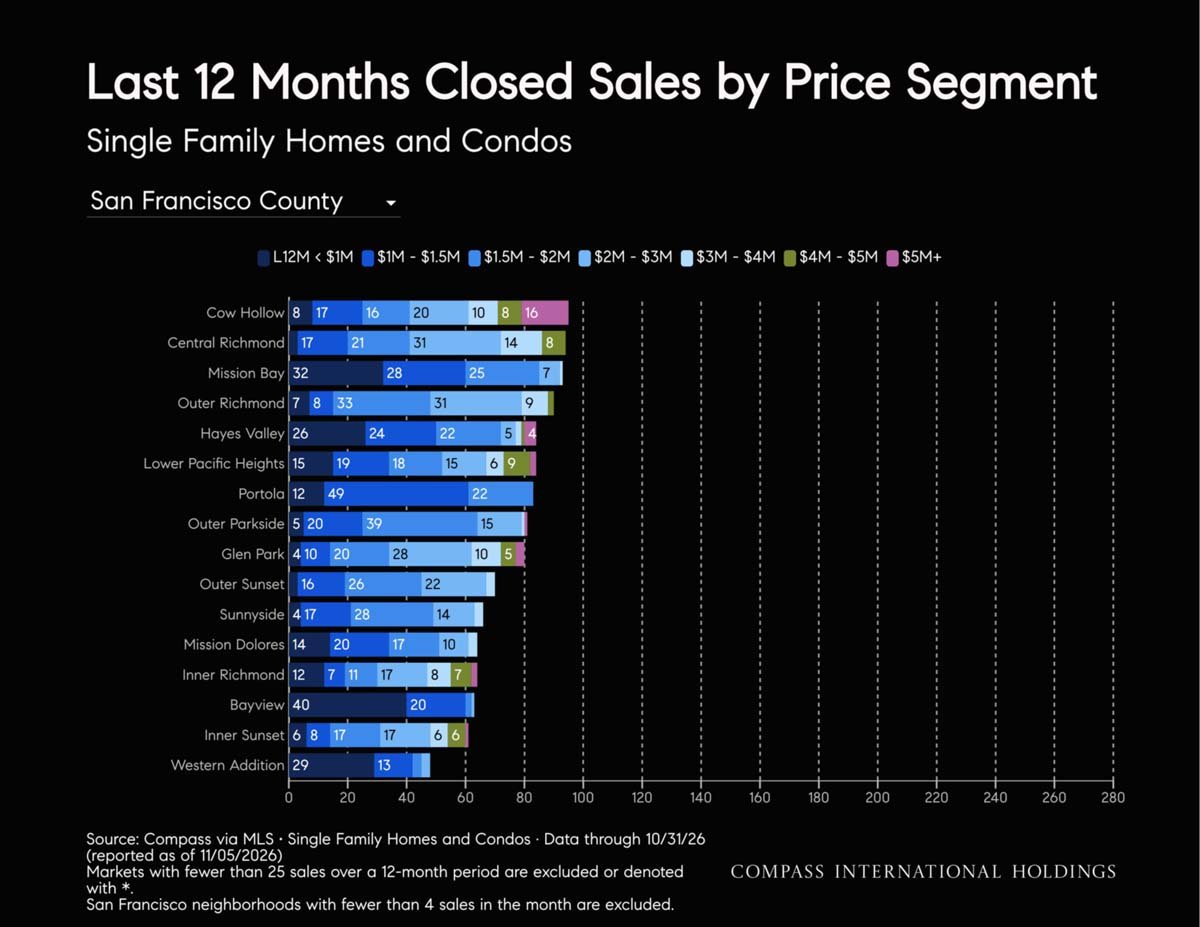
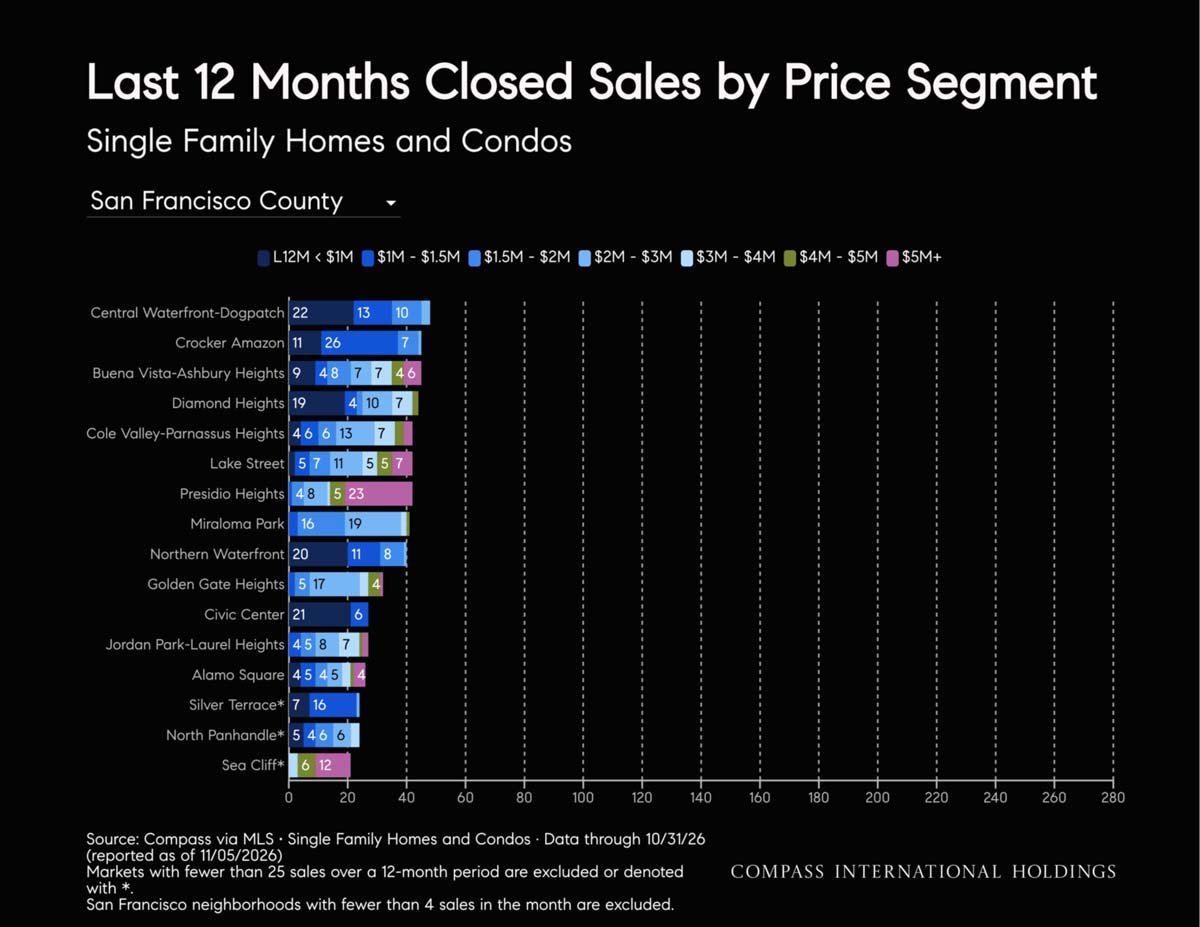
Chart of San Francisco neighborhood home and condo sales by price segment over the last 12 months.
Stacked bar chart of 12 months of San Francisco neighborhood home and condo sales by price segment.
Stacked bar chart of San Francisco neighborhood home and condo sales by price segment over the last 12 months.
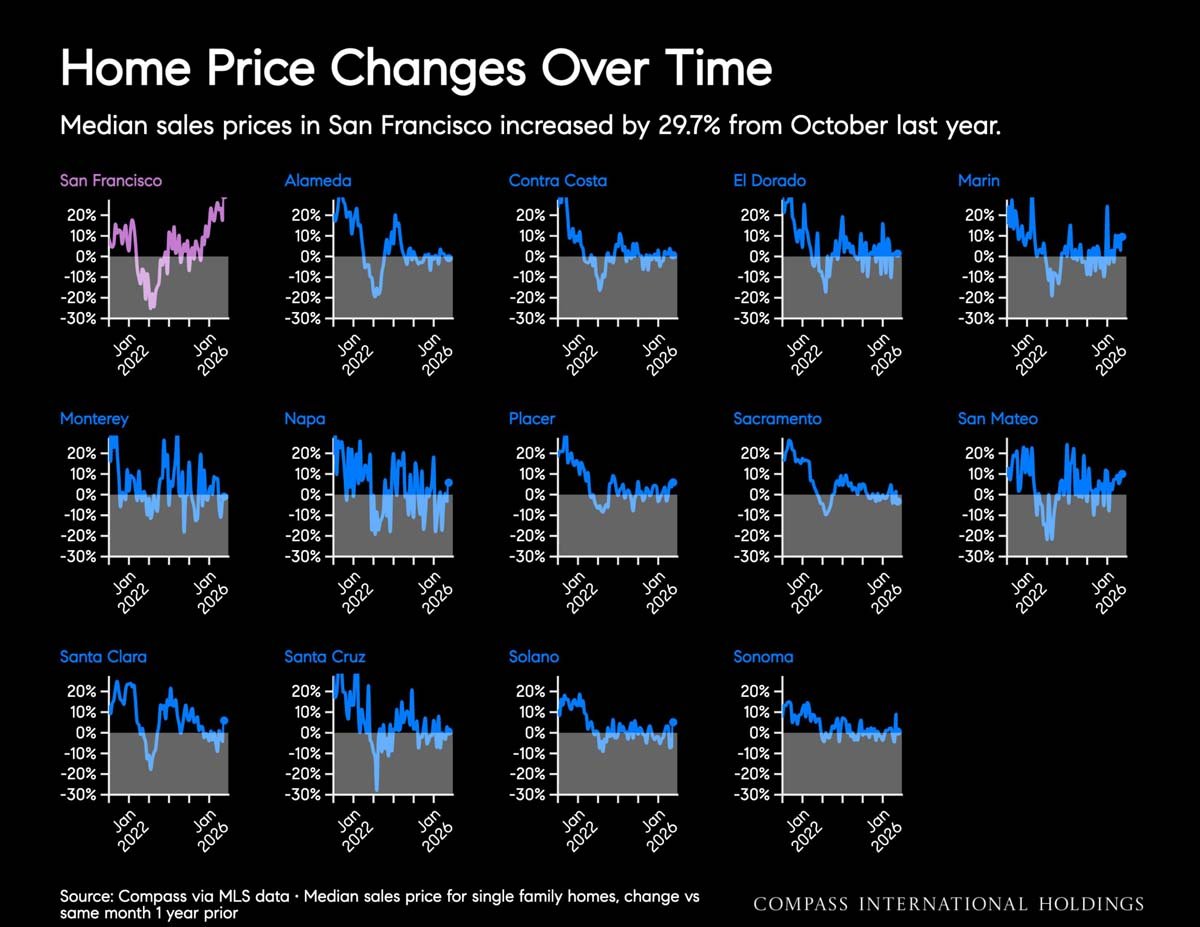
Chart comparing home price changes over time across San Francisco and surrounding counties.
November 2026 Northern California Housing Market Report
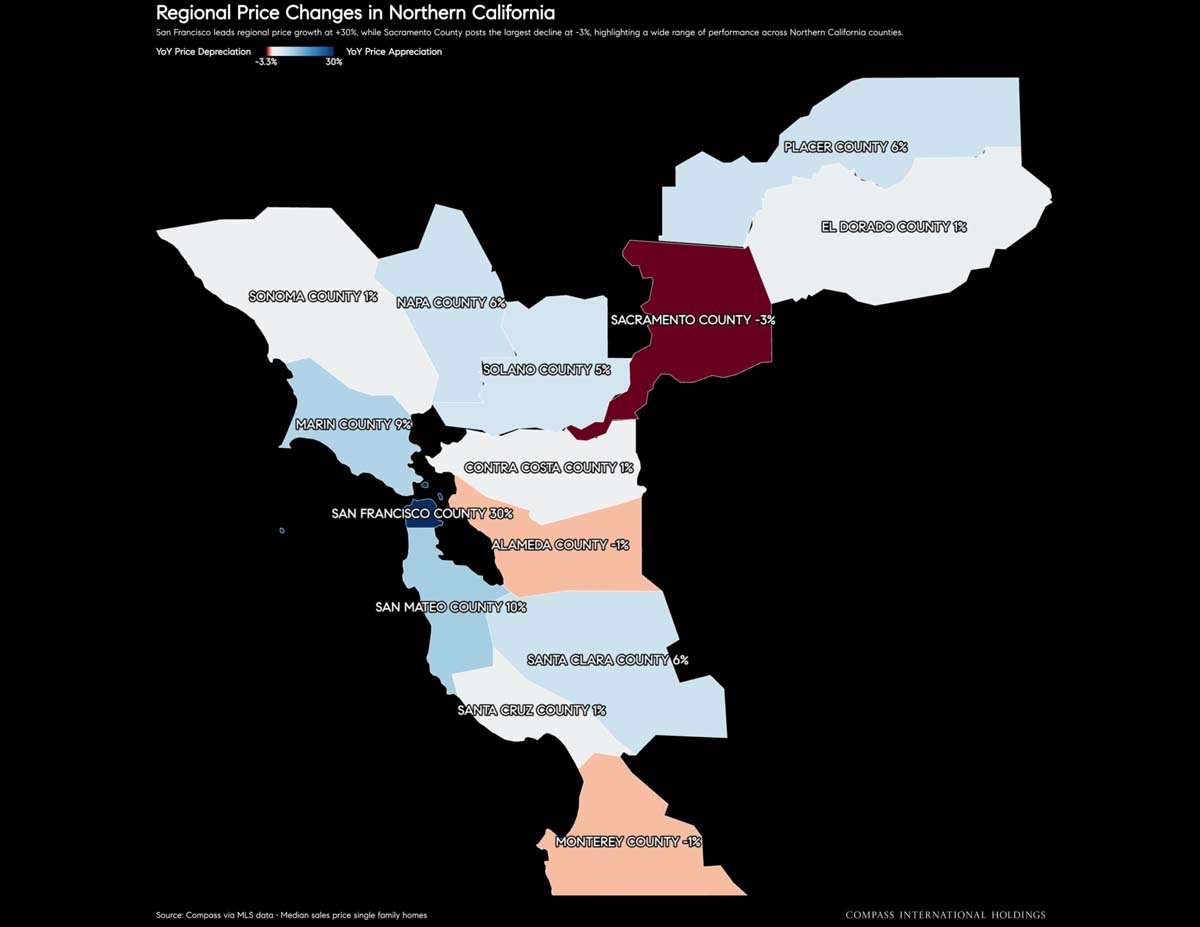
Map of Northern California counties labeled with year-over-year home price changes.
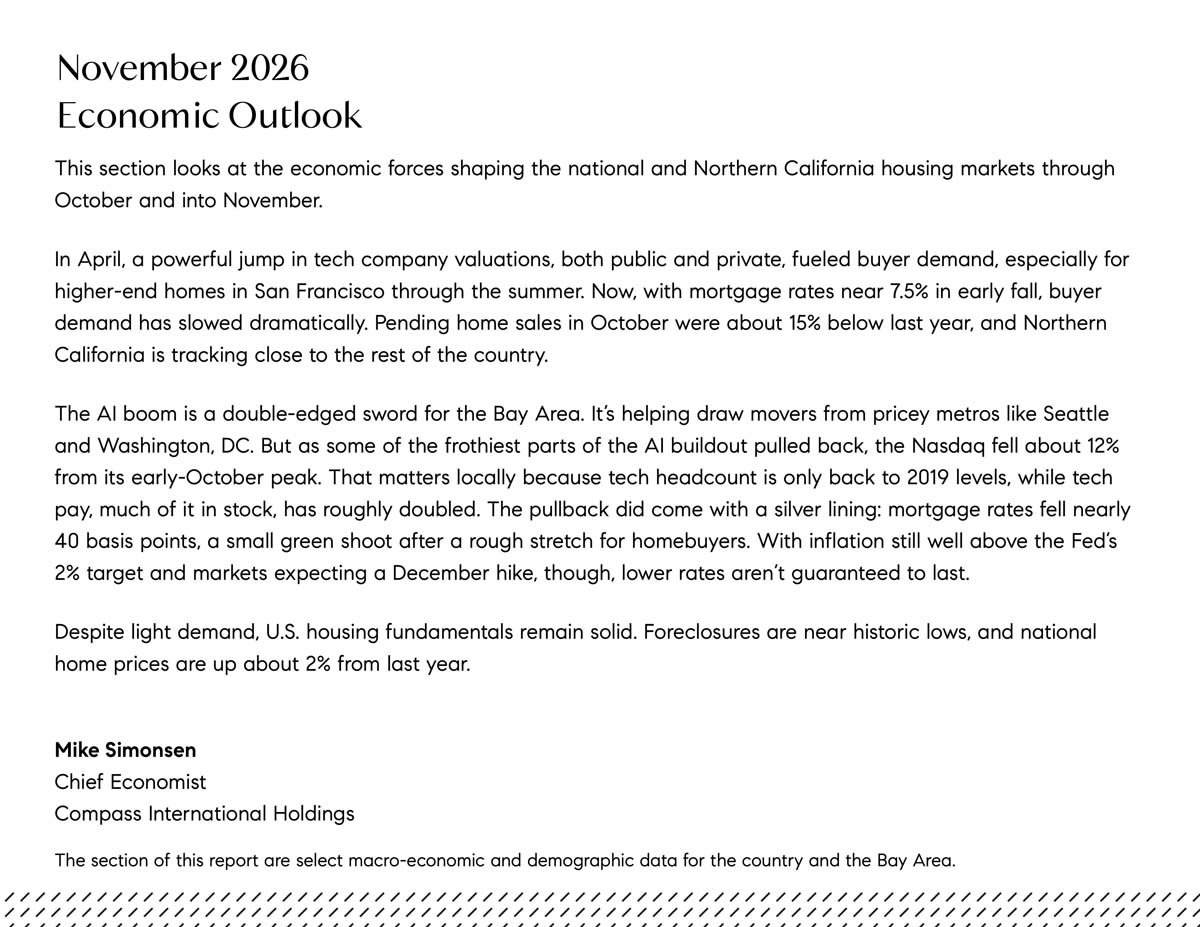
November 2026 economic outlook discussing housing demand, mortgage rates, and Bay Area market conditions.
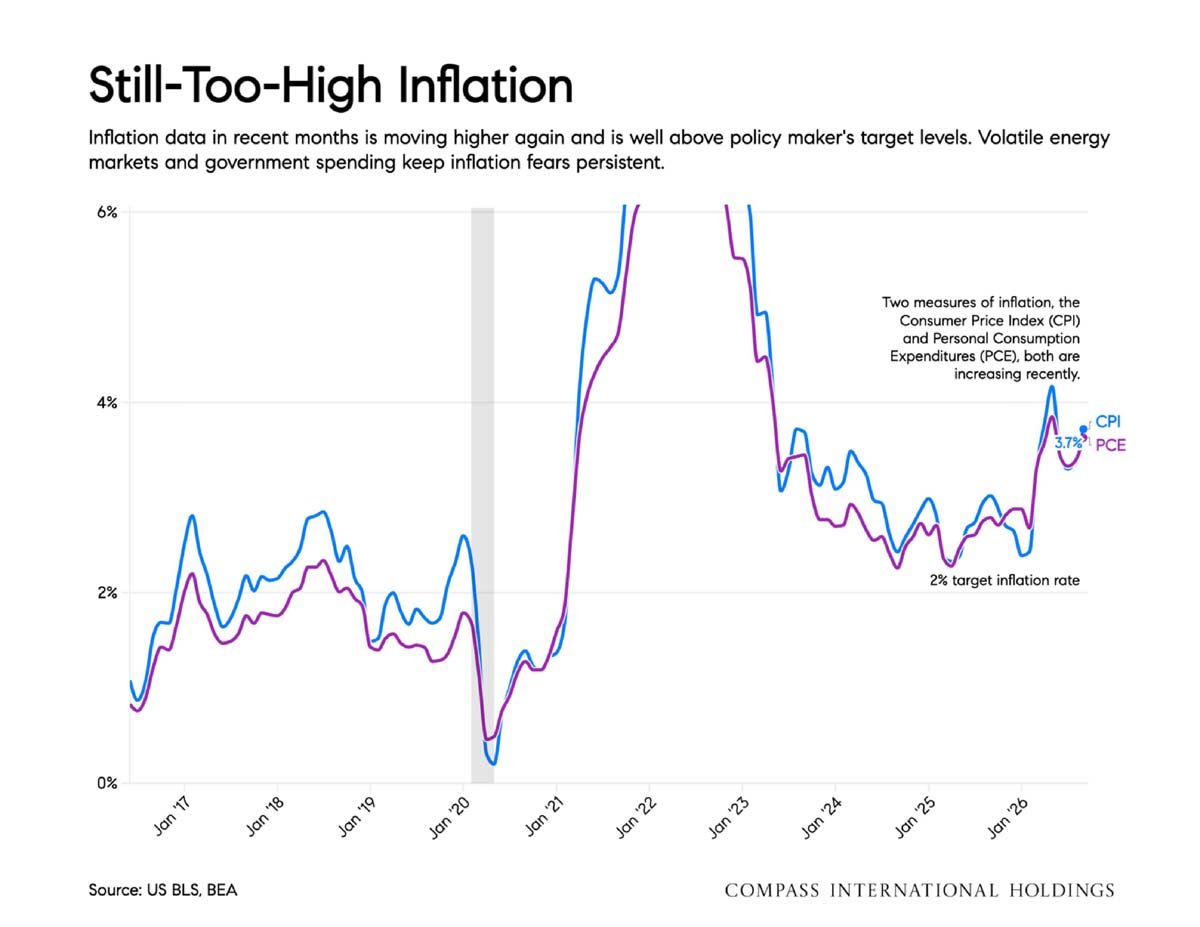
Inflation chart comparing CPI and PCE from 2017 through 2026, with both measures rising to about 3.7%.
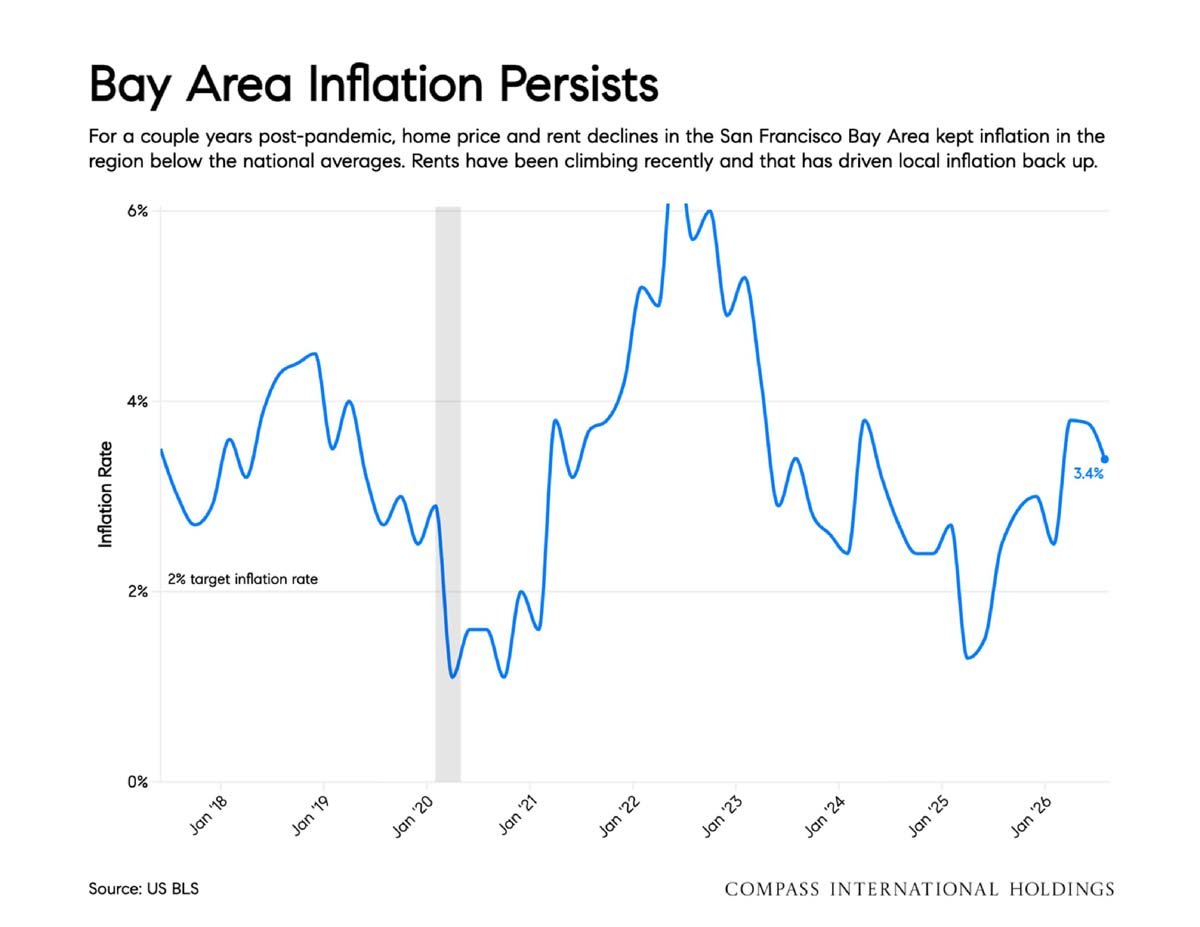
Bay Area inflation chart showing annual rates from 2017 to 2026, ending at 3.4%.
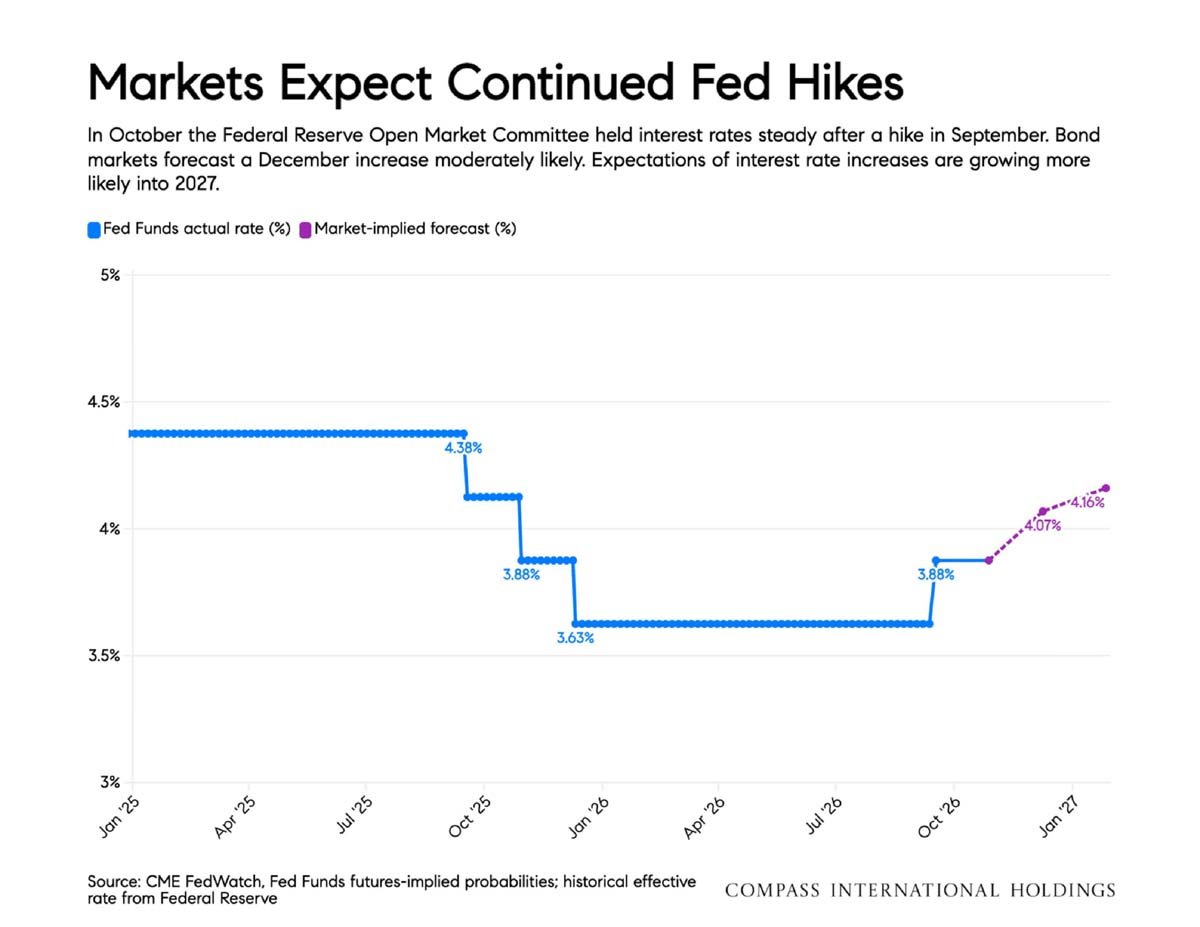
Chart showing actual and market-forecast Federal Funds rates, with hikes projected through January 2027.
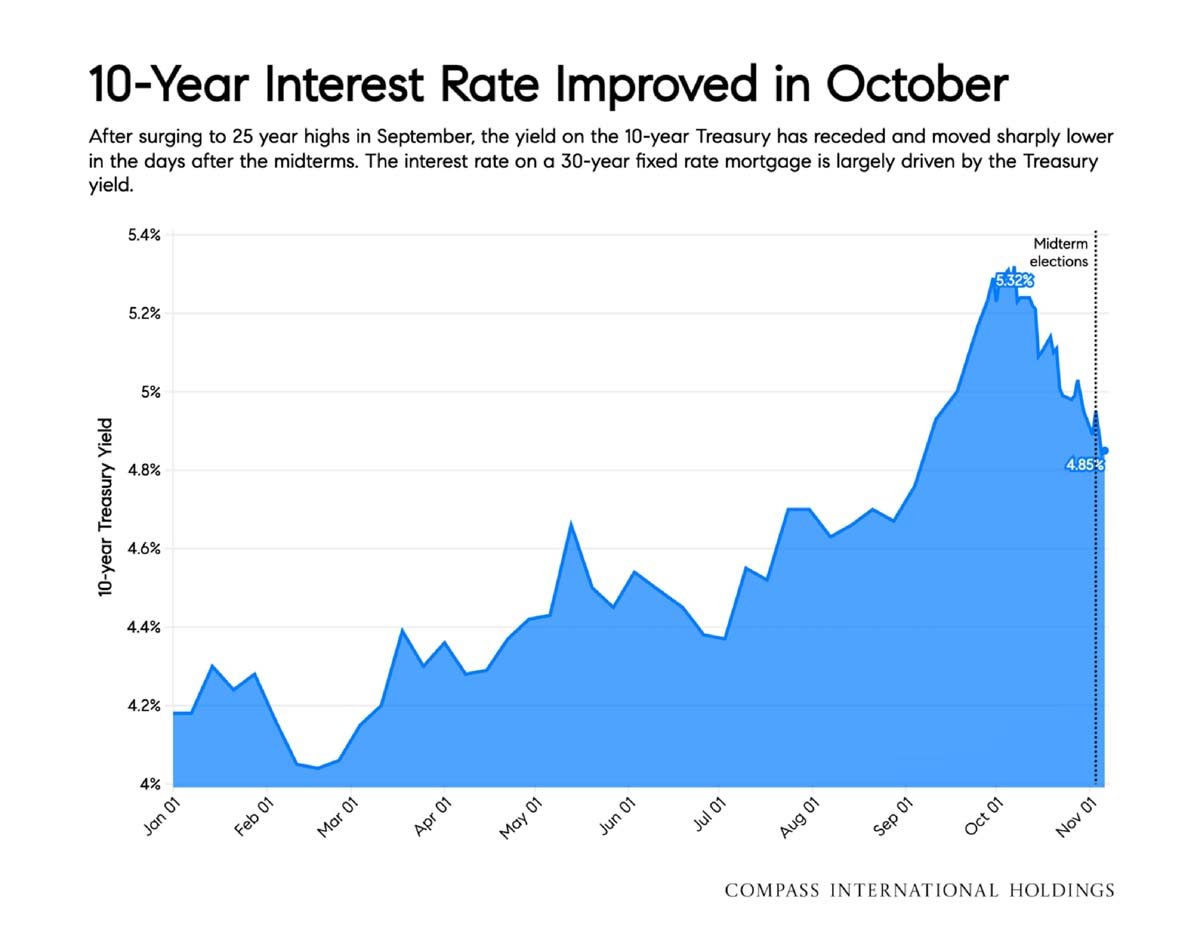
Chart showing the 10-year Treasury yield falling from 5.32% in October to 4.85% in November.
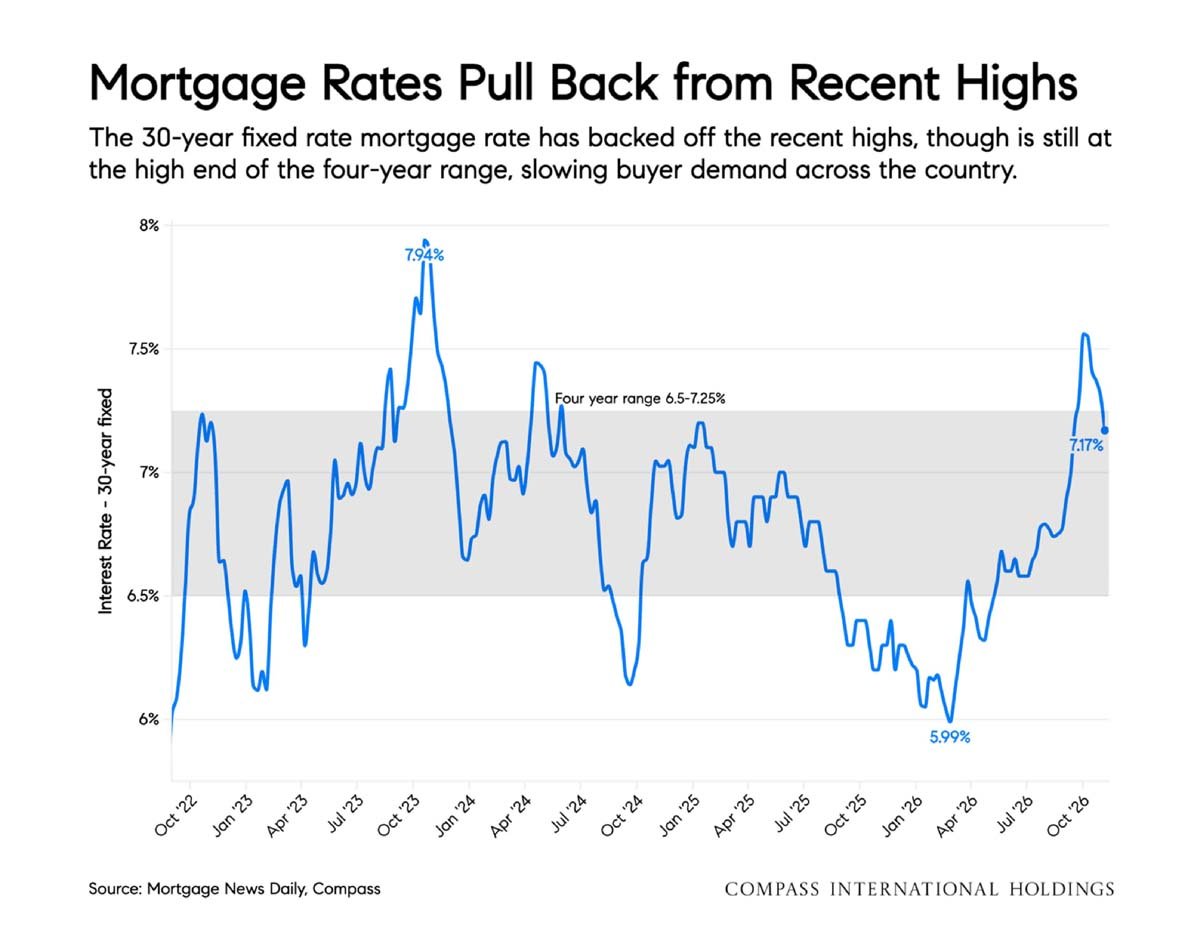
Mortgage rates pull back from recent highs; chart shows 30-year fixed rates from October 2022 to October 2026.
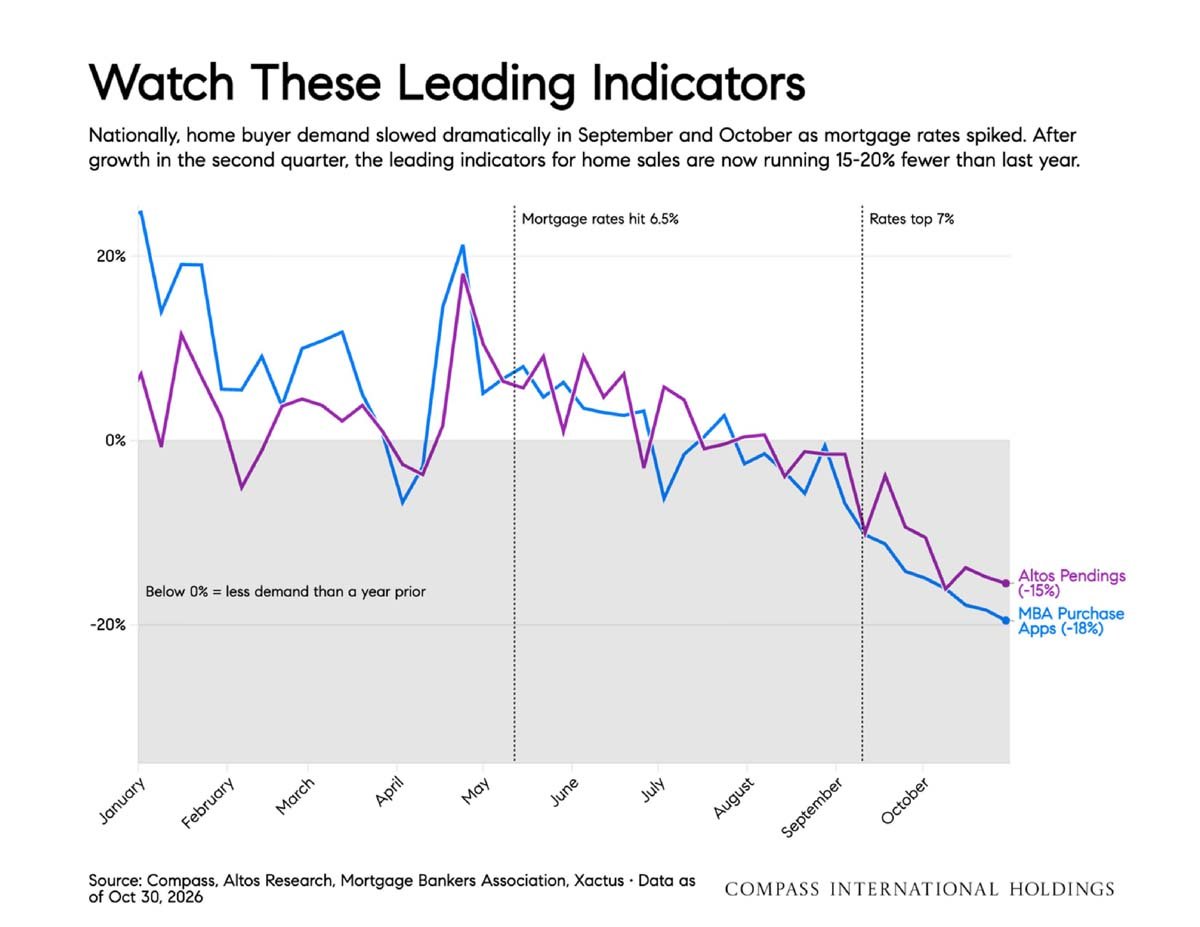
Chart showing declining national homebuyer demand indicators from January through October 2026.
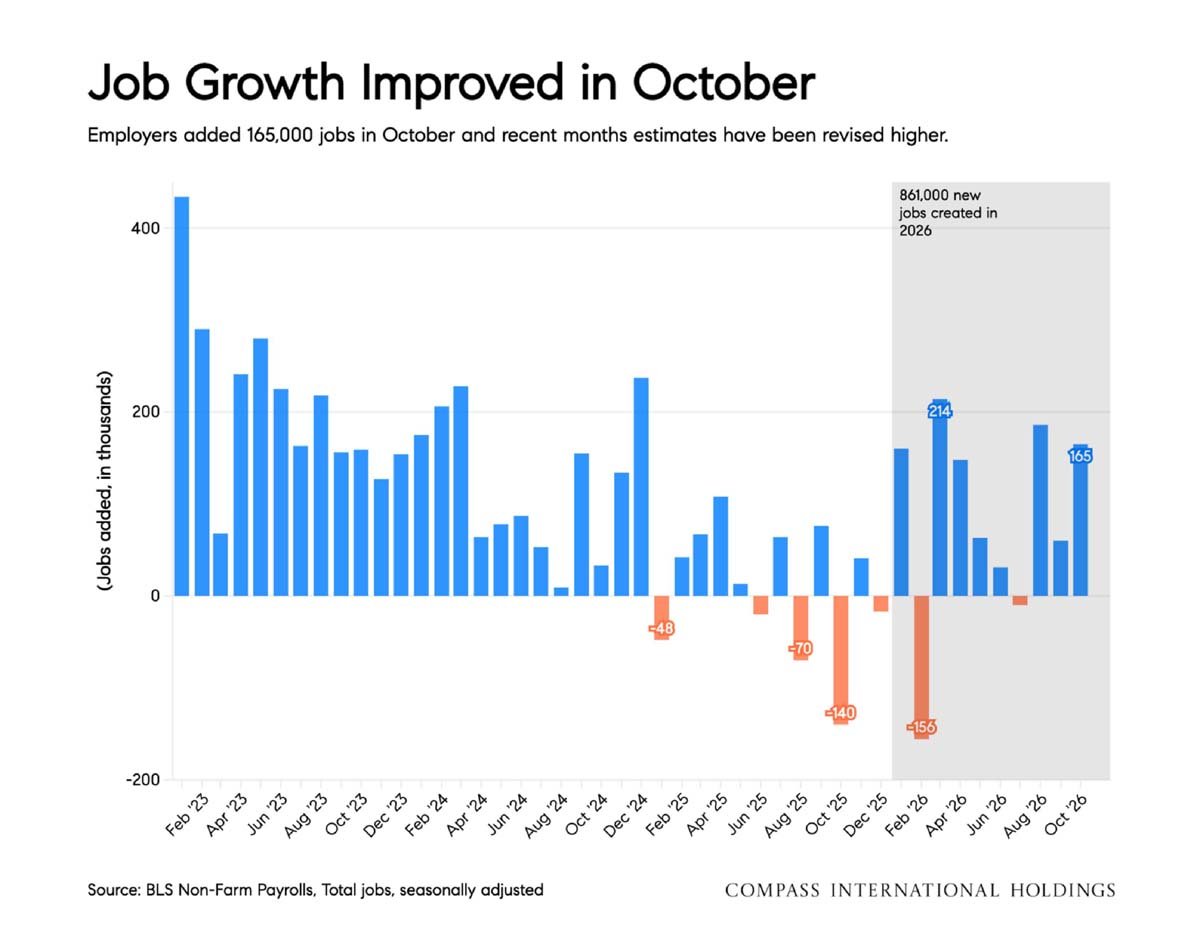
Bar chart showing monthly U.S. job growth from February 2023 to October 2026, with 165,000 jobs added in October.
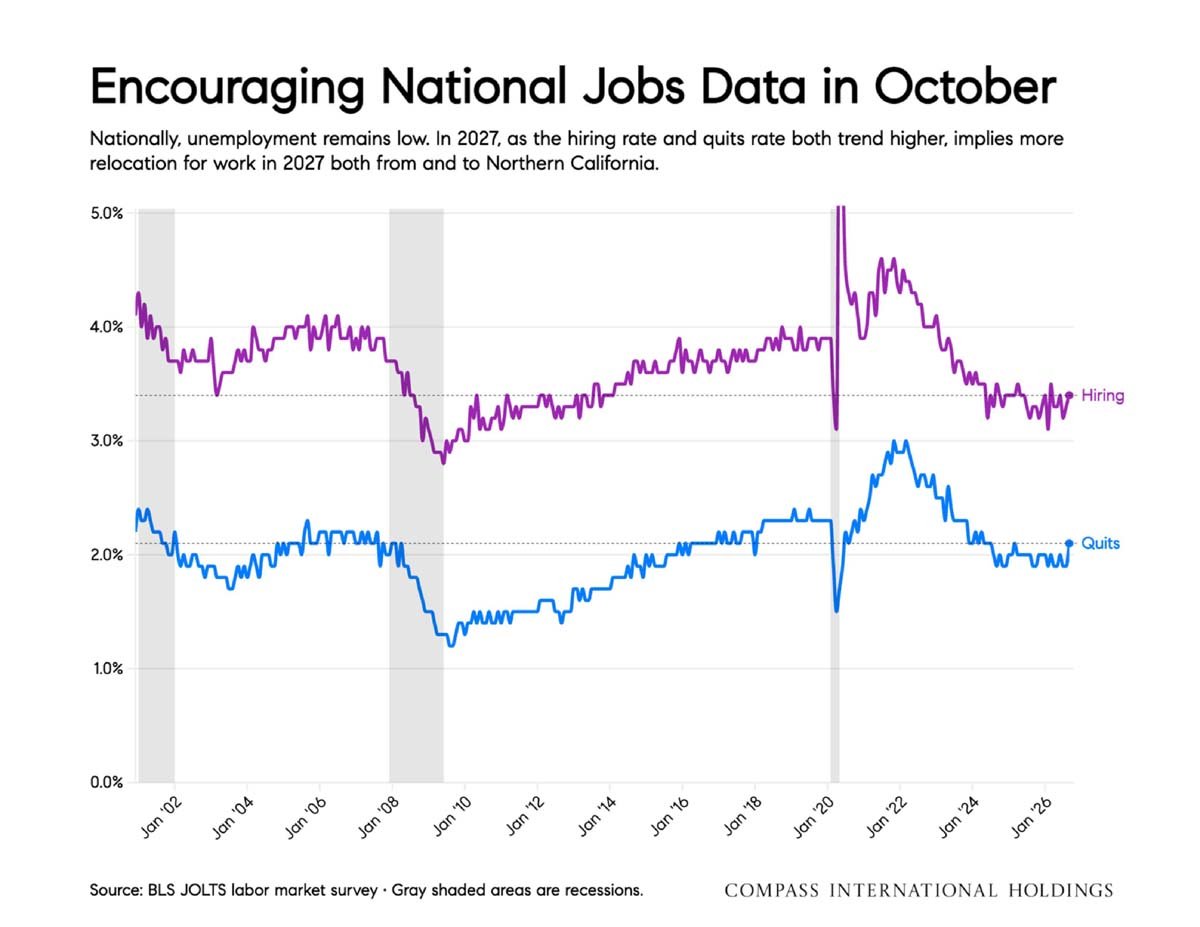
Line chart comparing national hiring and quits rates from 2001 to 2026.
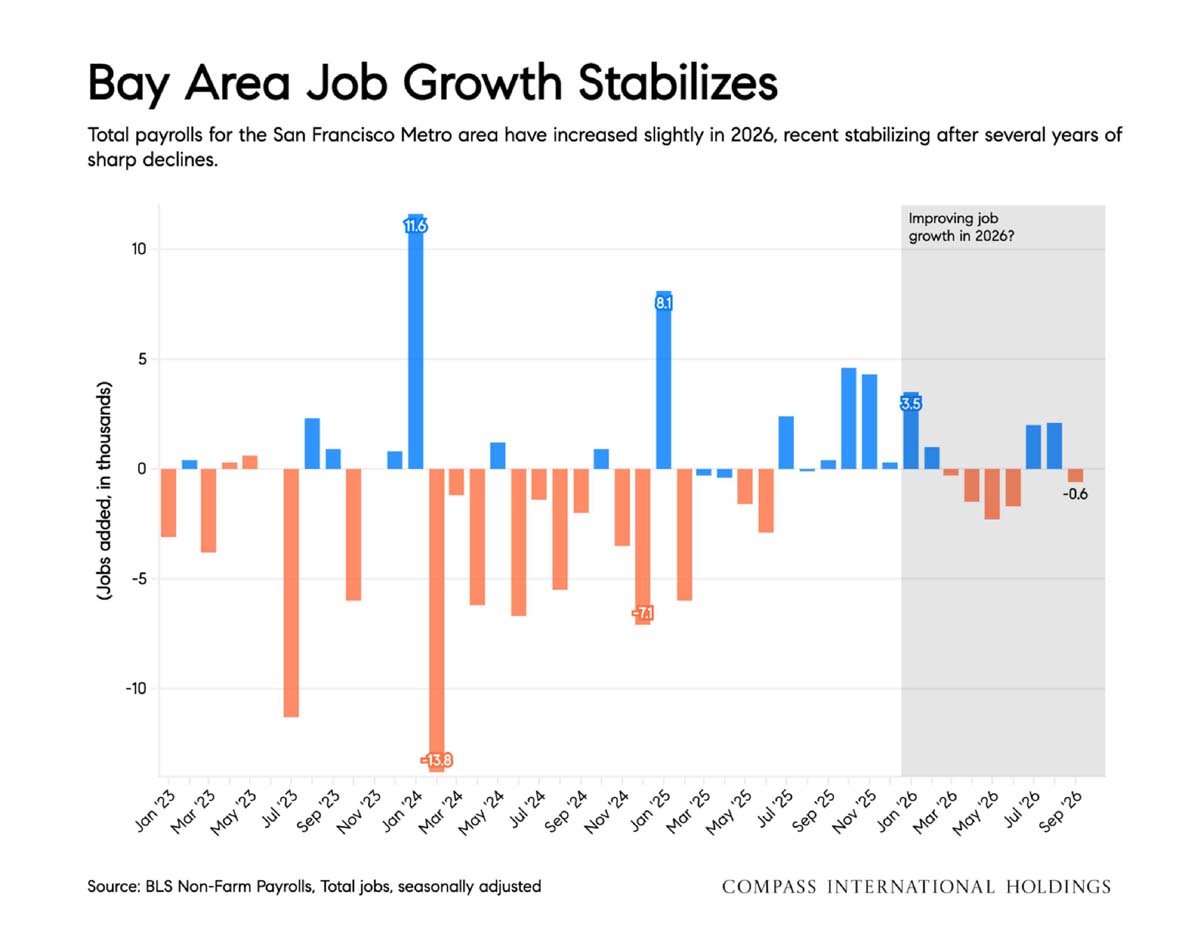
Chart showing Bay Area job growth stabilizing in 2026 after several years of declines.
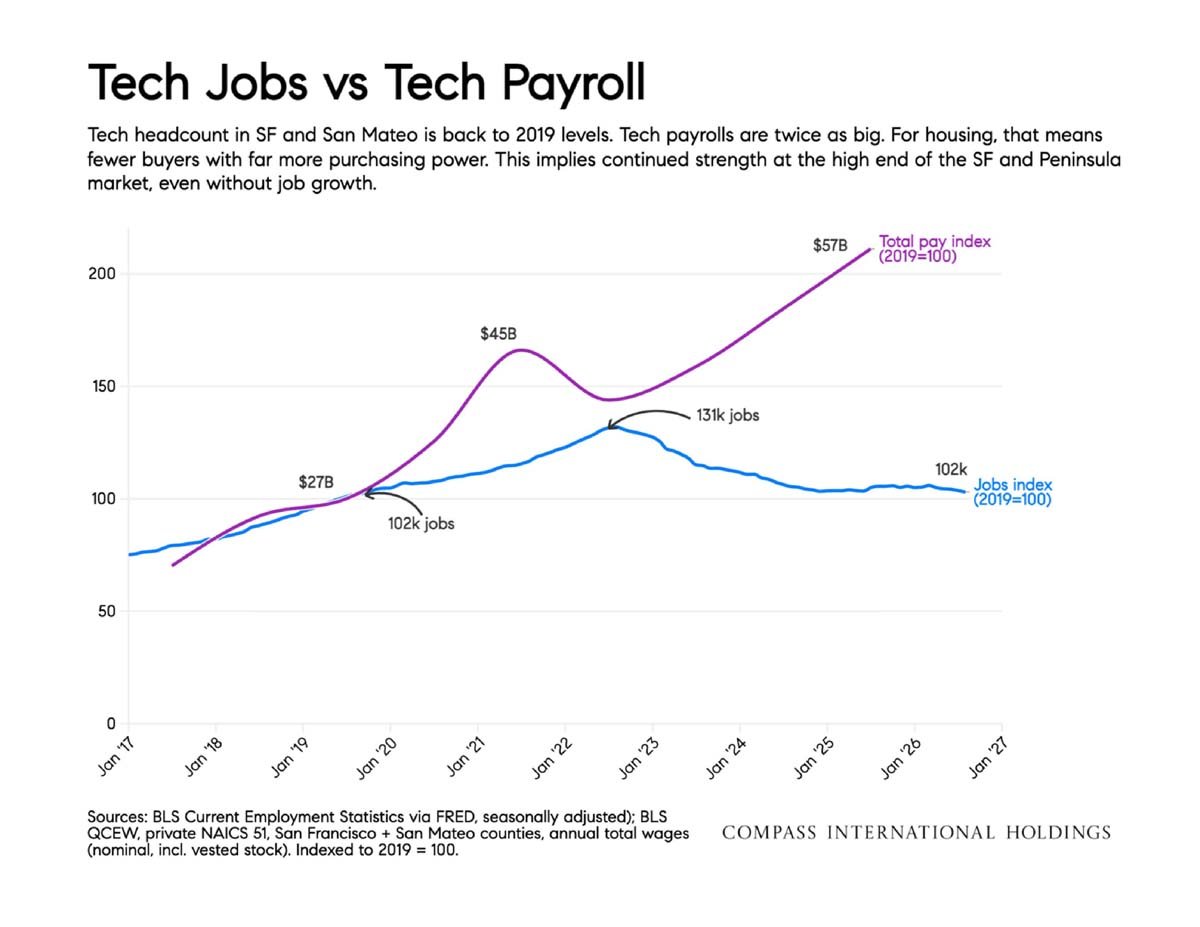
Chart comparing San Francisco and San Mateo tech jobs and payroll from 2017 to 2027.
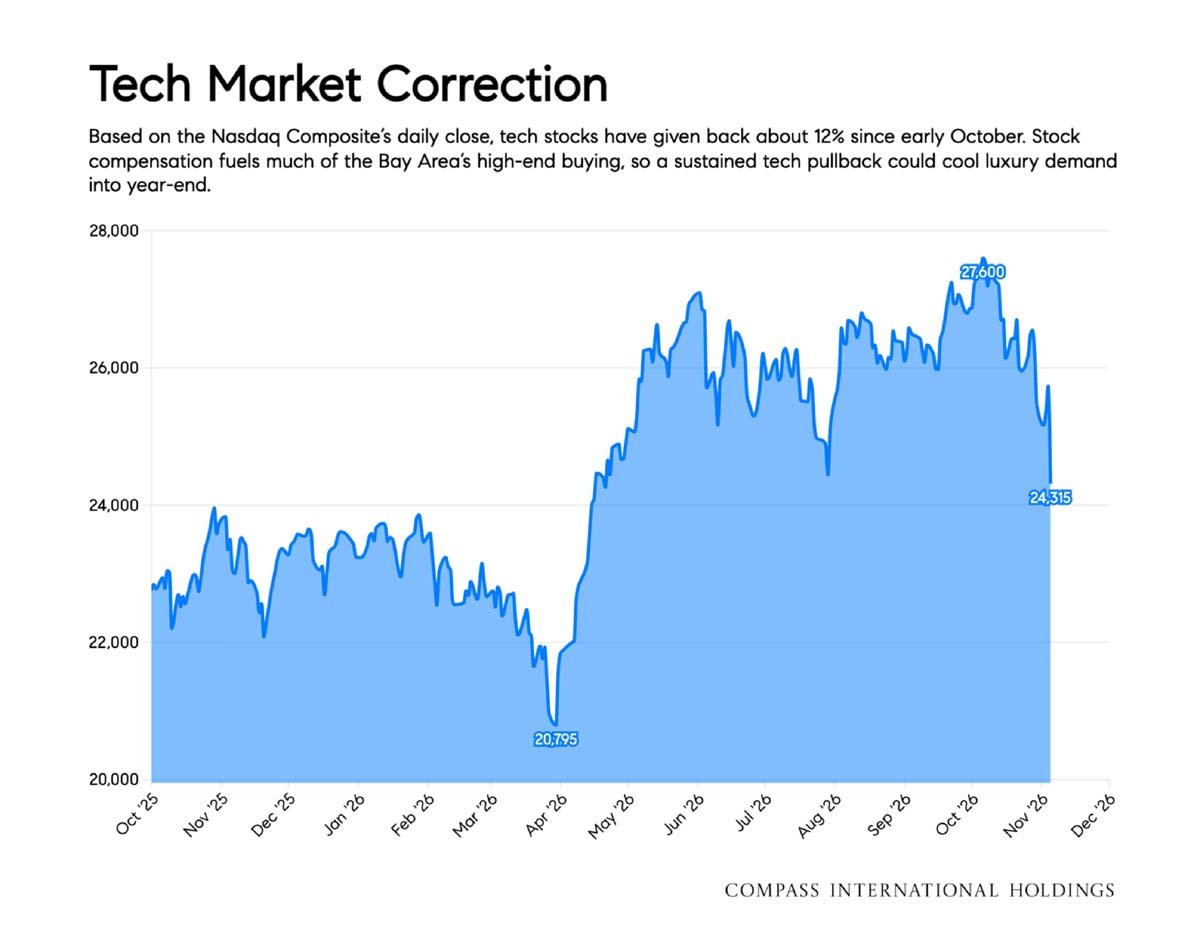
Area chart shows the Nasdaq Composite falling to 20,795 in April 2026, then peaking at 27,600 in October.
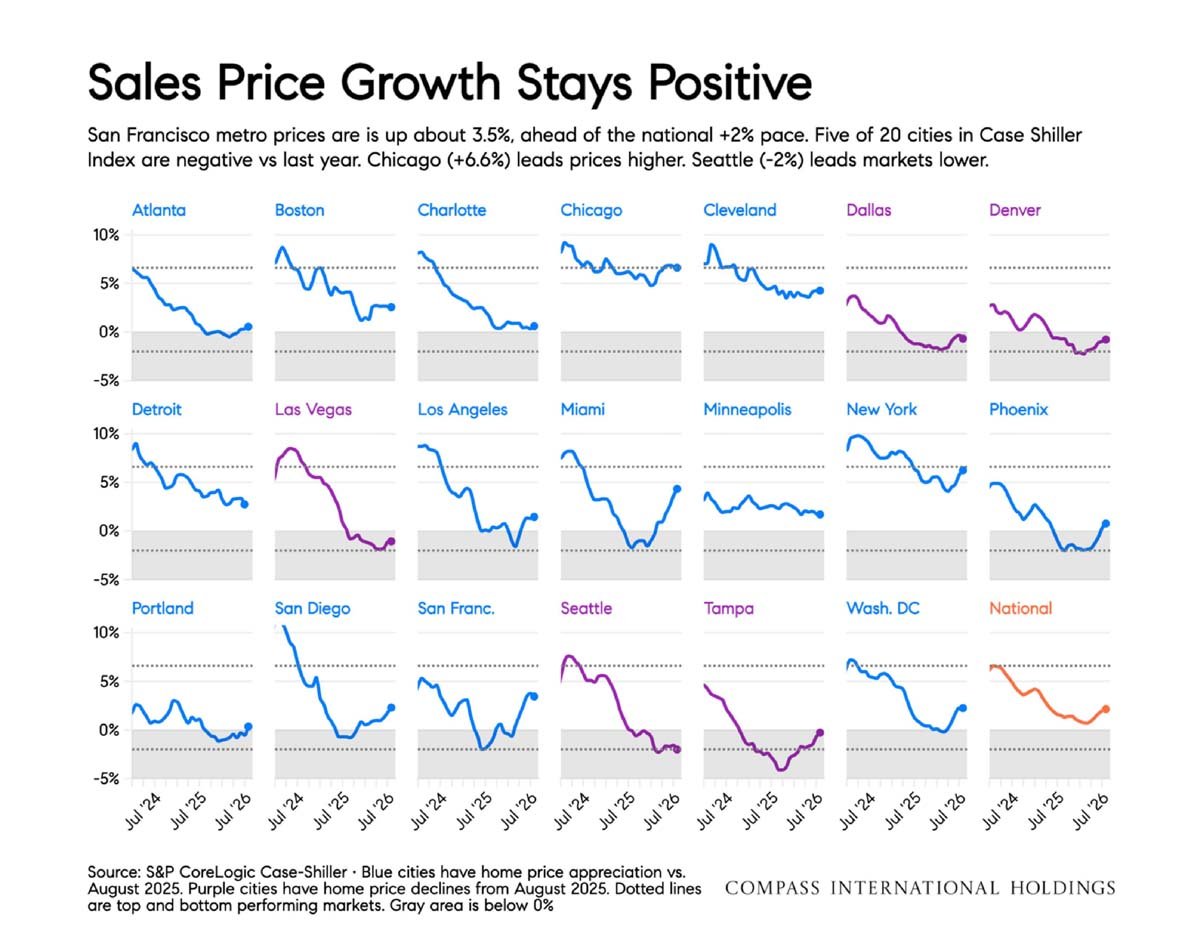
Infographic comparing year-over-year home price growth across 20 U.S. cities and nationally, with San Francisco up about 3.5%.
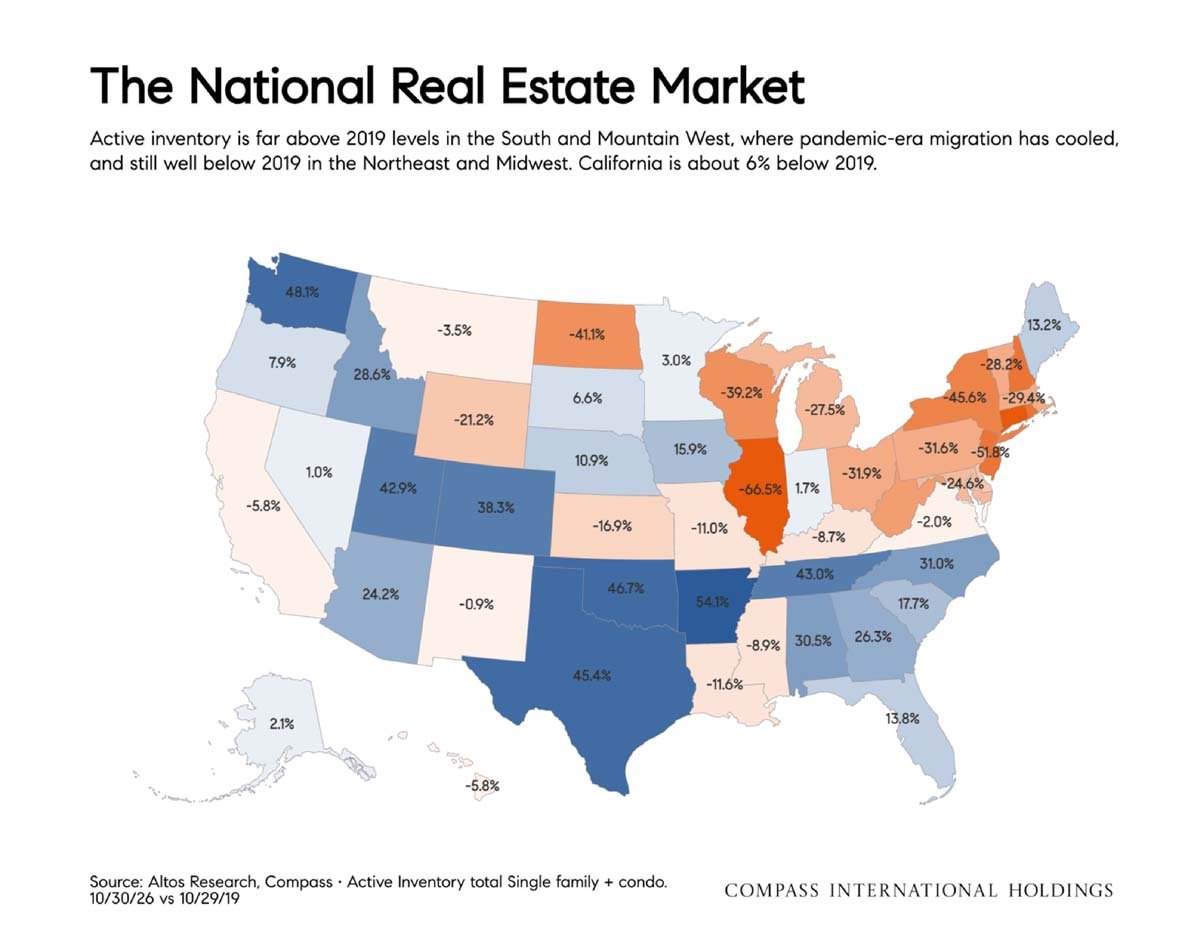
U.S. map showing state-by-state changes in active real estate inventory compared with 2019.
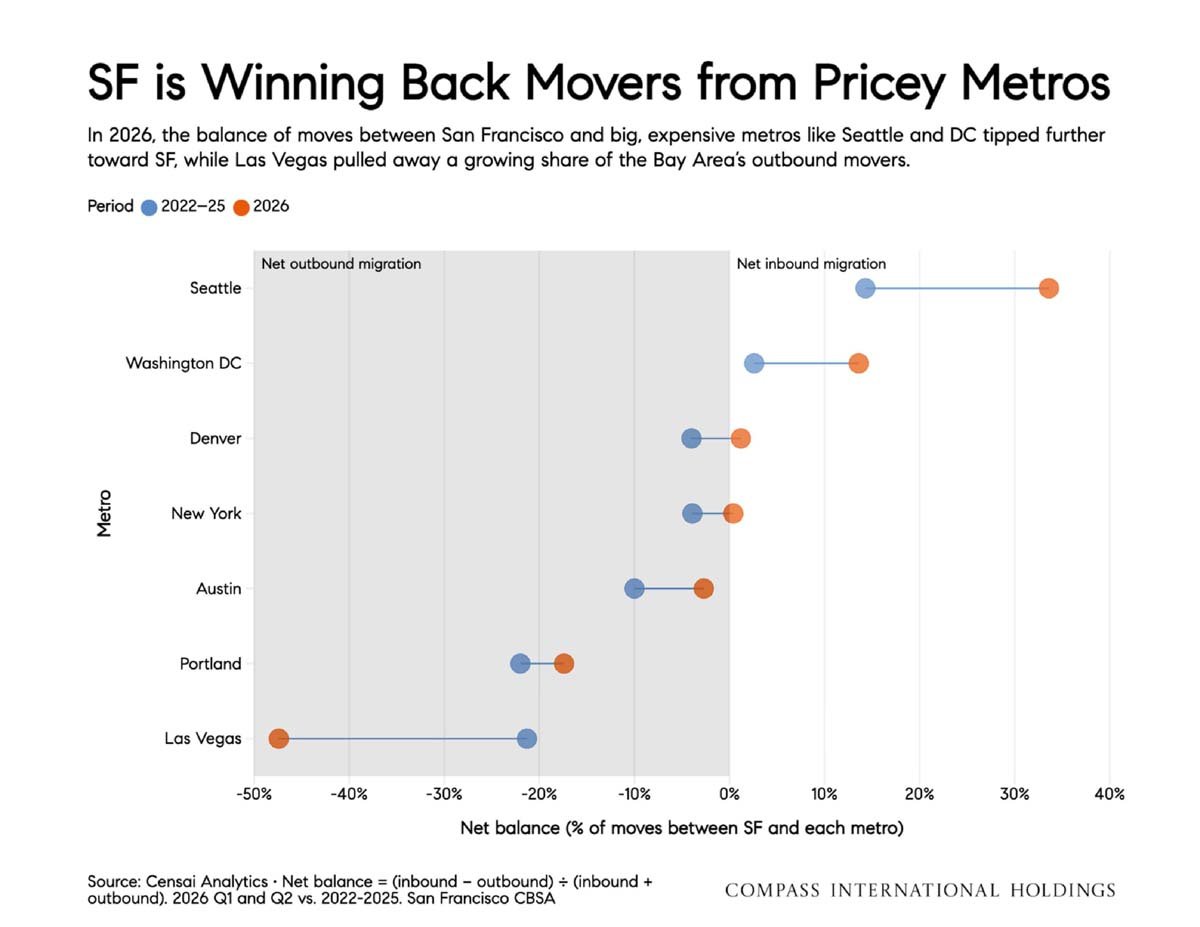
Chart shows 2026 net migration shifts between San Francisco and seven major metros.
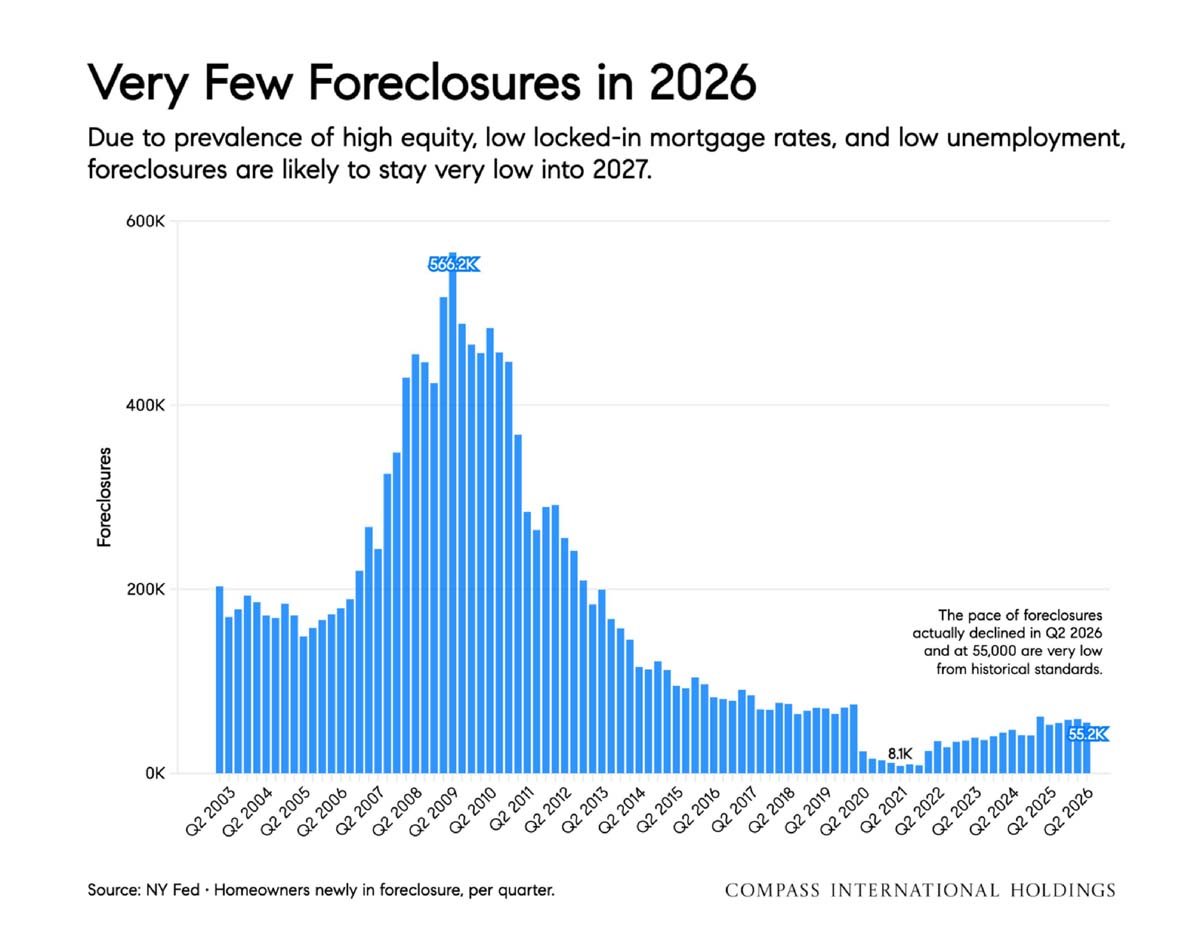
Bar chart showing U.S. quarterly foreclosures peaked in 2009 and fell to 55,200 in 2026.
Compass

Work With Jane

Get assistance in determining the current property value, crafting a competitive offer, writing and negotiating a contract, and much more. Contact me today.
Follow Me on Instagram