October 2026 San Francisco house and condo market outlook

October 2026 San Francisco House & Condo Market Outlook

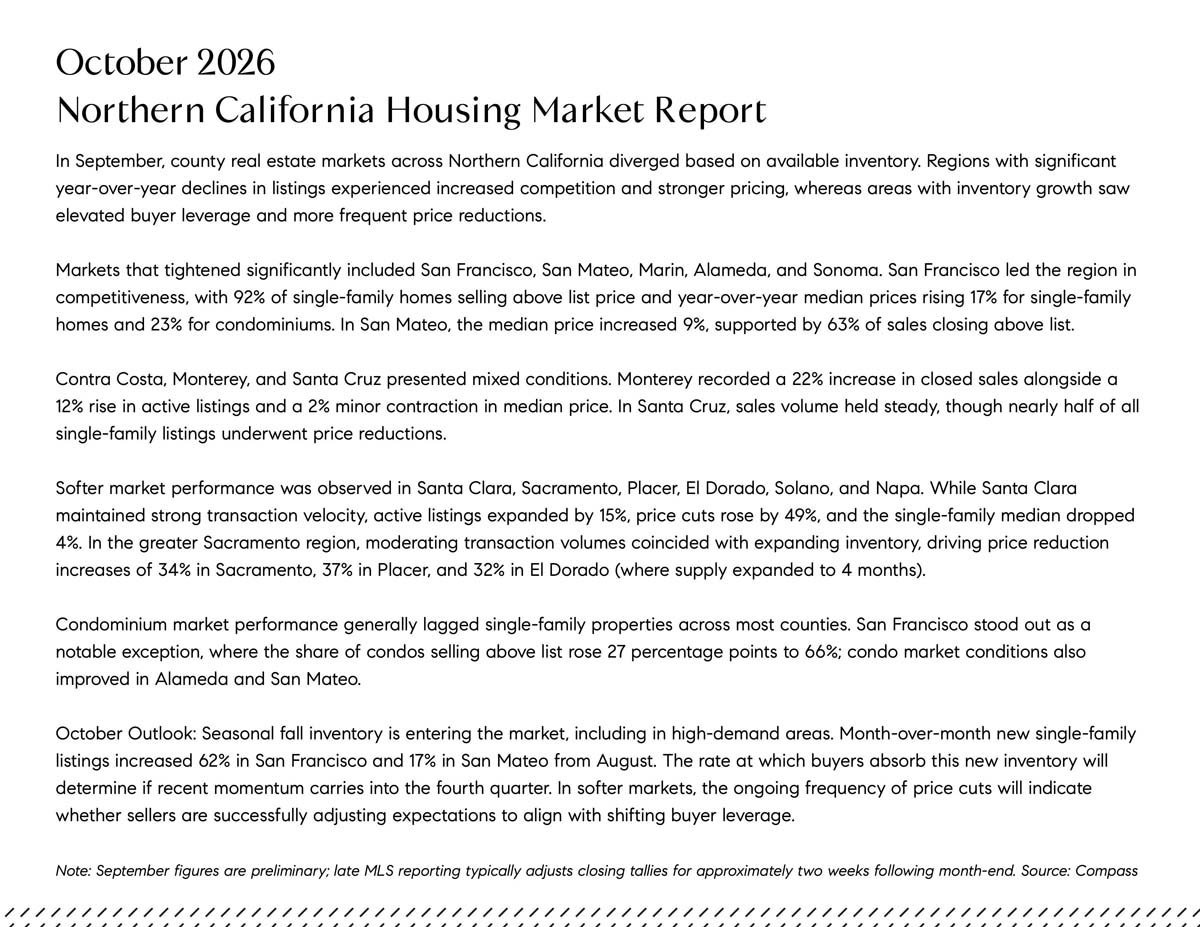
In September, county real estate markets across Northern California diverged based on available inventory. Regions with significant year-over-year declines in listings experienced increased competition and stronger pricing, whereas areas with inventory growth saw elevated buyer leverage and more frequent price reductions.

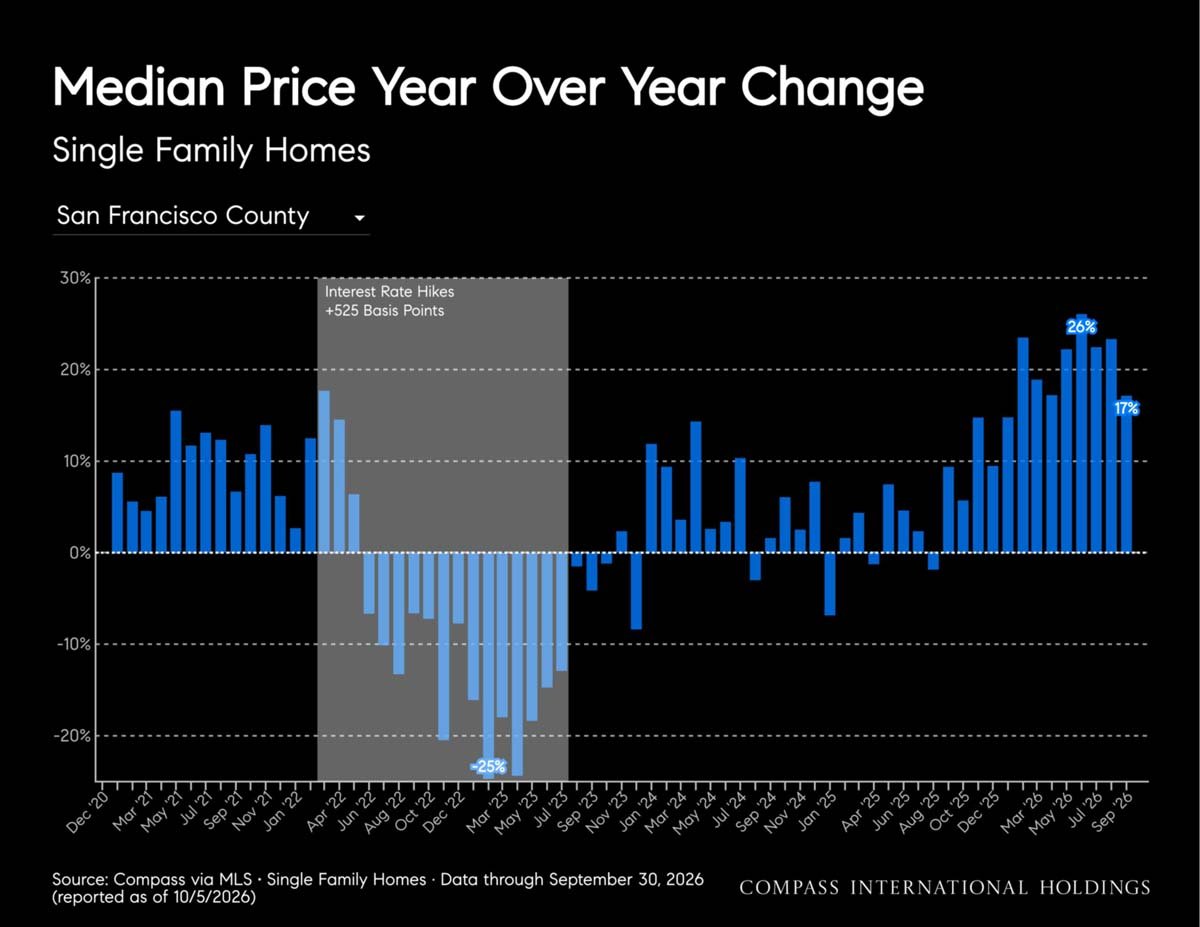
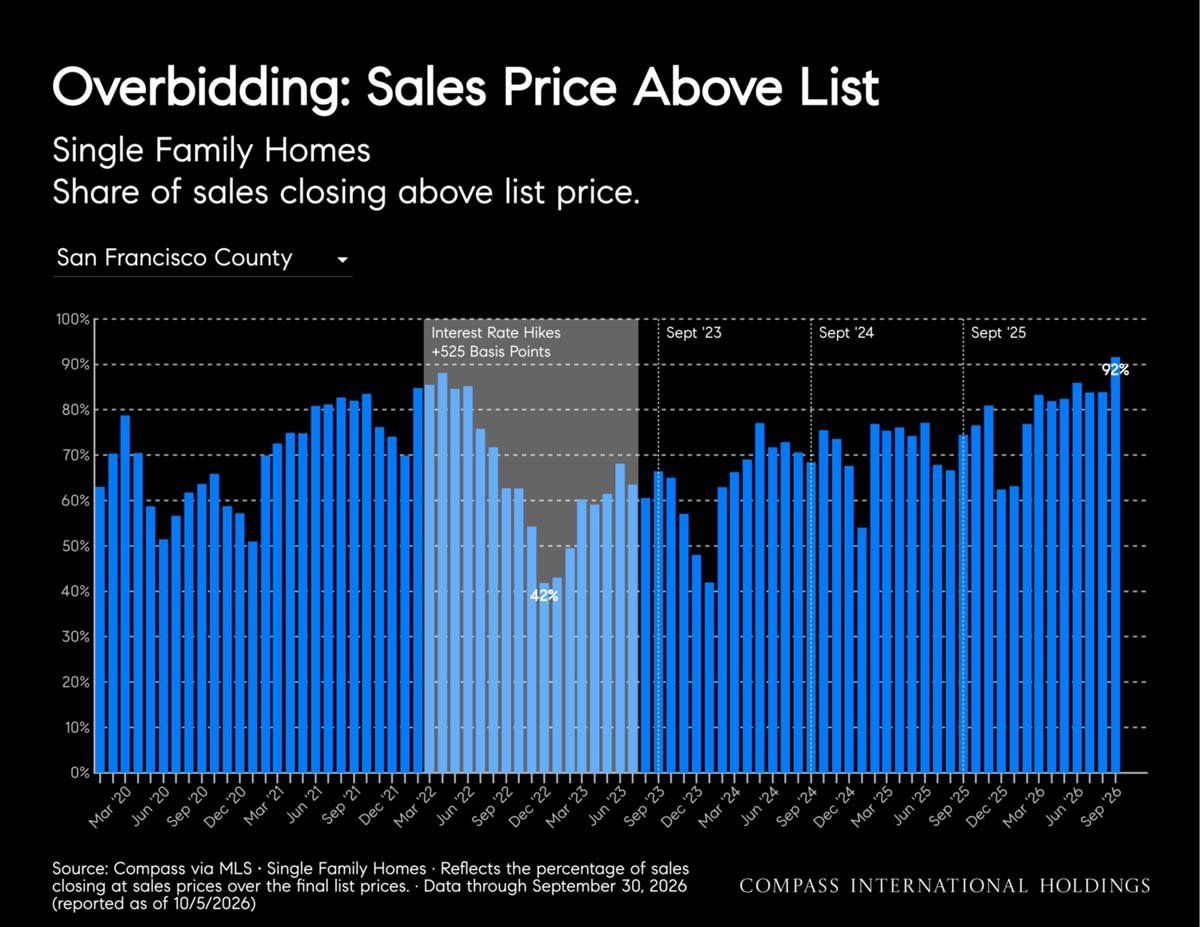
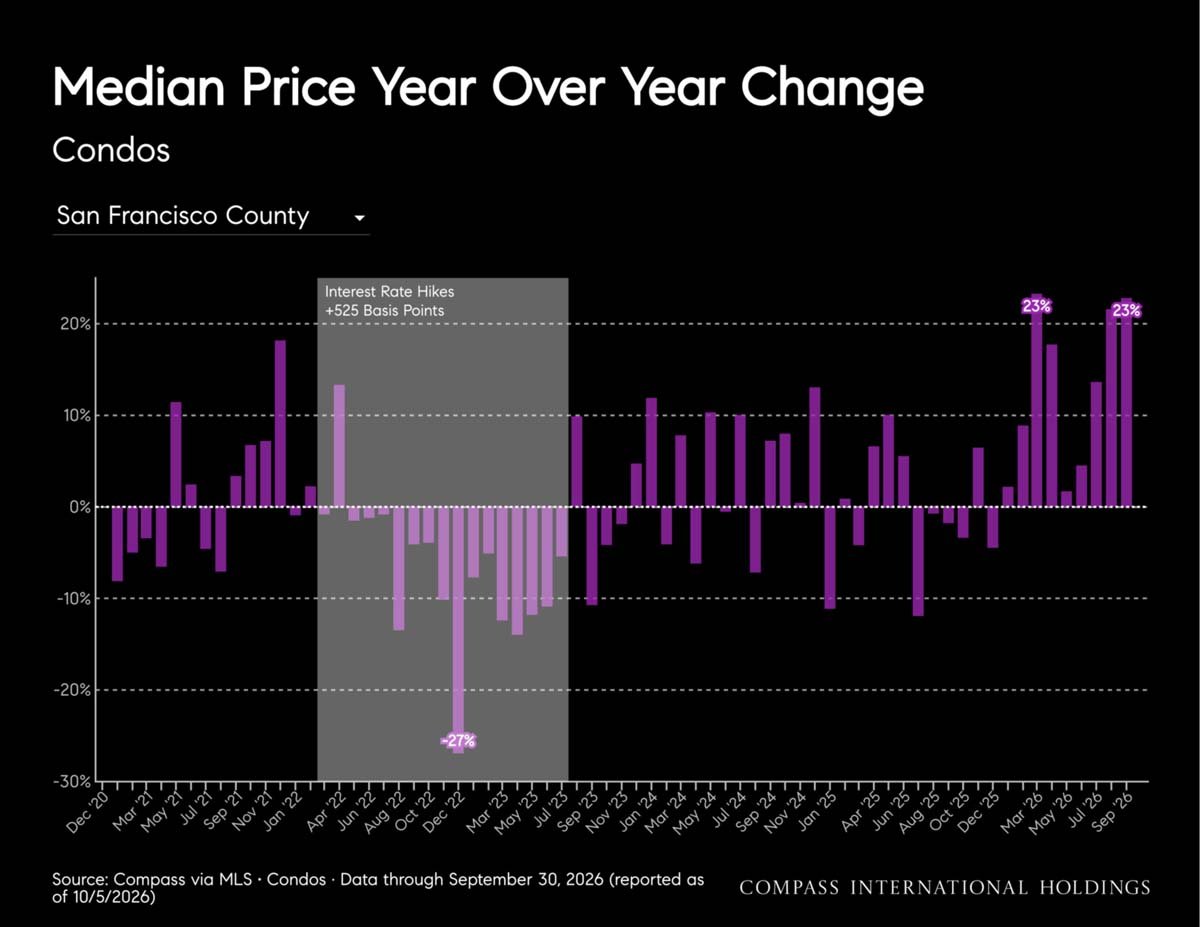
Markets that tightened significantly included San Francisco, San Mateo, Marin, Alameda, and Sonoma. San Francisco led the region in competitiveness, with 92% of single-family homes selling above list price and year-over-year median prices rising 17% for single-family homes and 23% for condominiums. In San Mateo, the median price increased 9%, supported by 63% of sales closing above list.

Contra Costa, Monterey, and Santa Cruz presented mixed conditions. Monterey recorded a 22% increase in closed sales alongside a 12% rise in active listings and a 2% minor contraction in median price. In Santa Cruz, sales volume held steady, though nearly half of all single-family listings underwent price reductions.

Softer market performance was observed in Santa Clara, Sacramento, Placer, El Dorado, Solano, and Napa. While Santa Clara maintained strong transaction velocity, active listings expanded by 15%, price cuts rose by 49%, and the single-family median dropped 4%. In the greater Sacramento region, moderating transaction volumes coincided with expanding inventory, driving price reduction increases of 34% in Sacramento, 37% in Placer, and 32% in El Dorado (where supply expanded to 4 months).

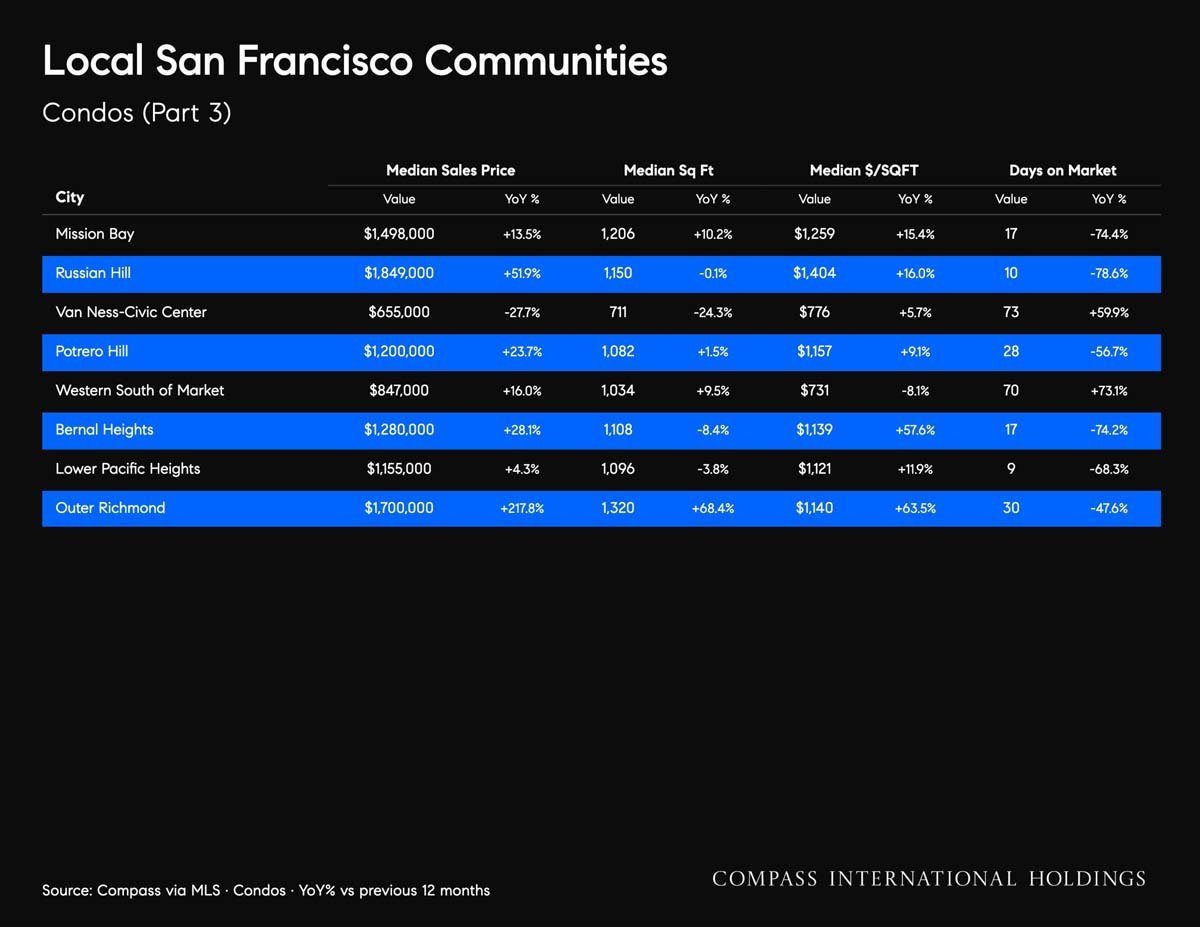
Condominium market performance generally lagged single-family properties across most counties. San Francisco stood out as a notable exception, where the share of condos selling above list rose 27 percentage points to 66%; condo market conditions also improved in Alameda and San Mateo.

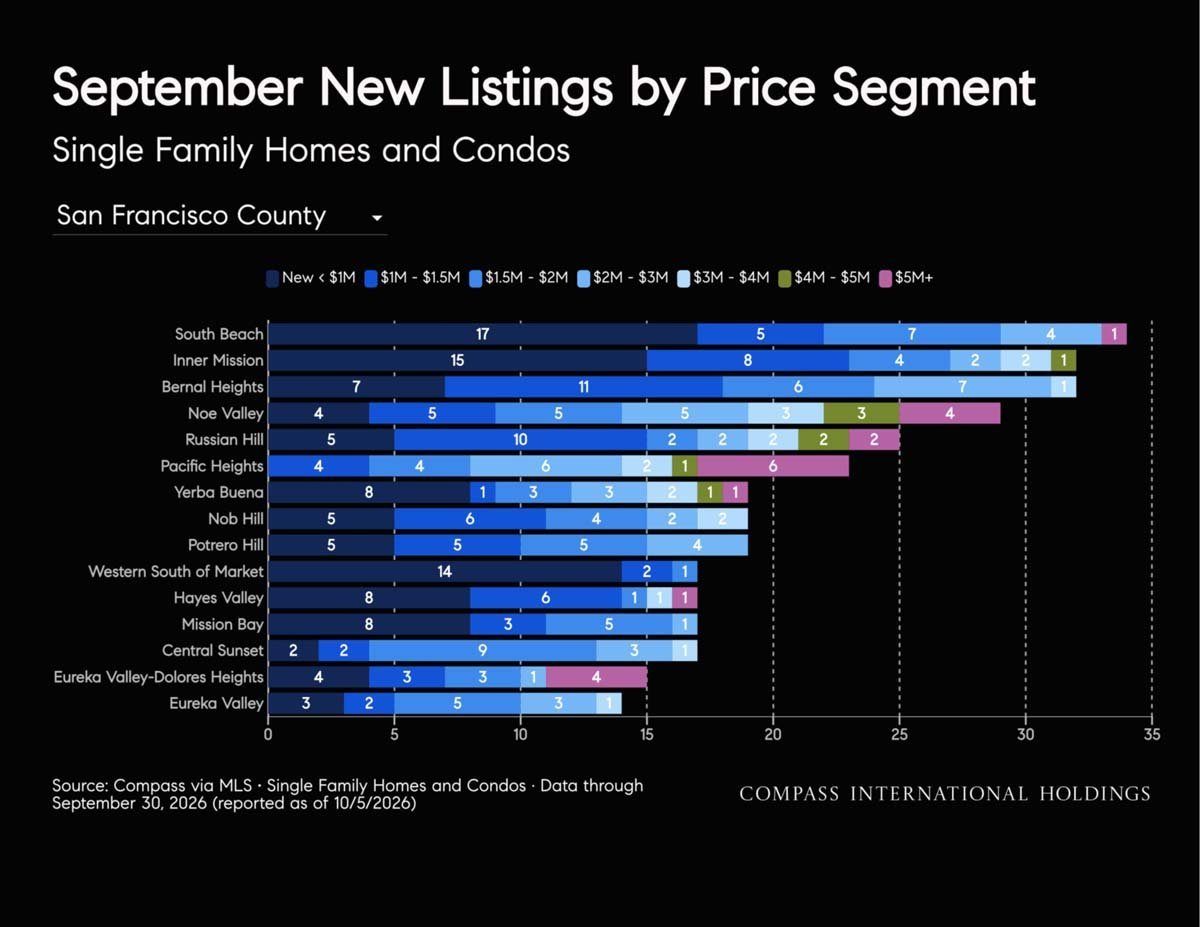
October Outlook: Seasonal fall inventory is entering the market, including in high-demand areas. Month-over-month new single-family listings increased 62% in San Francisco and 17% in San Mateo from August. The rate at which buyers absorb this new inventory will determine if recent momentum carries into the fourth quarter. In softer markets, the ongoing frequency of price cuts will indicate whether sellers are successfully adjusting expectations to align with shifting buyer leverage.

Note: September figures are preliminary; late MLS reporting typically adjusts closing tallies for approximately two weeks following month-end. Source: Compass
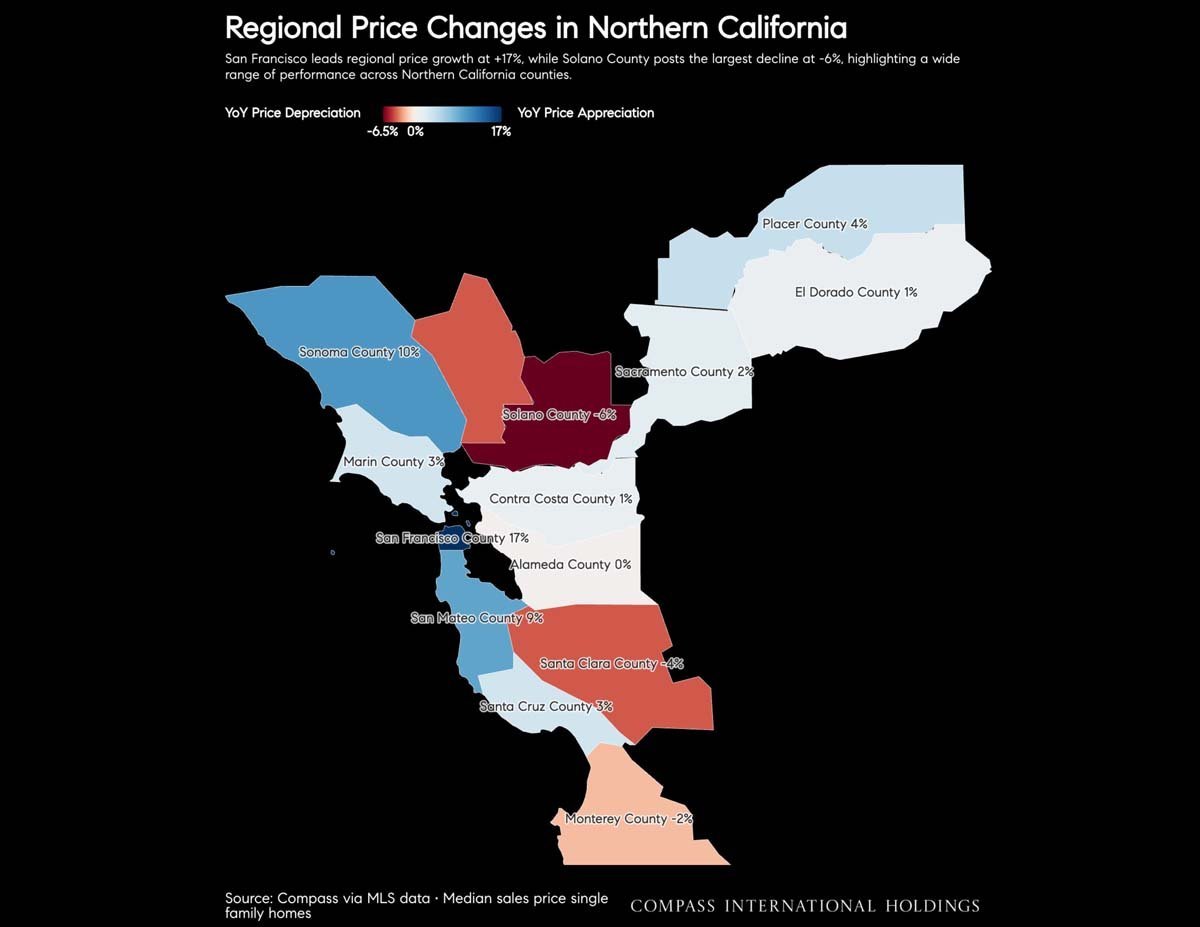
Map infographic comparing year-over-year home price changes across Northern California counties.
October 2026 Northern California housing market report covering county trends, condo performance, and outlook.
San Francisco Market report cover featuring a view down the Golden Gate Bridge.
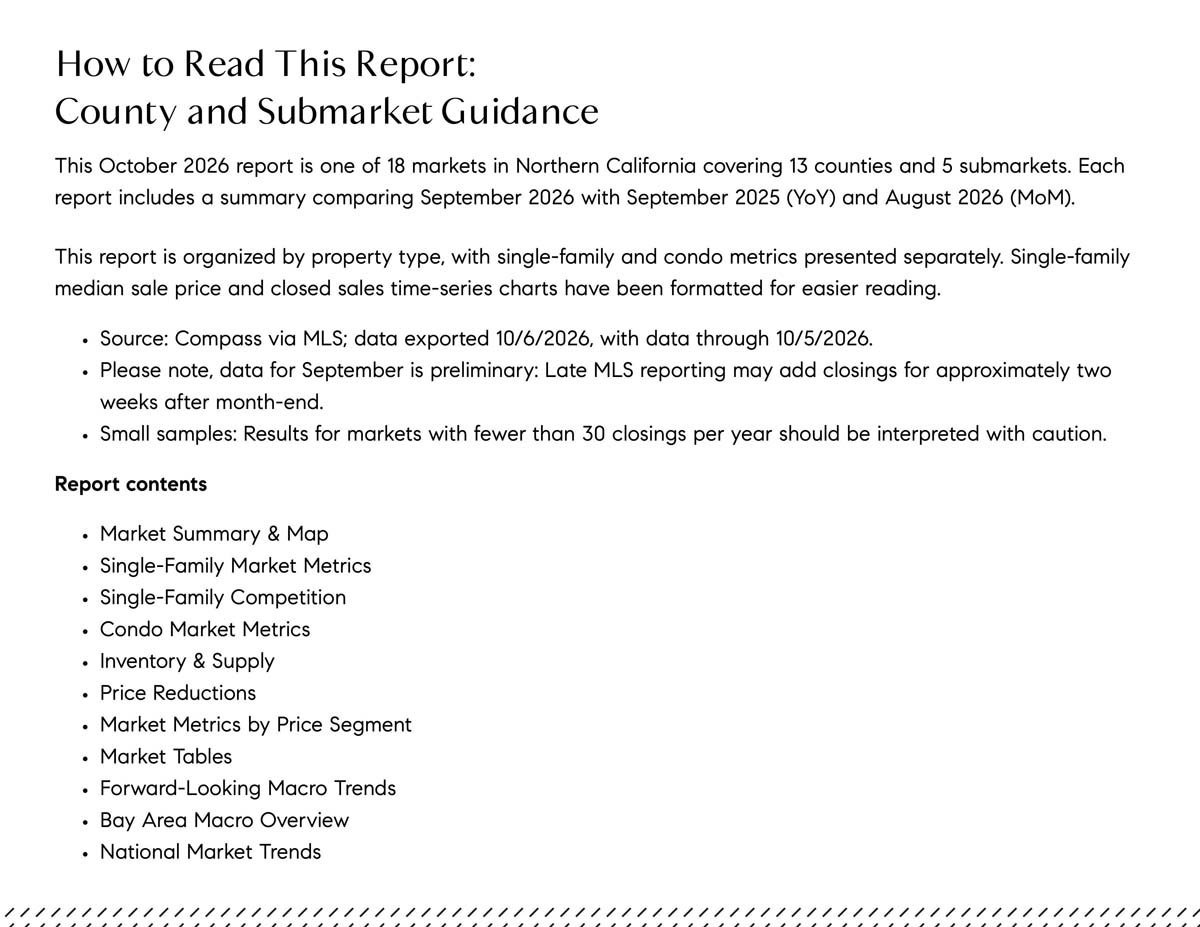
October 2026 San Francisco housing market report guidance and contents, with data notes and a list of sections.
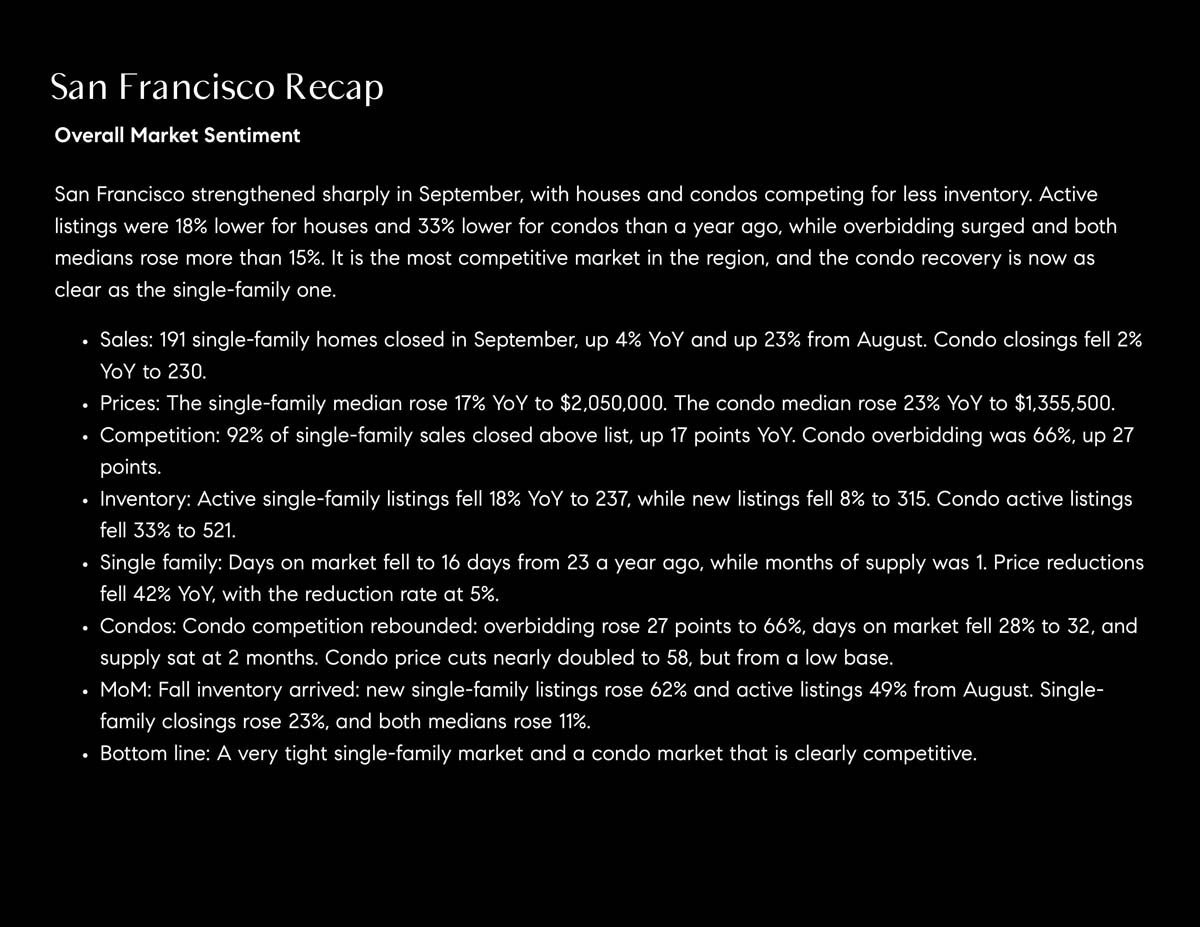
San Francisco market recap summarizing September home and condo sales, prices, competition, and inventory.
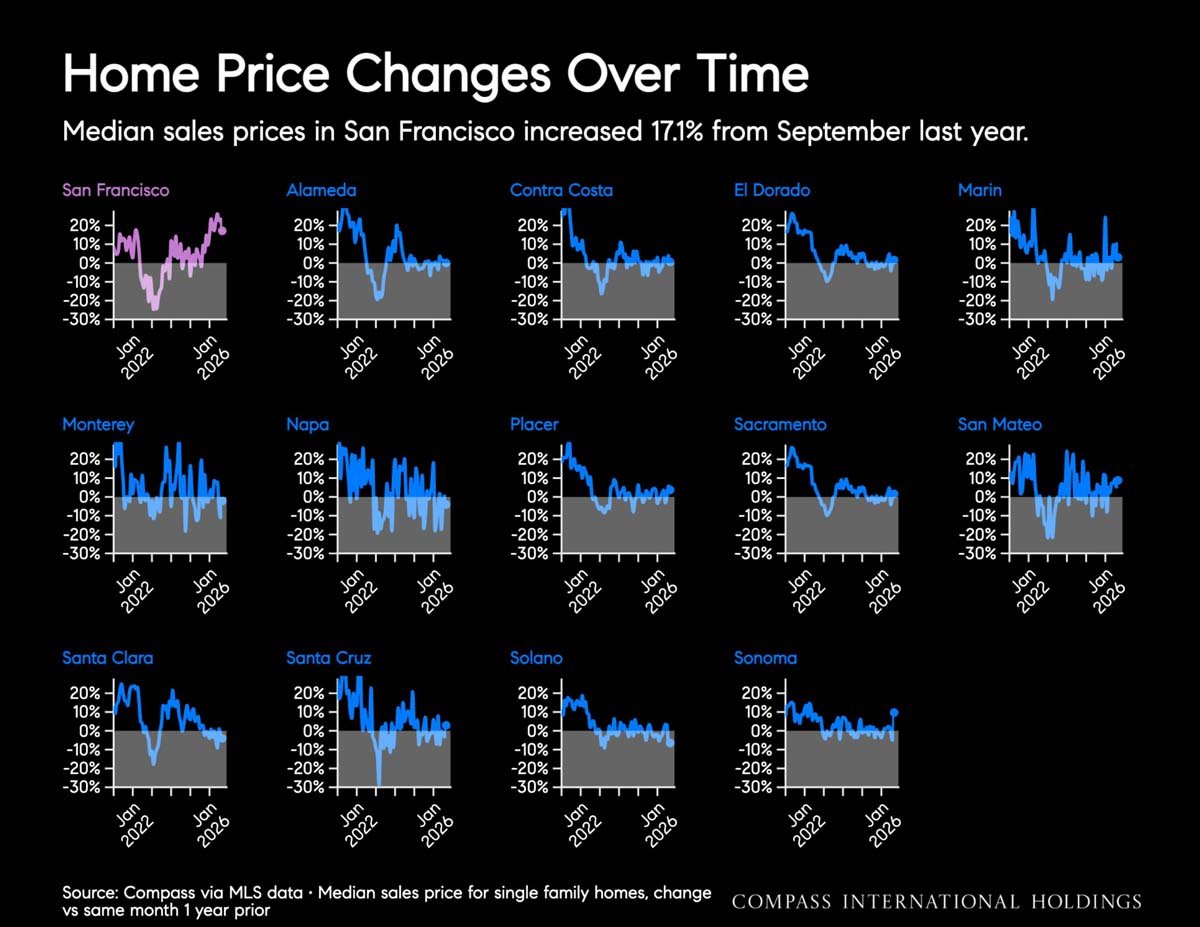
Chart comparing year-over-year median home price changes across San Francisco and nearby counties.
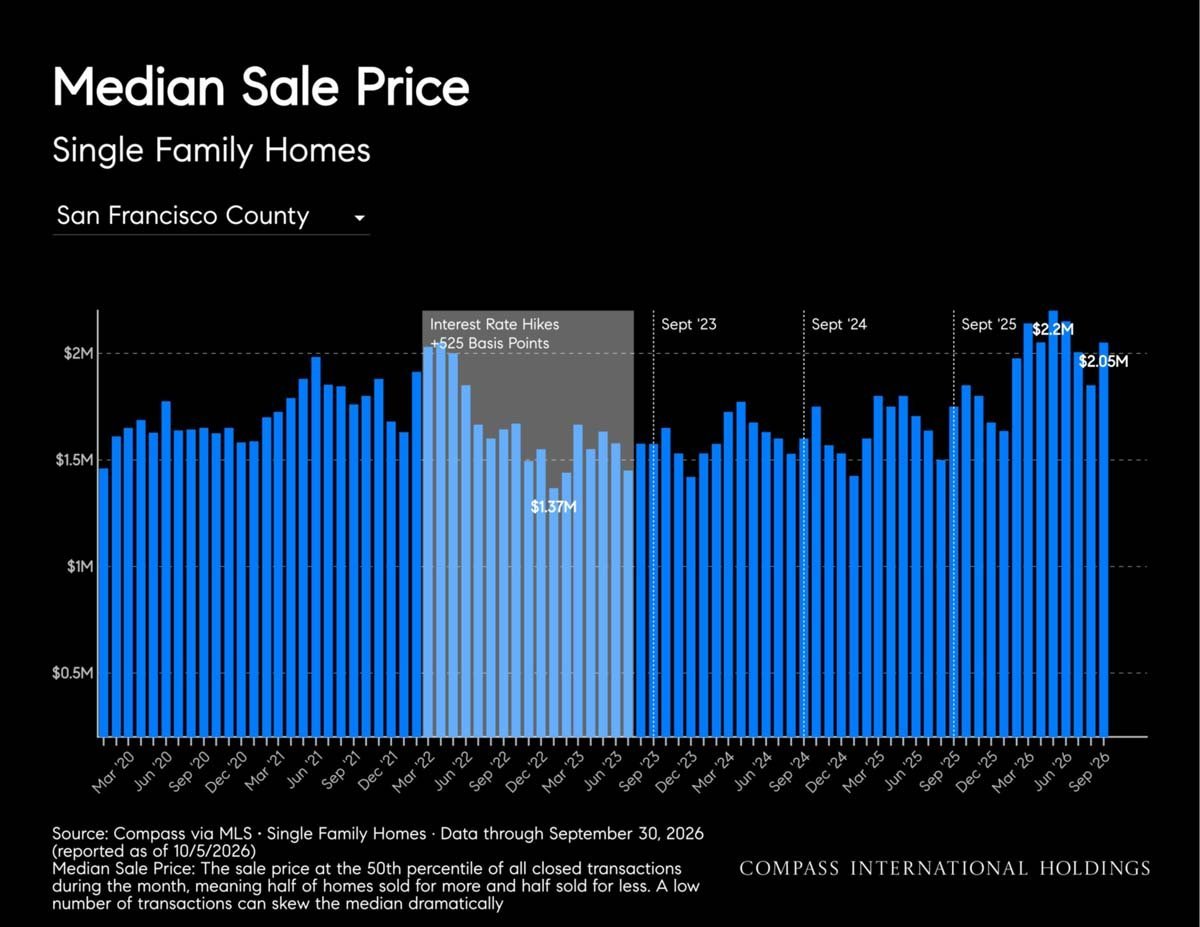
San Francisco County single-family home median sale price chart, showing monthly prices through September 2026.
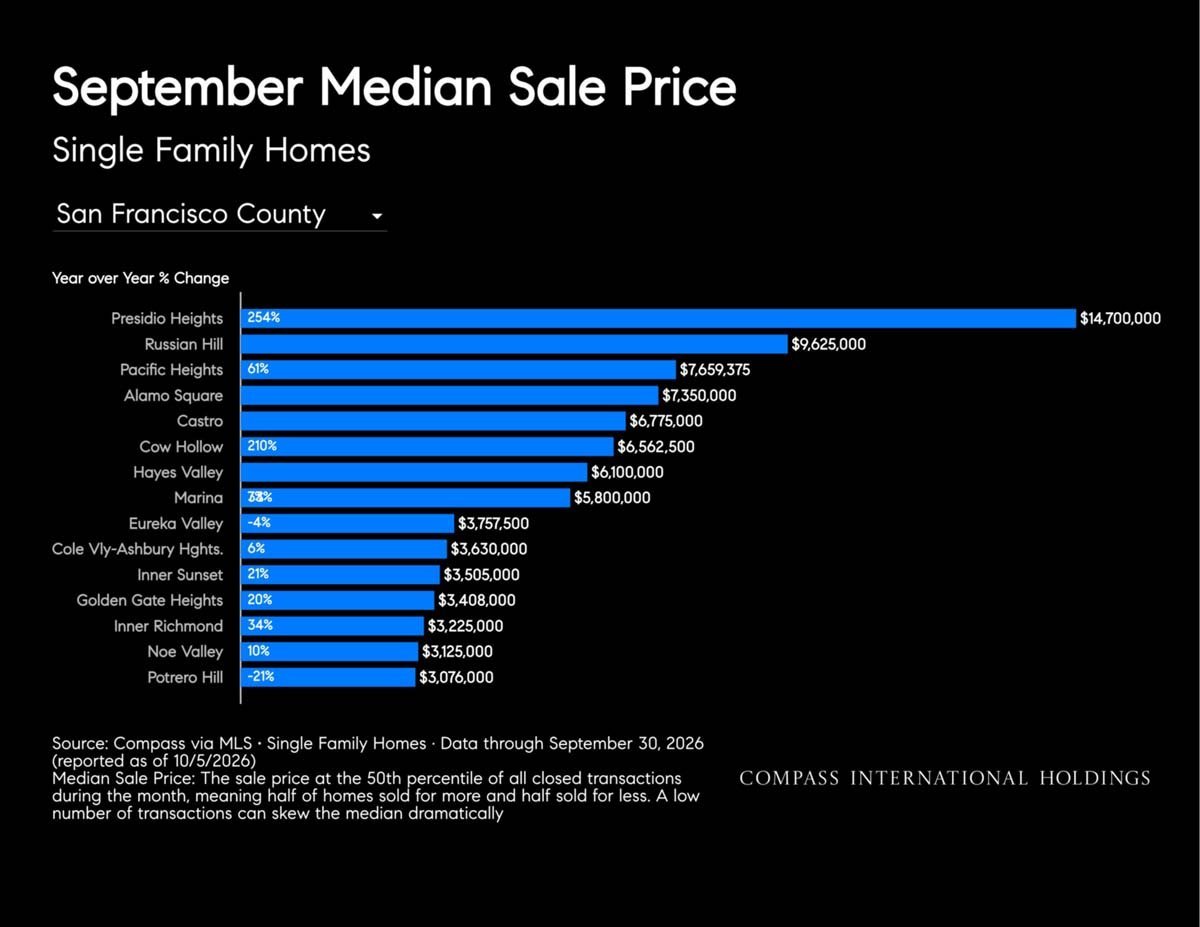
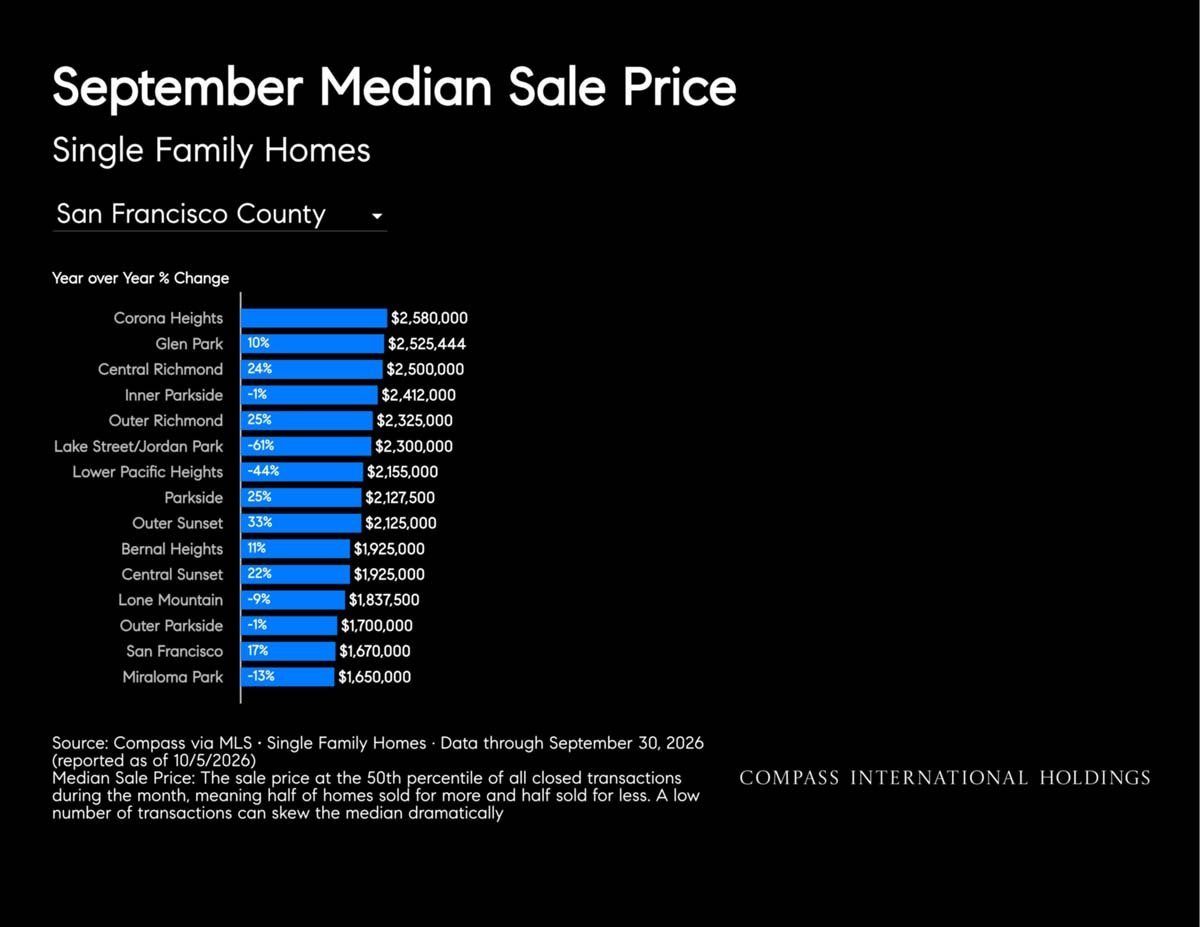
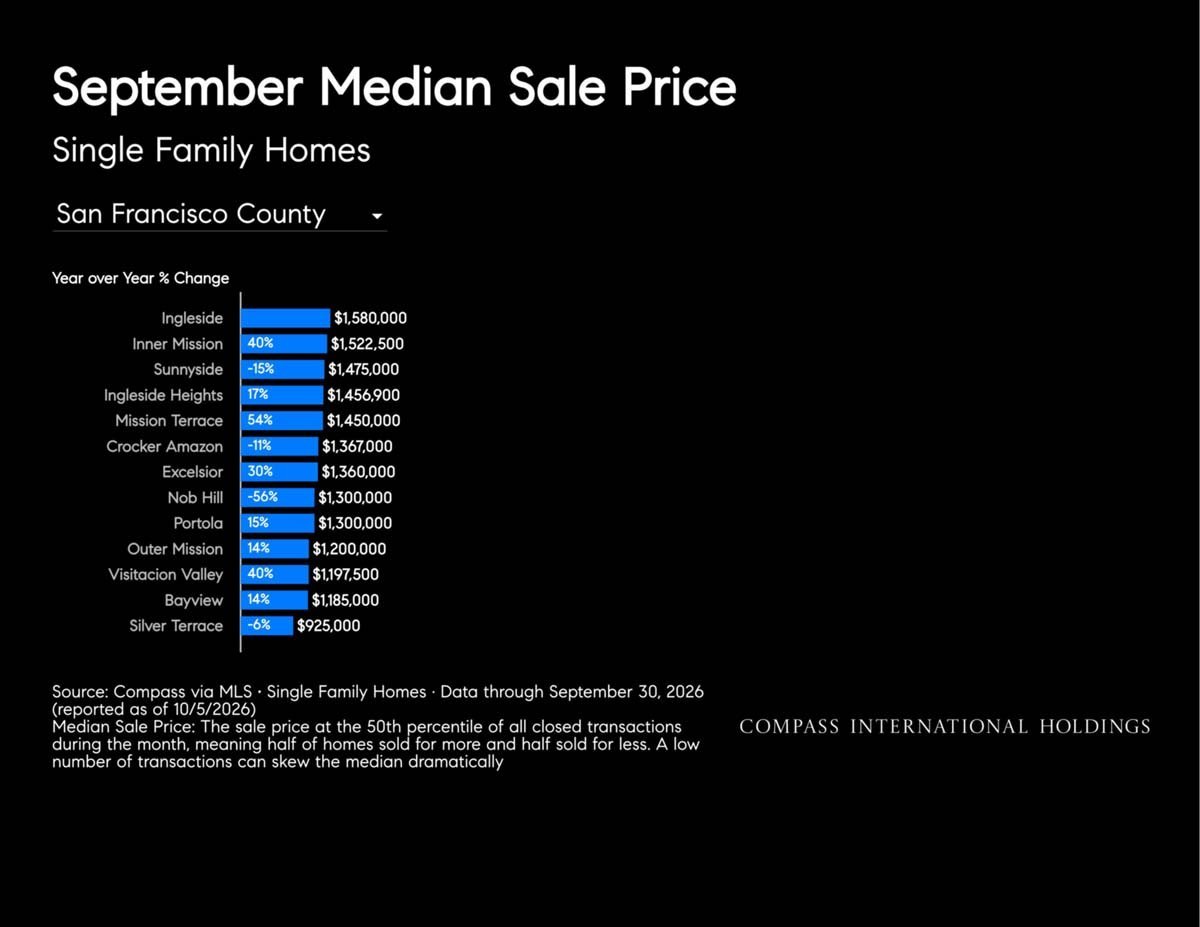
Chart of September median single-family home sale prices across San Francisco neighborhoods.
Bar chart of September median sale prices for San Francisco single-family homes by neighborhood.
Bar chart of September San Francisco single-family home median sale prices by neighborhood.
Chart of San Francisco County single-family home median price year-over-year change, from December 2020 to September 2026.
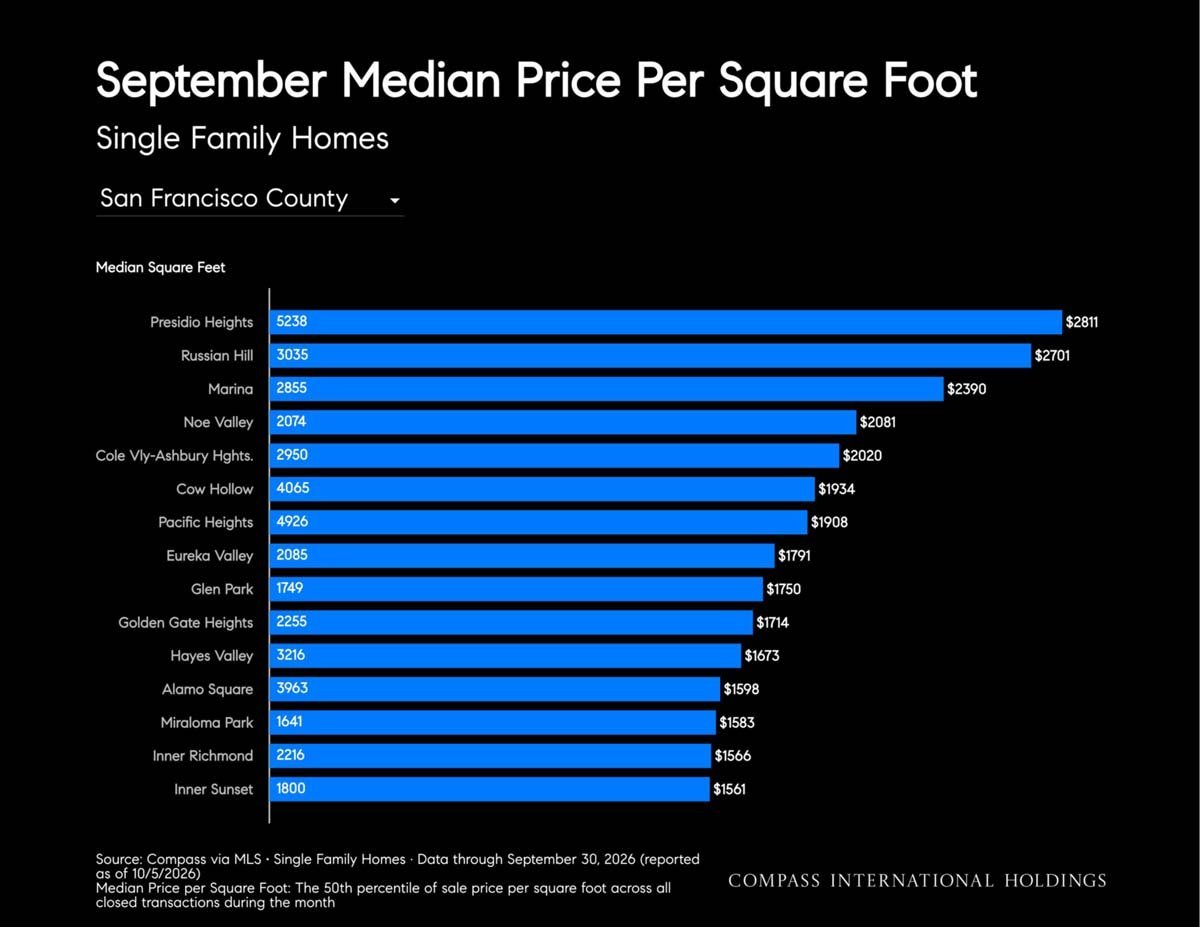
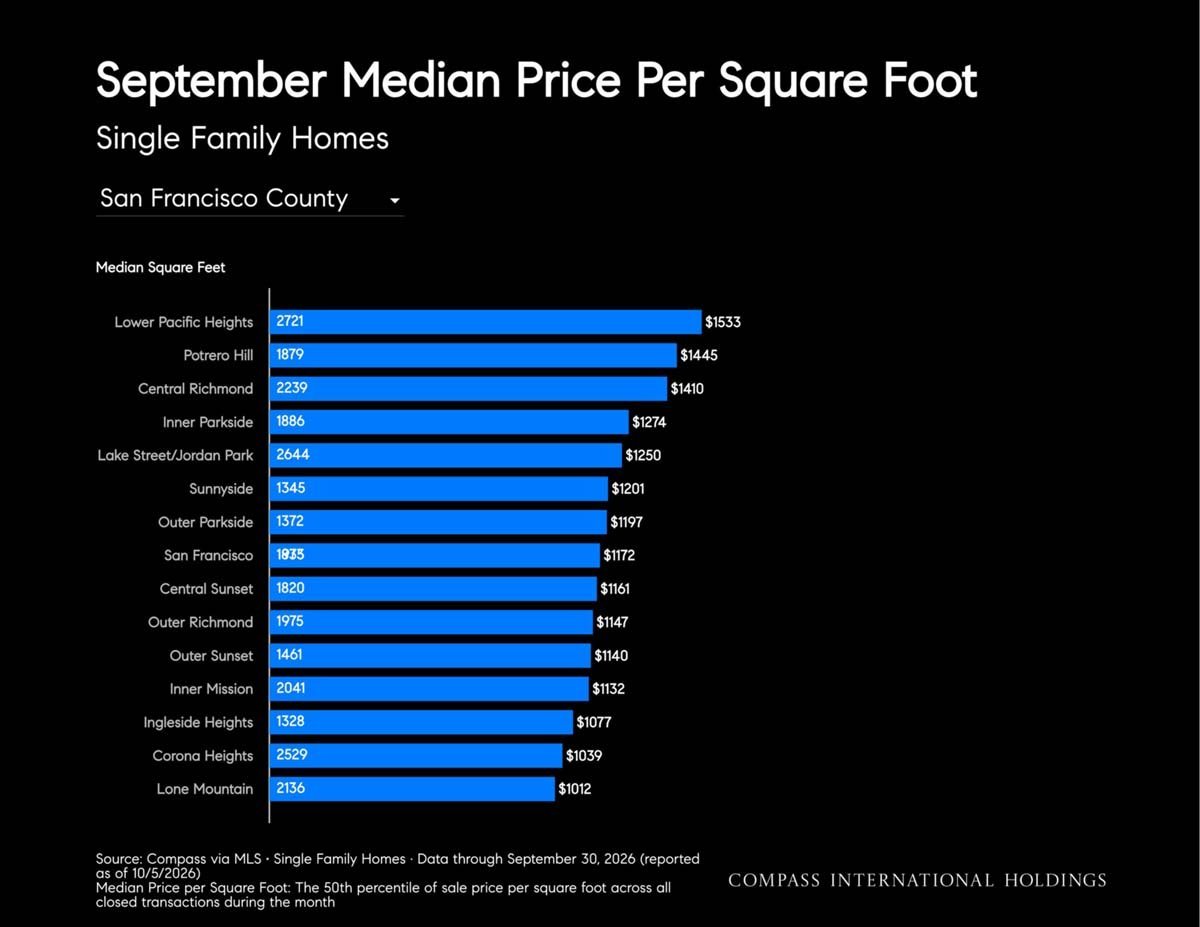
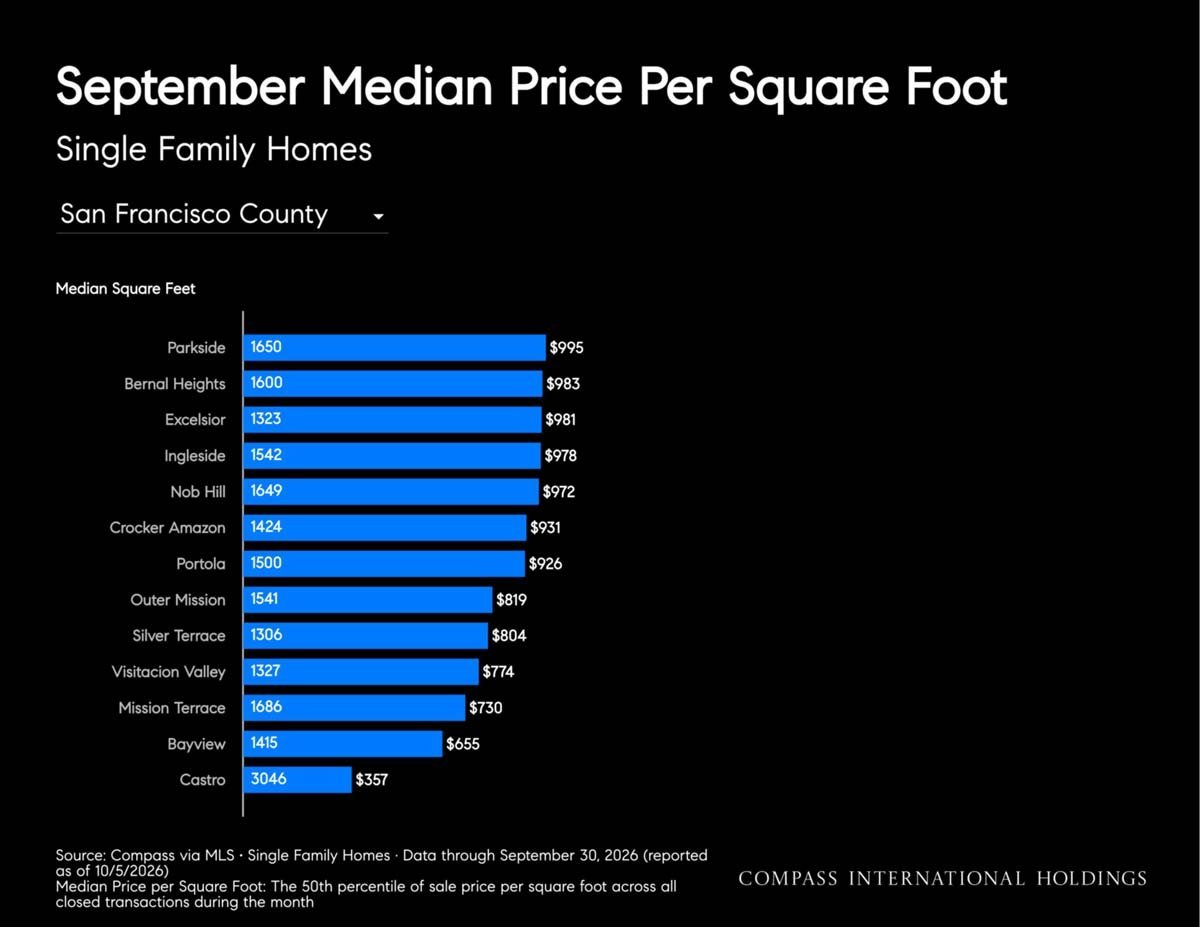
San Francisco County single-family home median price per square foot by neighborhood, September 2026.
Bar chart comparing September median price per square foot for San Francisco single-family homes by neighborhood.
September median price per square foot chart for San Francisco single-family homes by neighborhood.
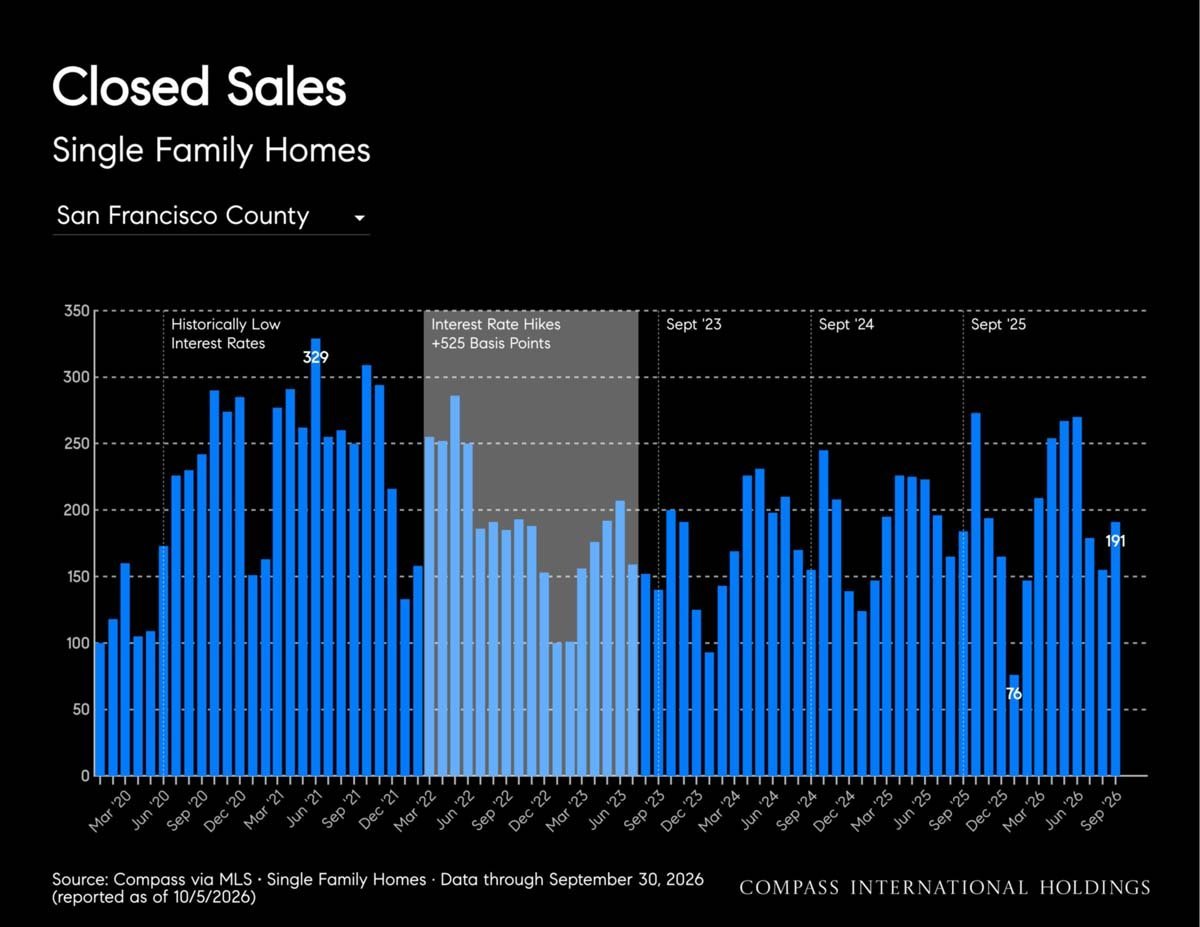
Bar chart of monthly San Francisco County single-family home sales from March 2020 to September 2026.
Chart showing the share of San Francisco County single-family home sales closing above list price, reaching 92% in September 2026.
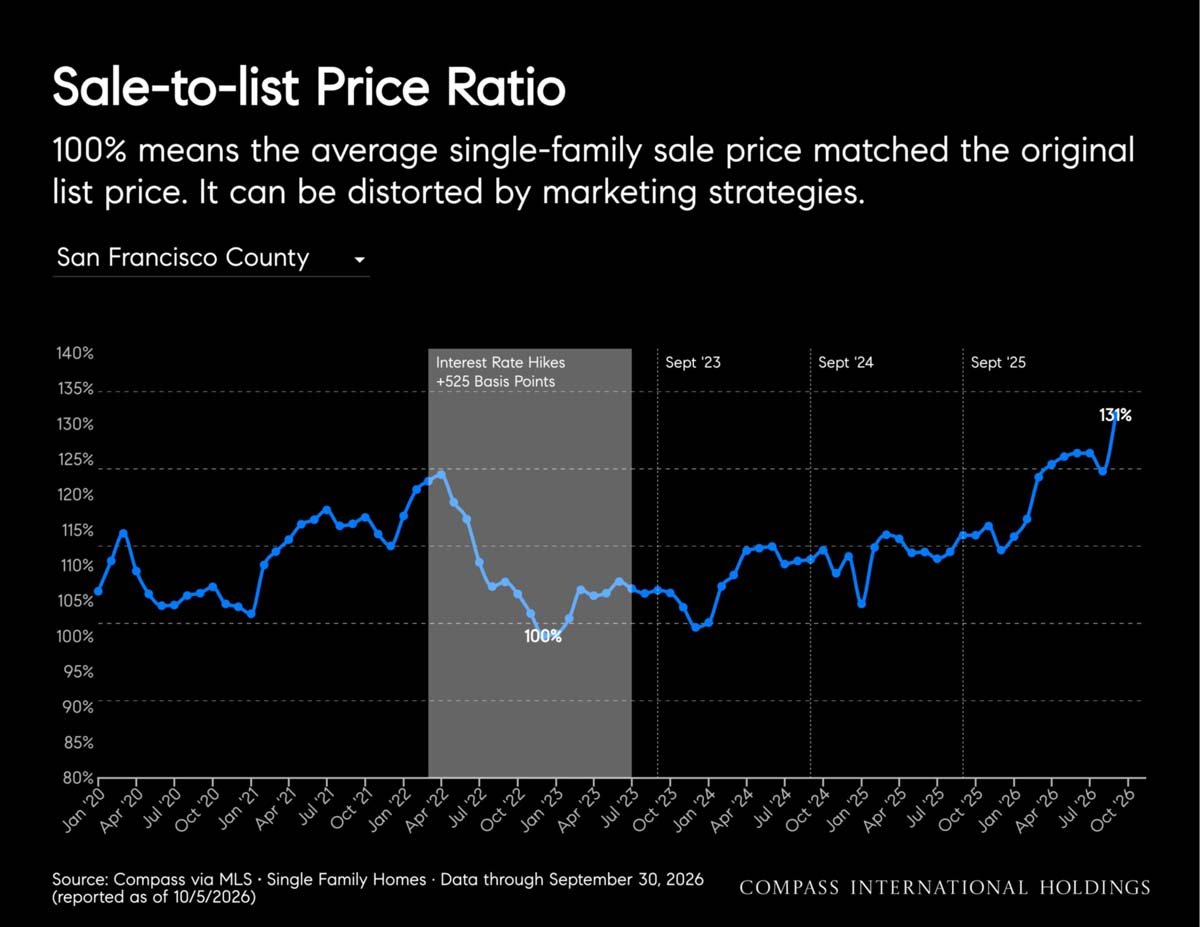
Sale-to-list Price Ratio
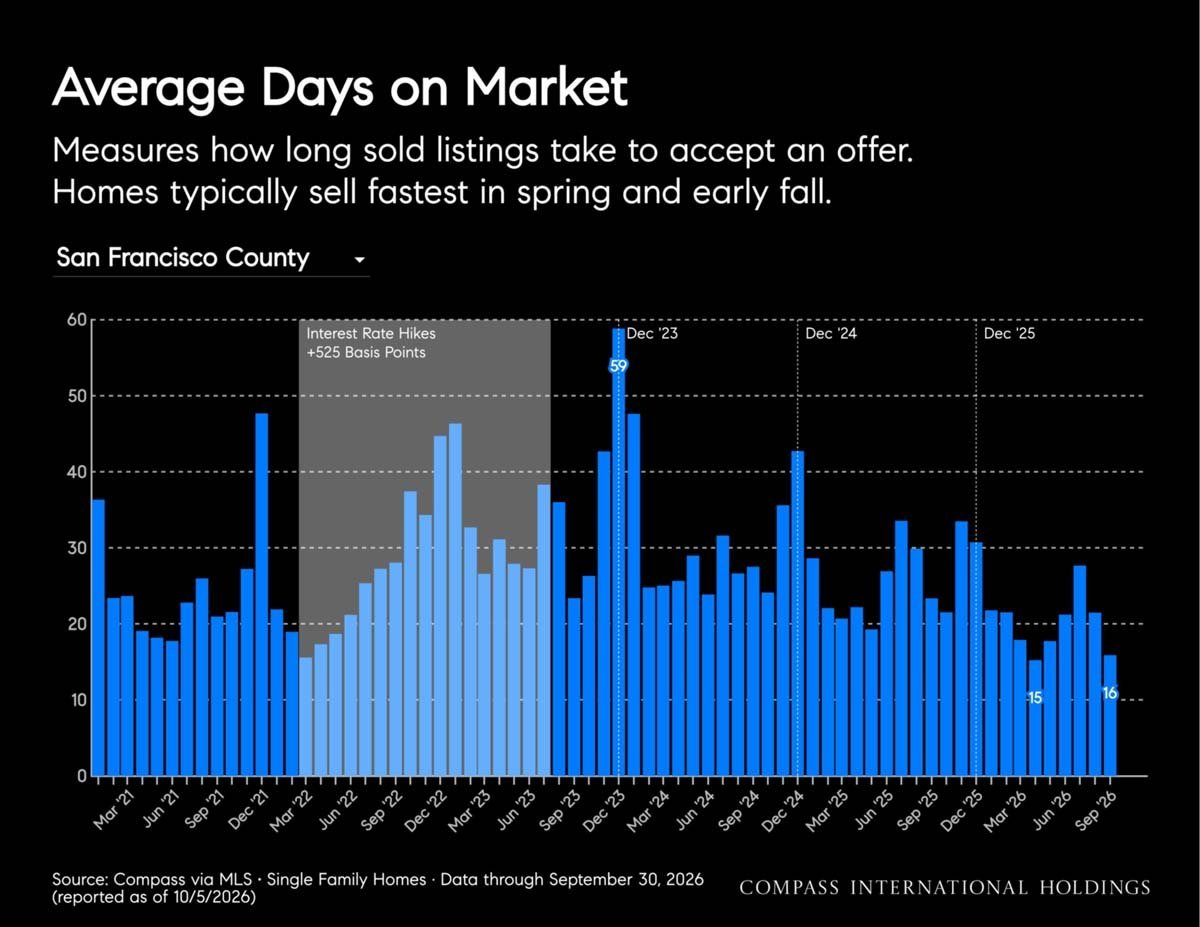
Chart of average days on market for San Francisco County single-family homes, March 2021 to September 2026.
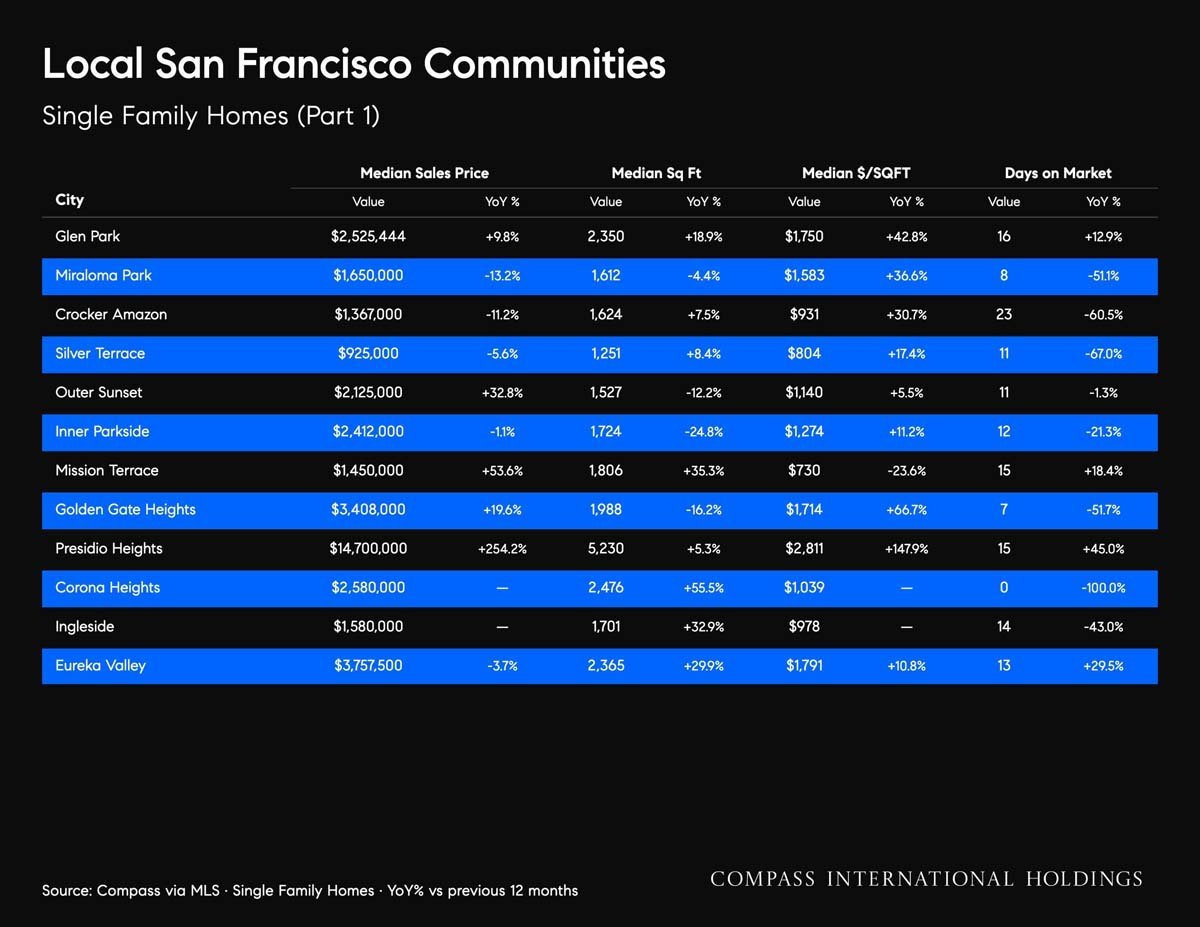
San Francisco single-family home market statistics by neighborhood, including prices, square footage, and days on market.
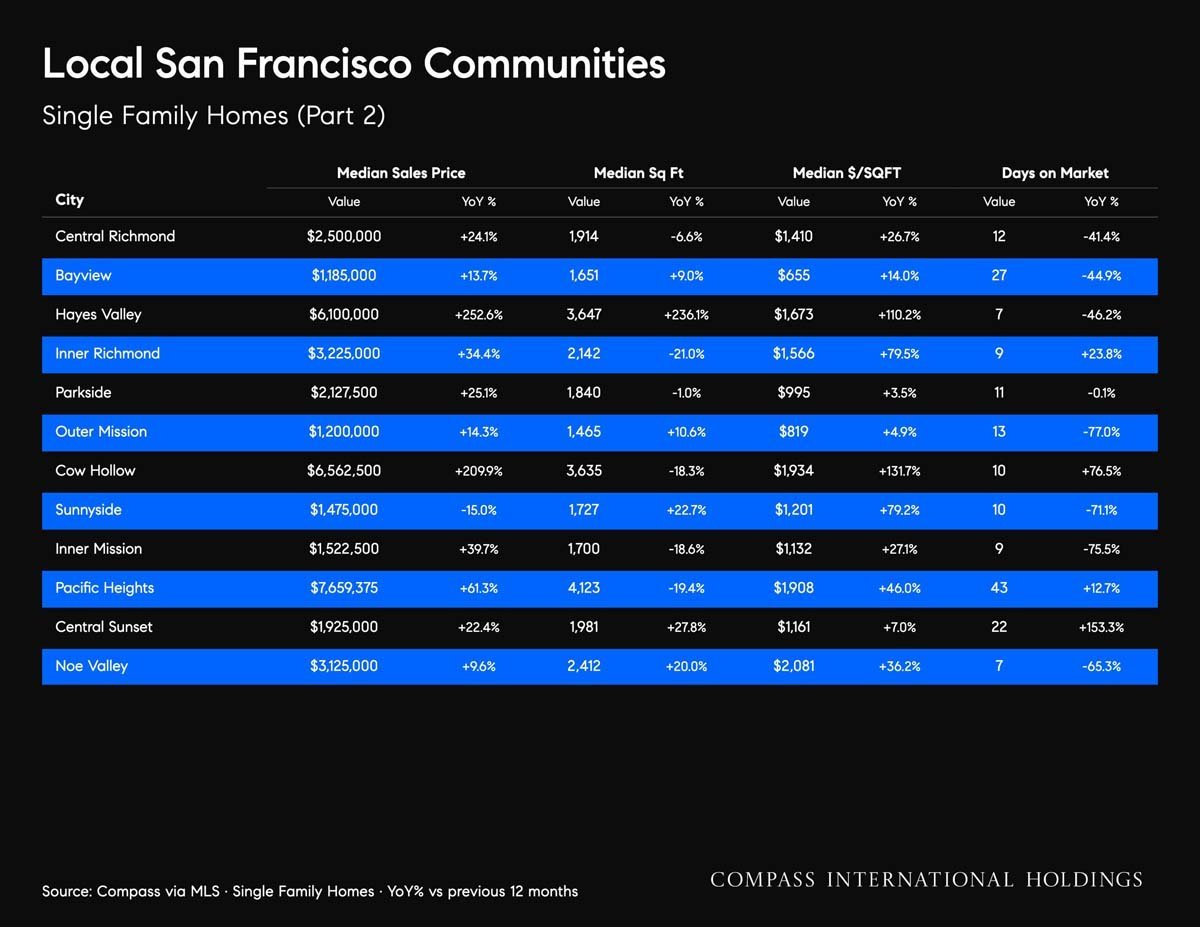
San Francisco single-family home neighborhood market statistics, including prices, square footage, and days on market.
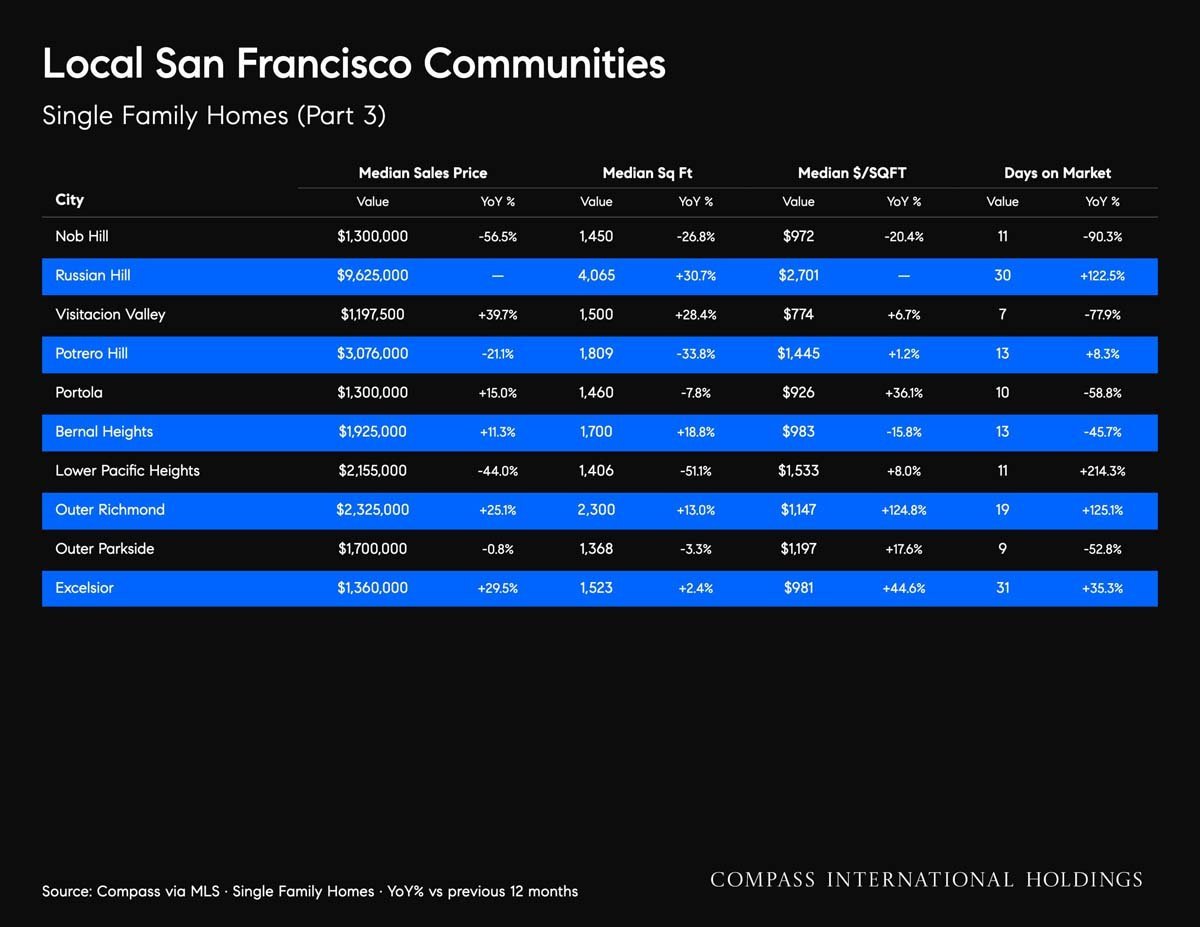
San Francisco single-family home market table comparing neighborhood prices, square footage, and days on market.
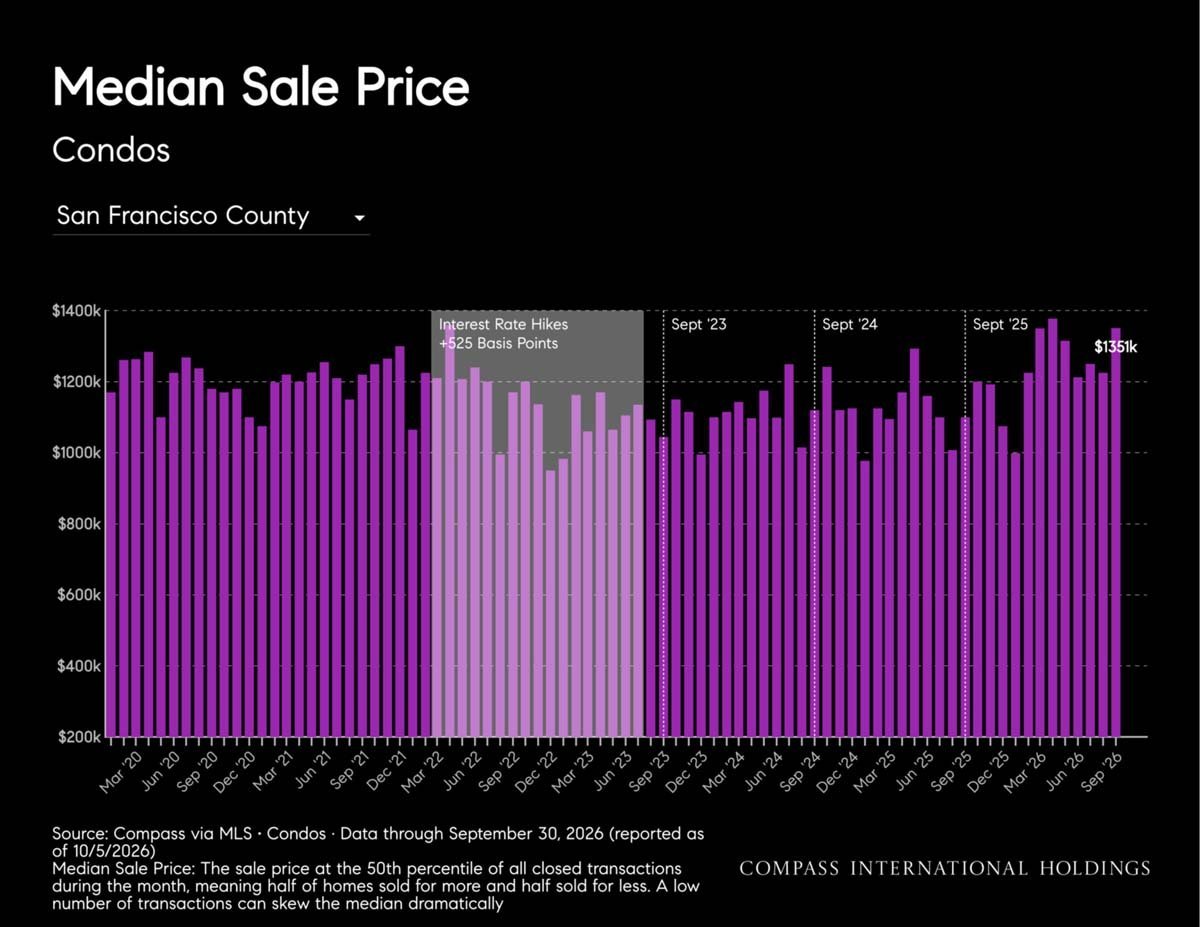
Bar chart of San Francisco County condo median sale prices from March 2020 to September 2026, ending at $1.351 million.
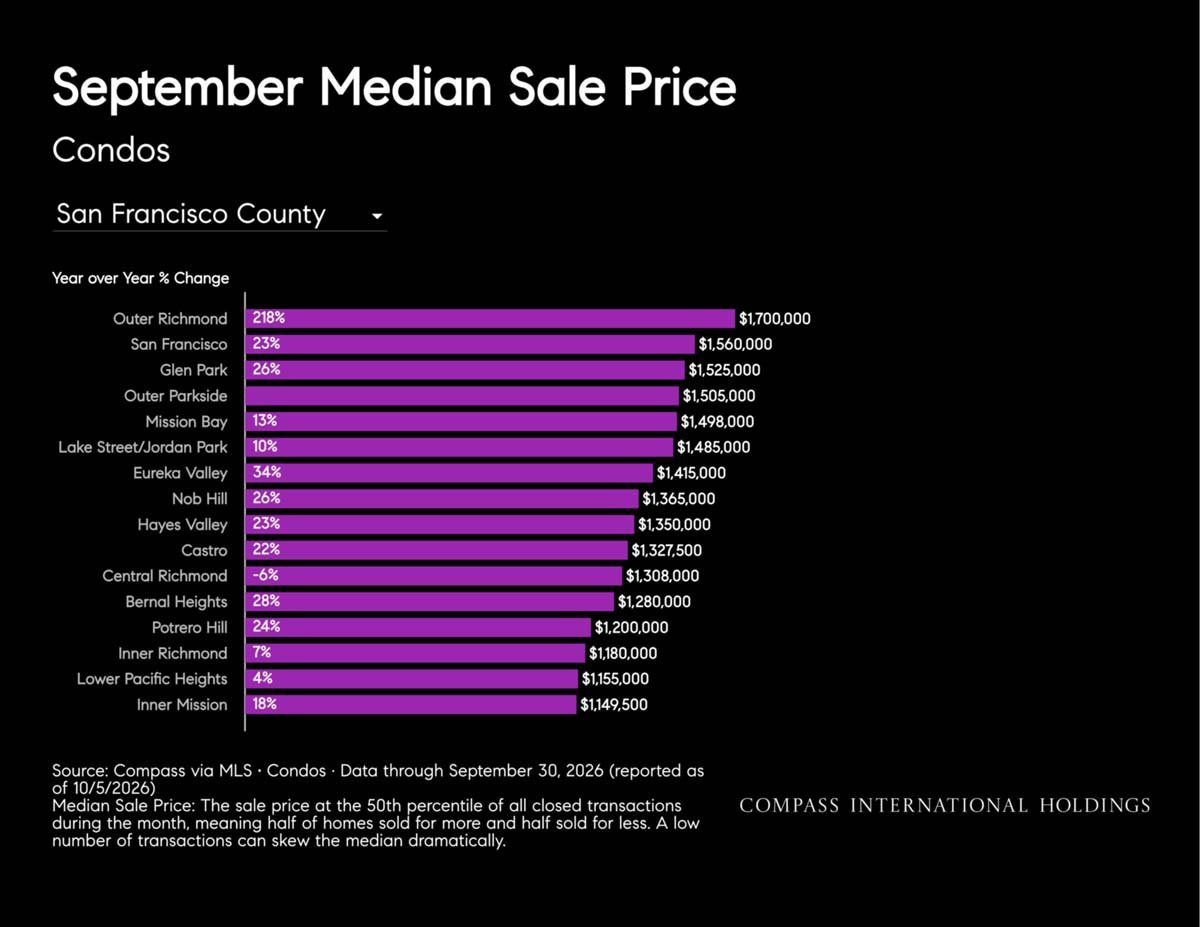
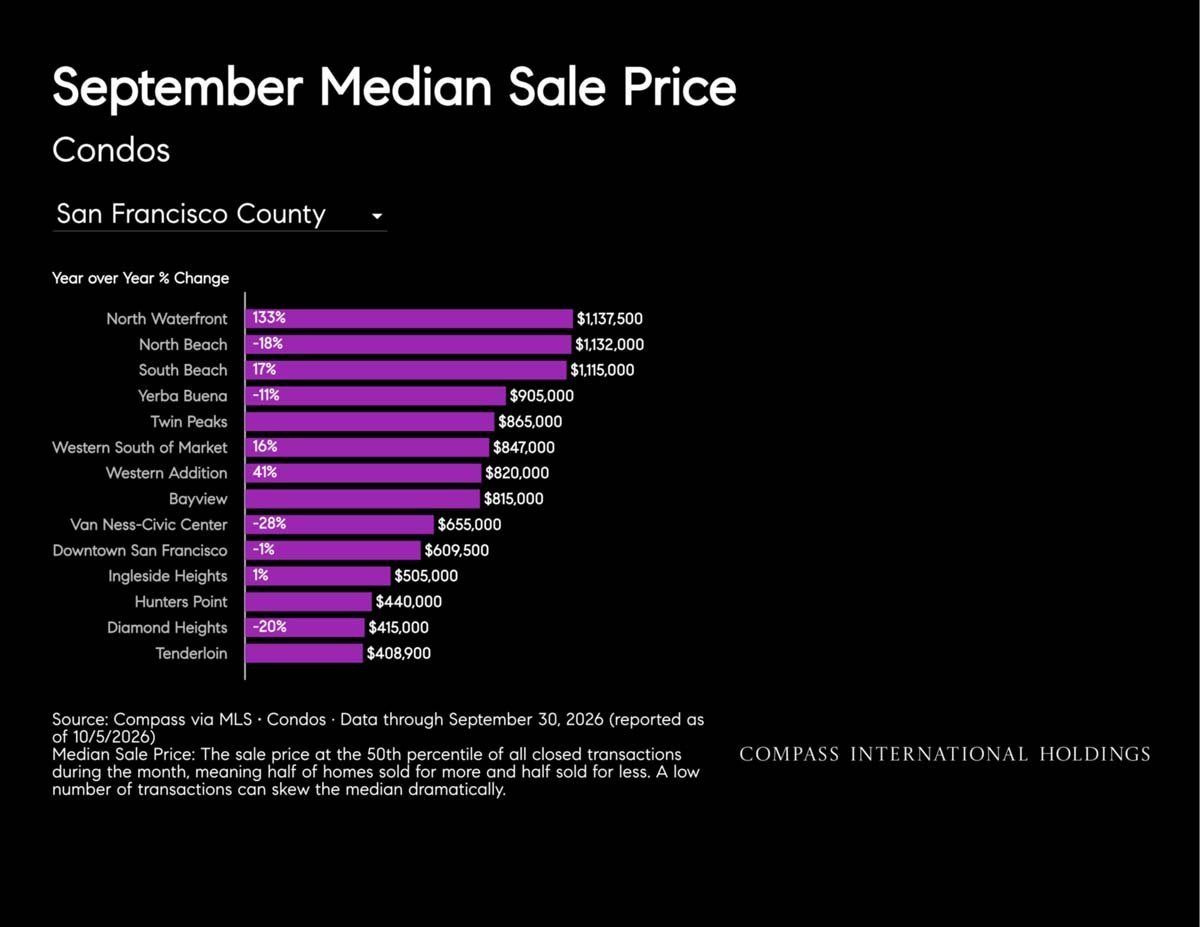
September median sale prices for San Francisco condos by neighborhood
September median condo sale prices by San Francisco neighborhood
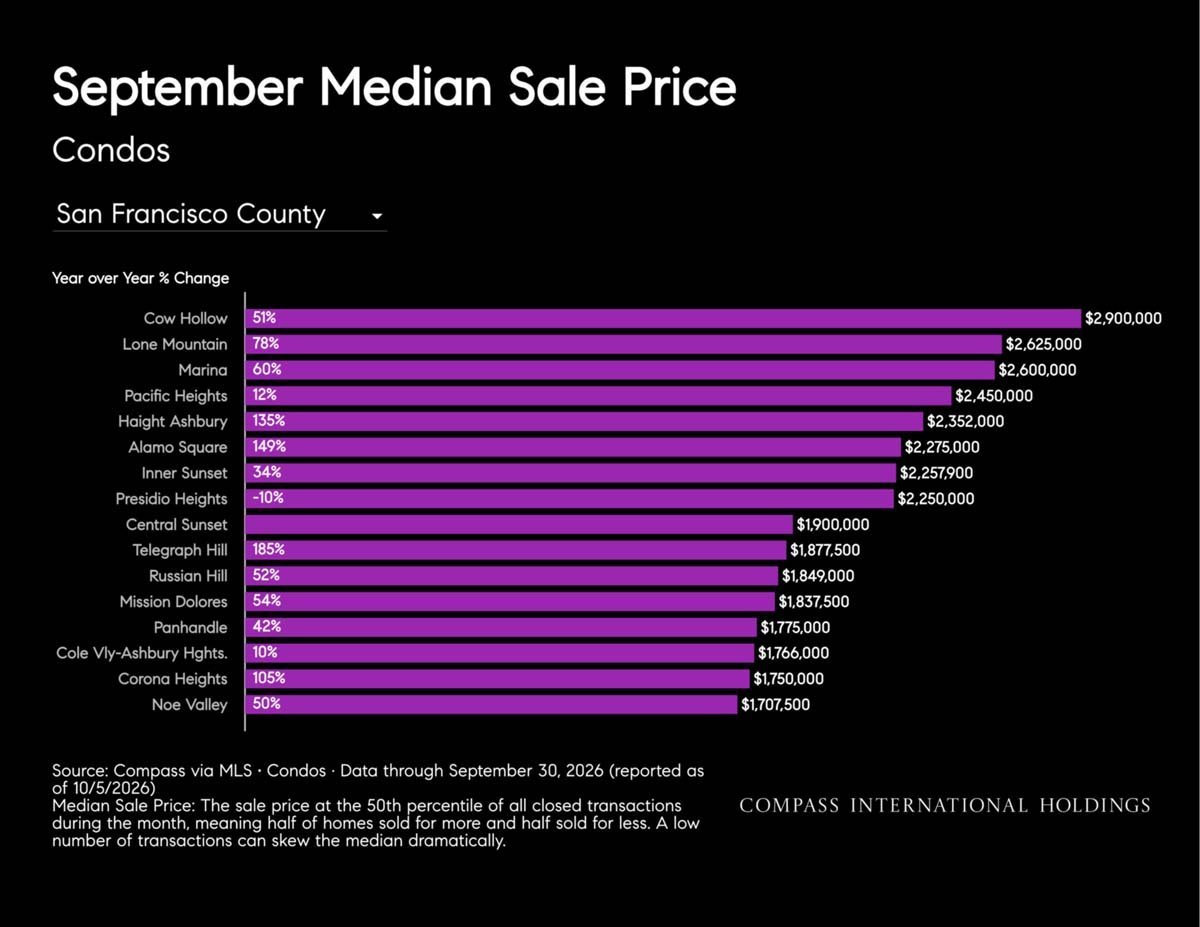
Chart of September San Francisco condo median sale prices by neighborhood, with year-over-year changes.
Bar chart of San Francisco County condo median price year-over-year change, Dec 2020–Sep 2026, ranging from −27% to 23%.
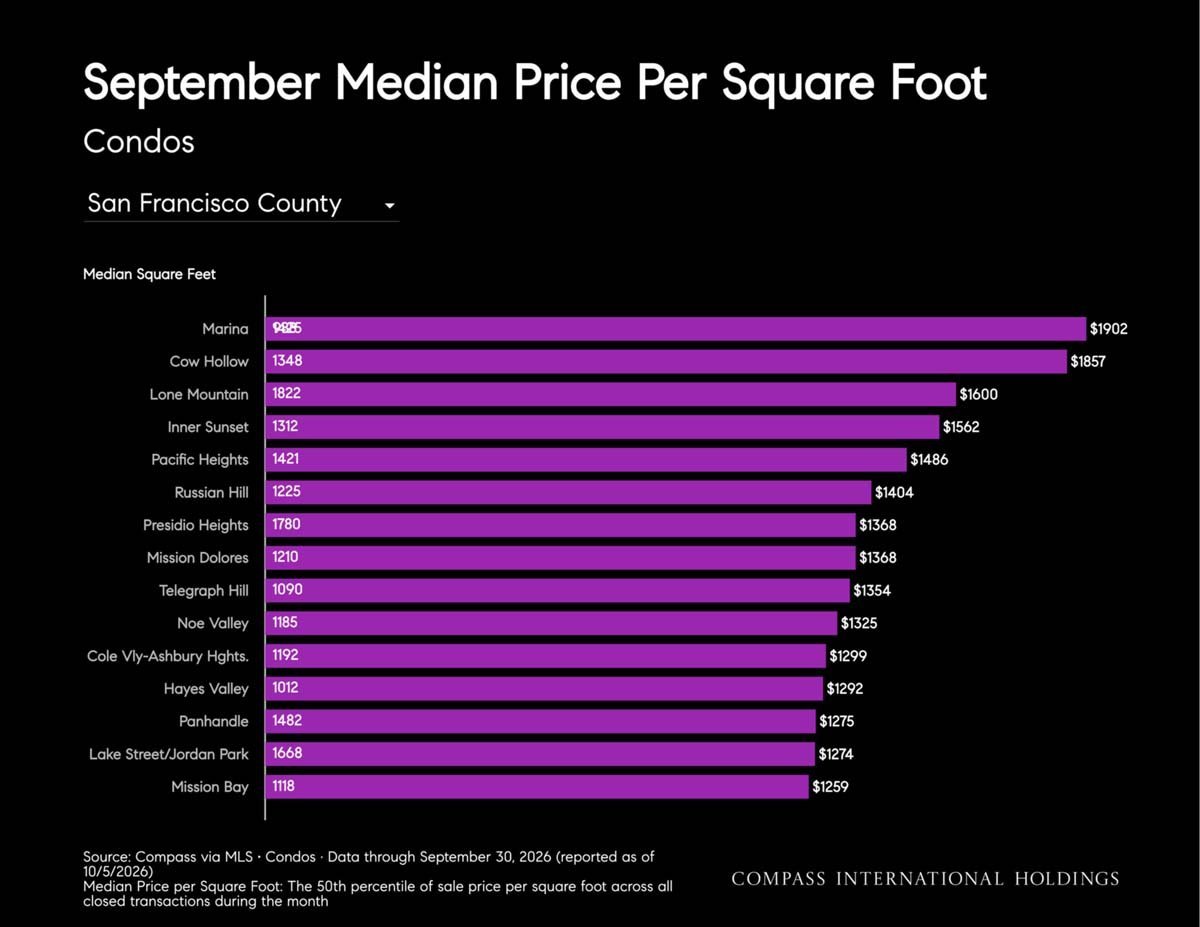
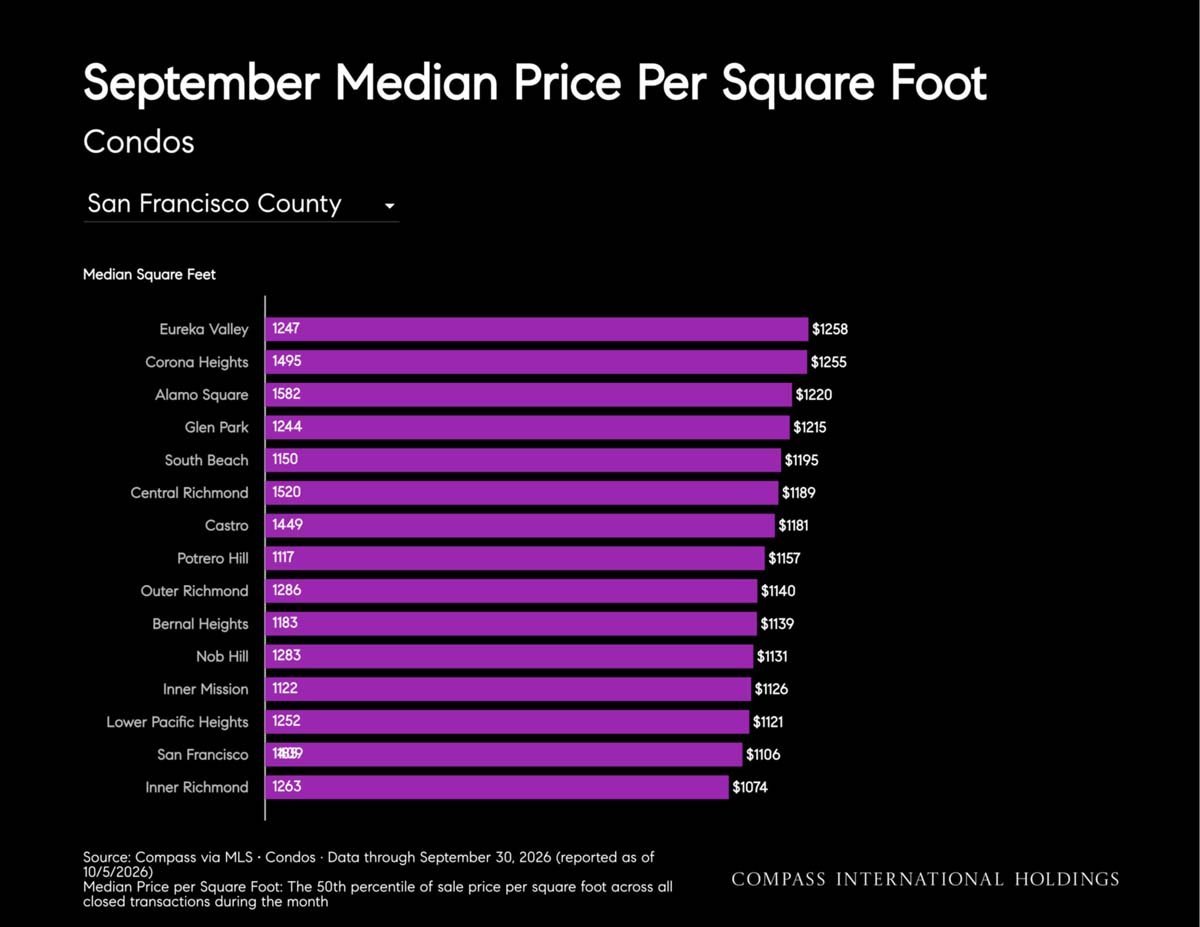
September median condo price per square foot by San Francisco neighborhood
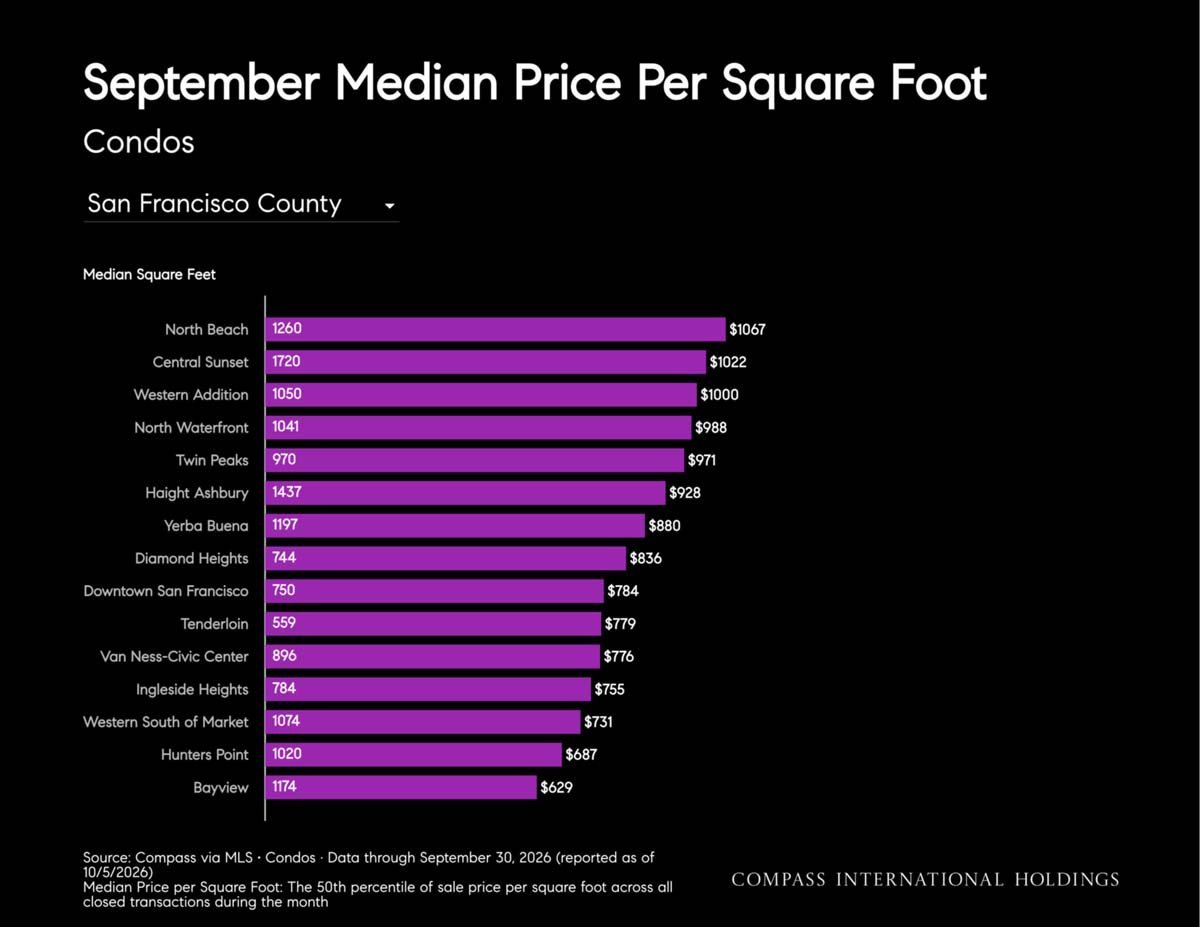
Bar chart of September condo price per square foot across San Francisco neighborhoods, led by North Beach at $1,067.
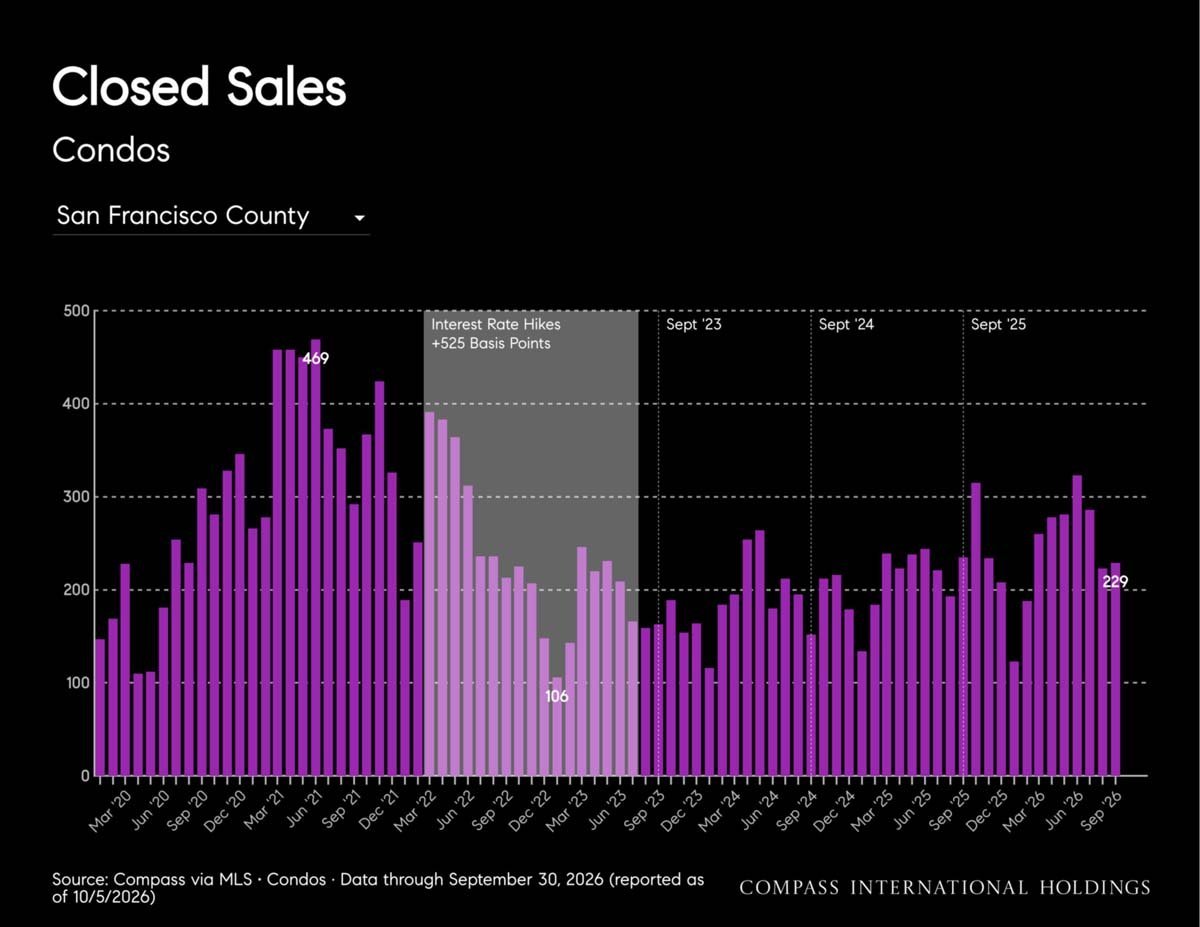
San Francisco County condo closed sales, March 2020–September 2026
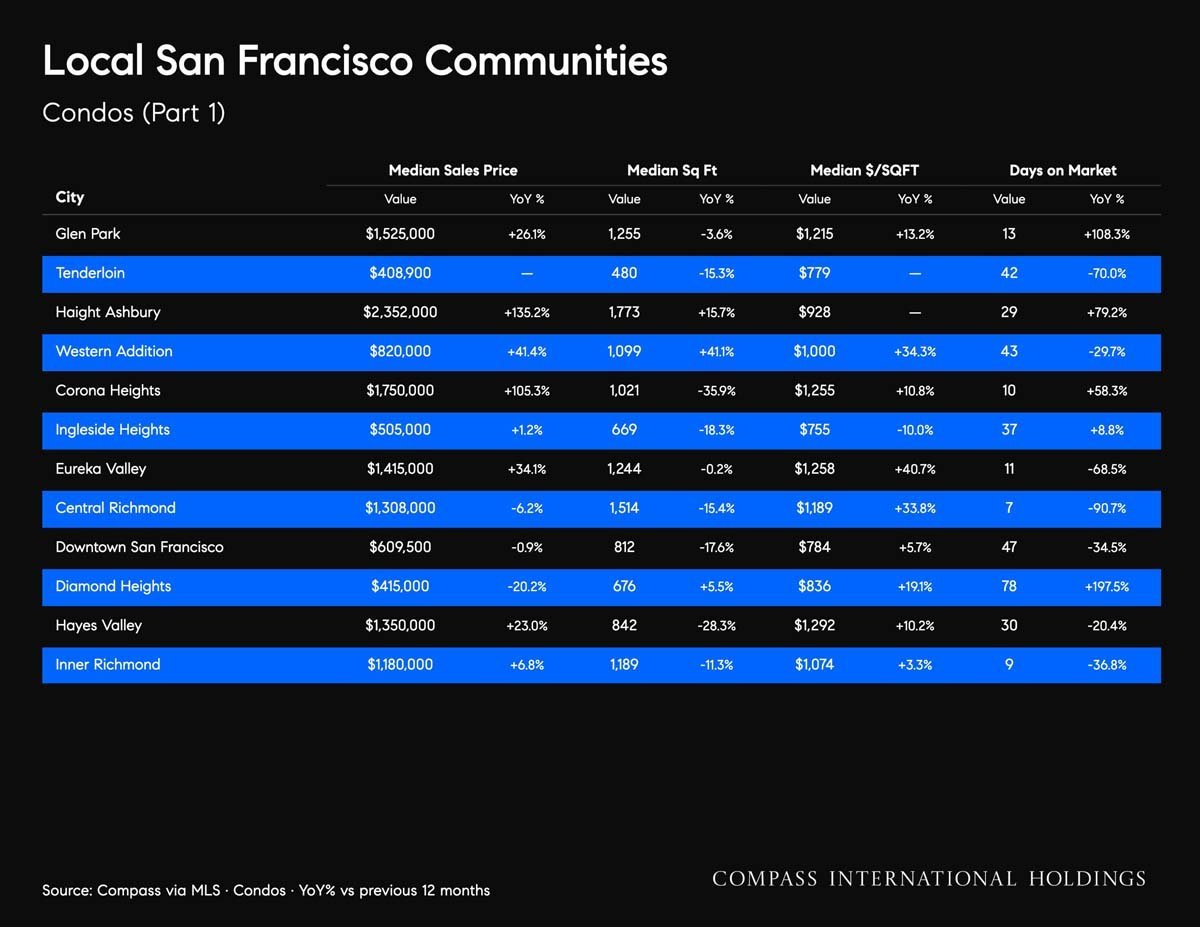
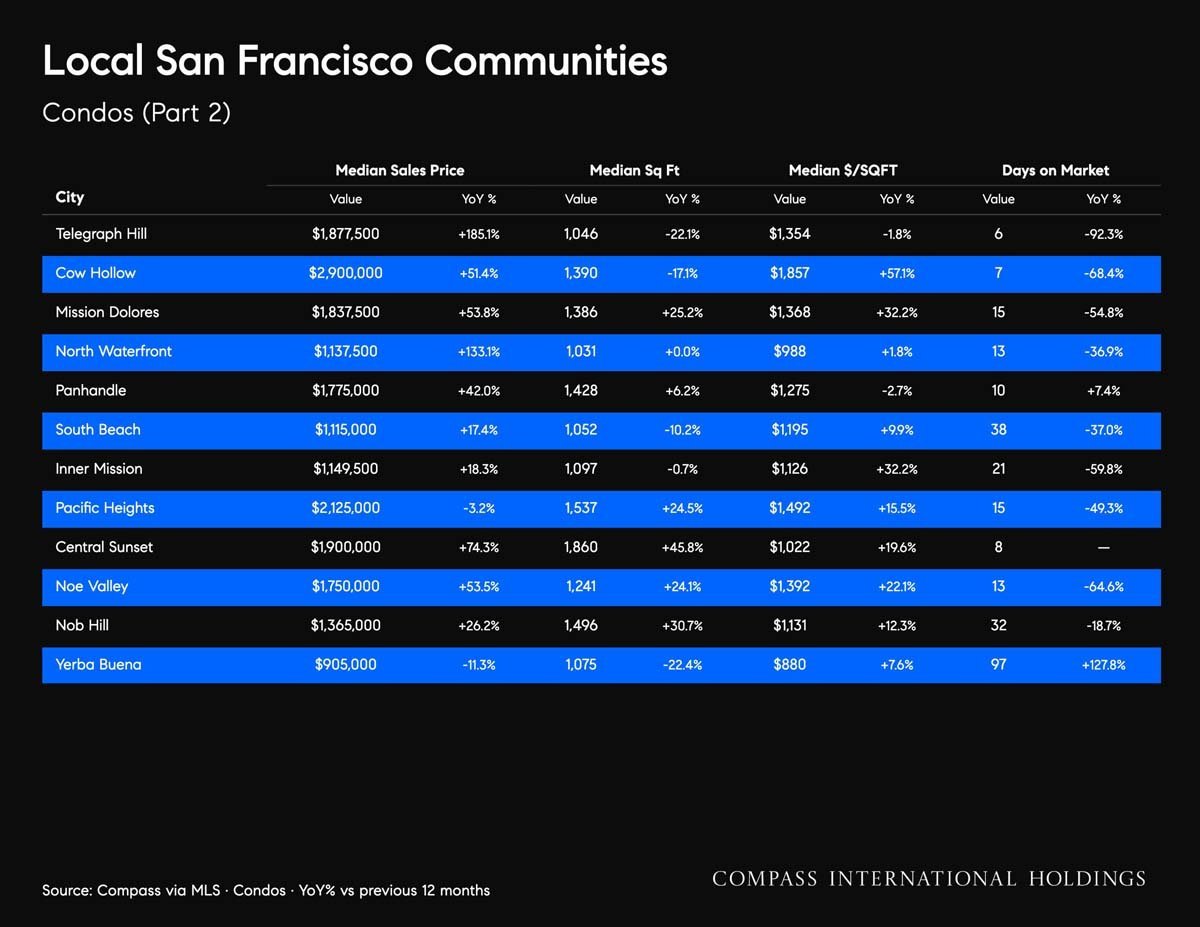
San Francisco condo market statistics by neighborhood, including median sale price, square footage, and days on market.
October 2026 San Francisco condo market outlook by neighborhood, with median prices, square footage, and days on market.
San Francisco condo market infographic comparing prices, square footage, and days on market across eight communities.
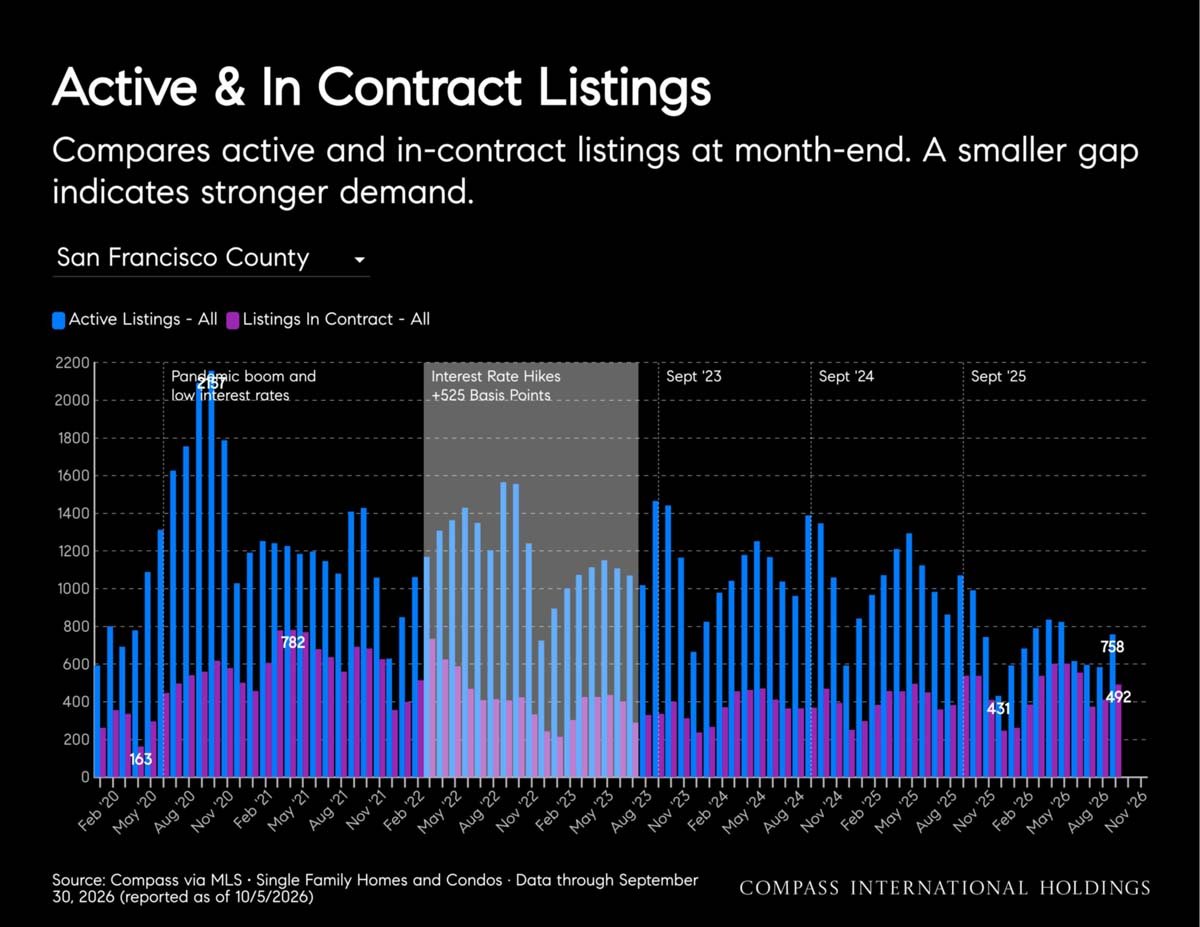
Chart comparing active and in-contract San Francisco County listings from February 2020 through September 2026.
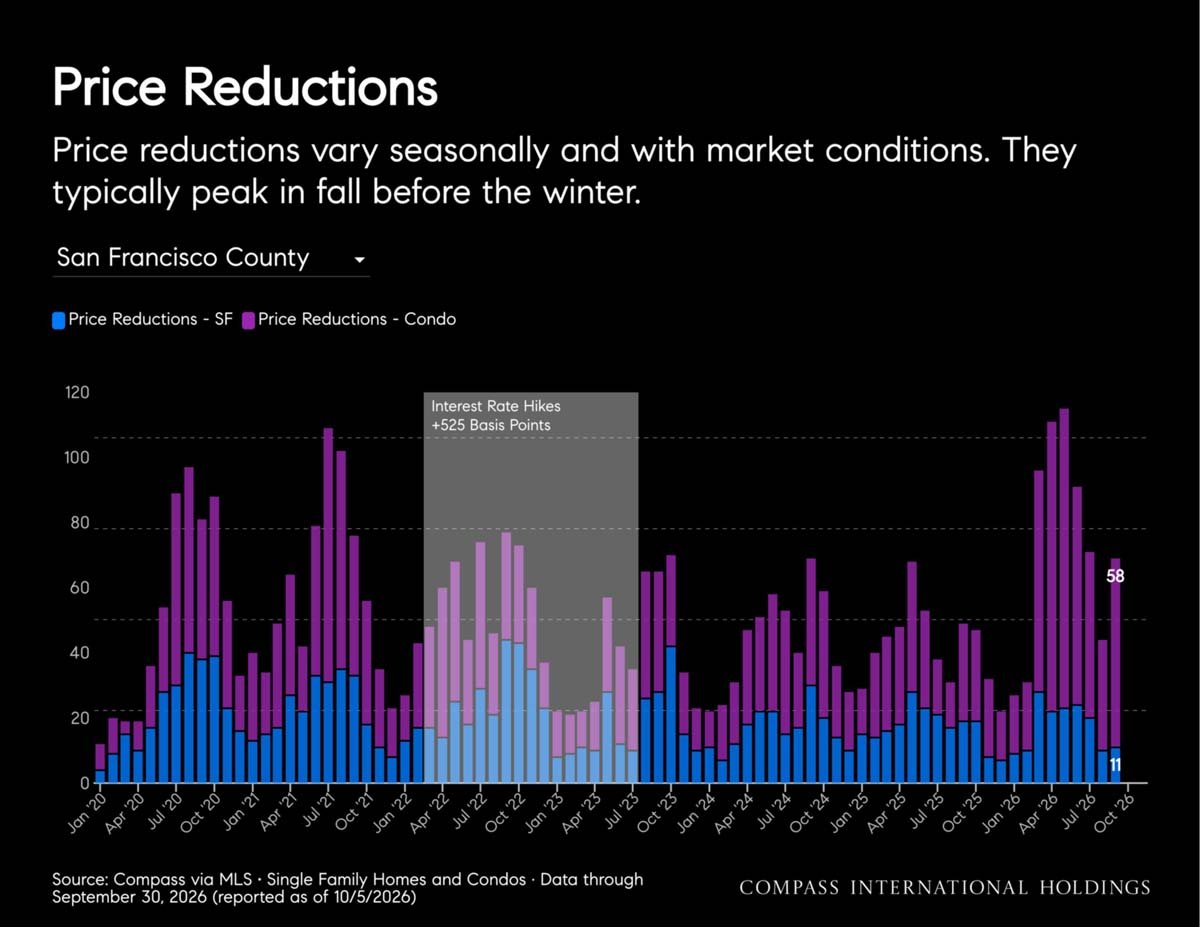
Bar chart comparing monthly San Francisco single-family home and condo price reductions from 2020 through October 2026.
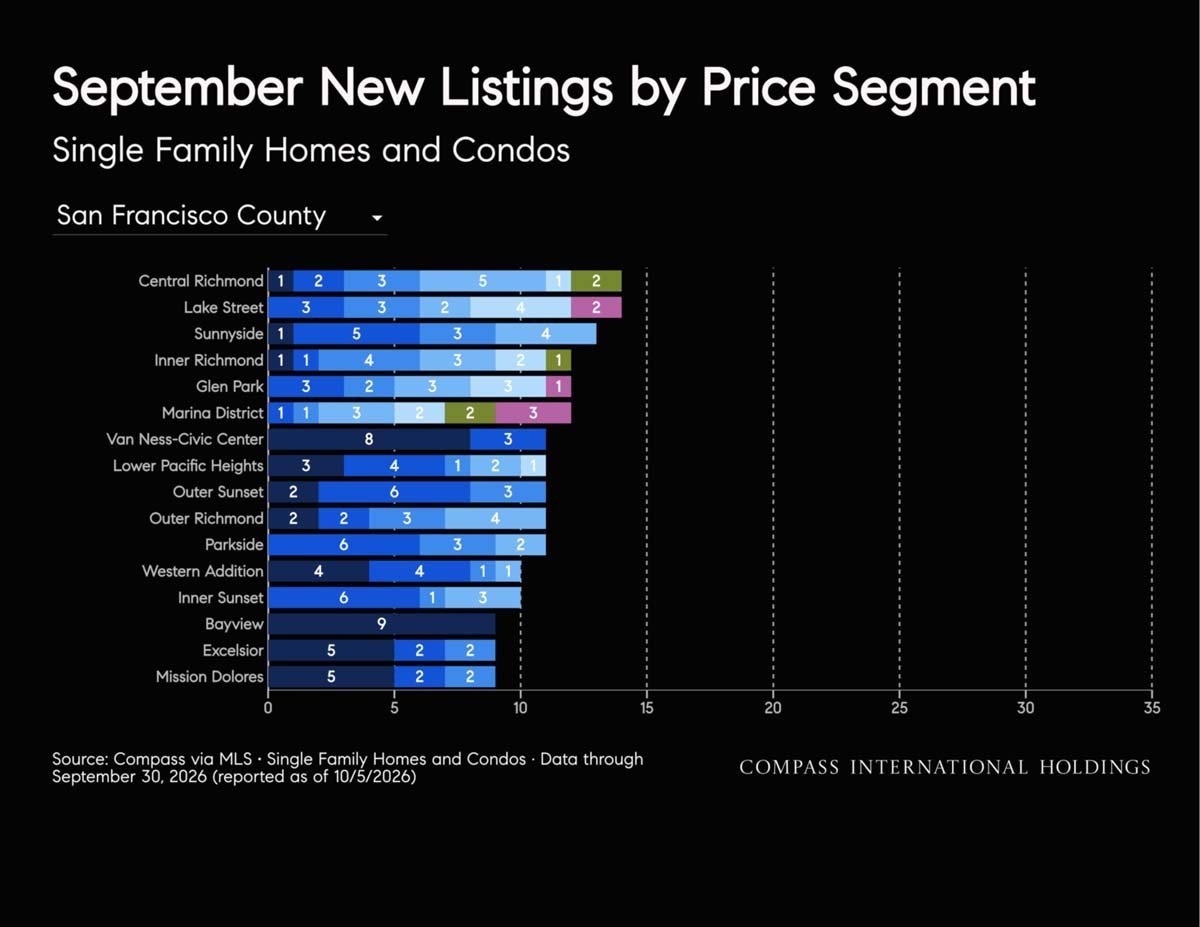
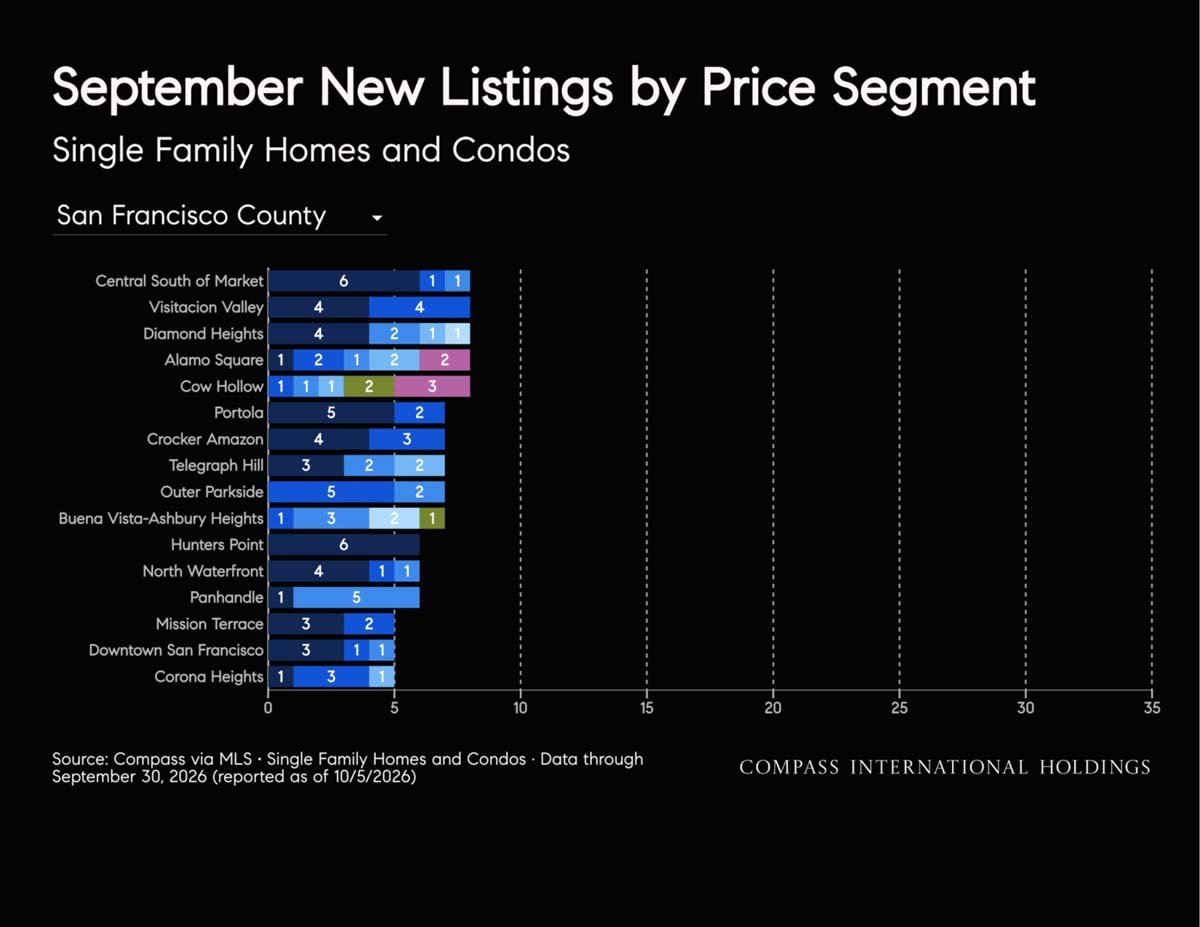
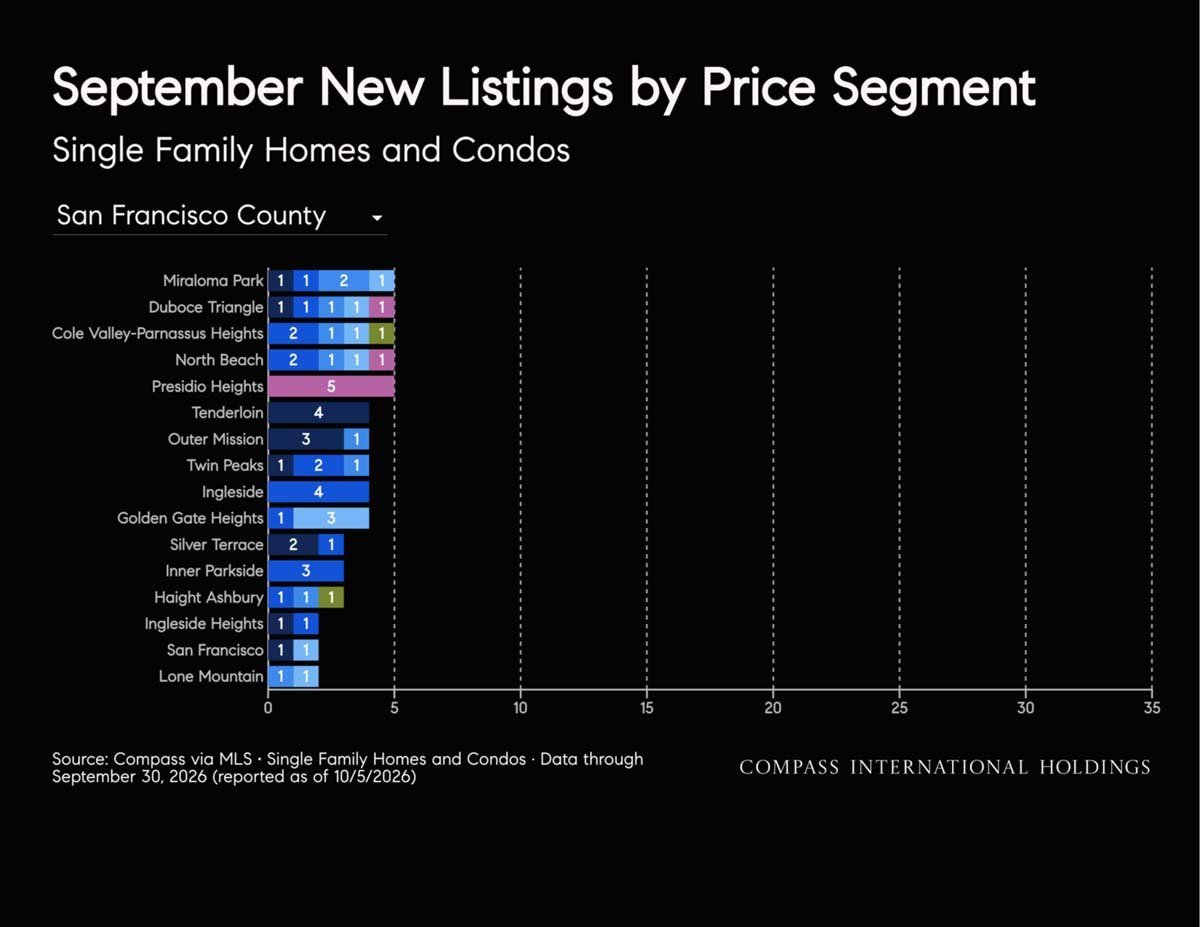
Stacked bar chart of September San Francisco new listings by neighborhood and price segment.
Chart showing September new listings by price segment across San Francisco neighborhoods.
Chart of September new listings by price segment across San Francisco neighborhoods.
September new listings by price segment in San Francisco County, shown by neighborhood for single-family homes and condos.
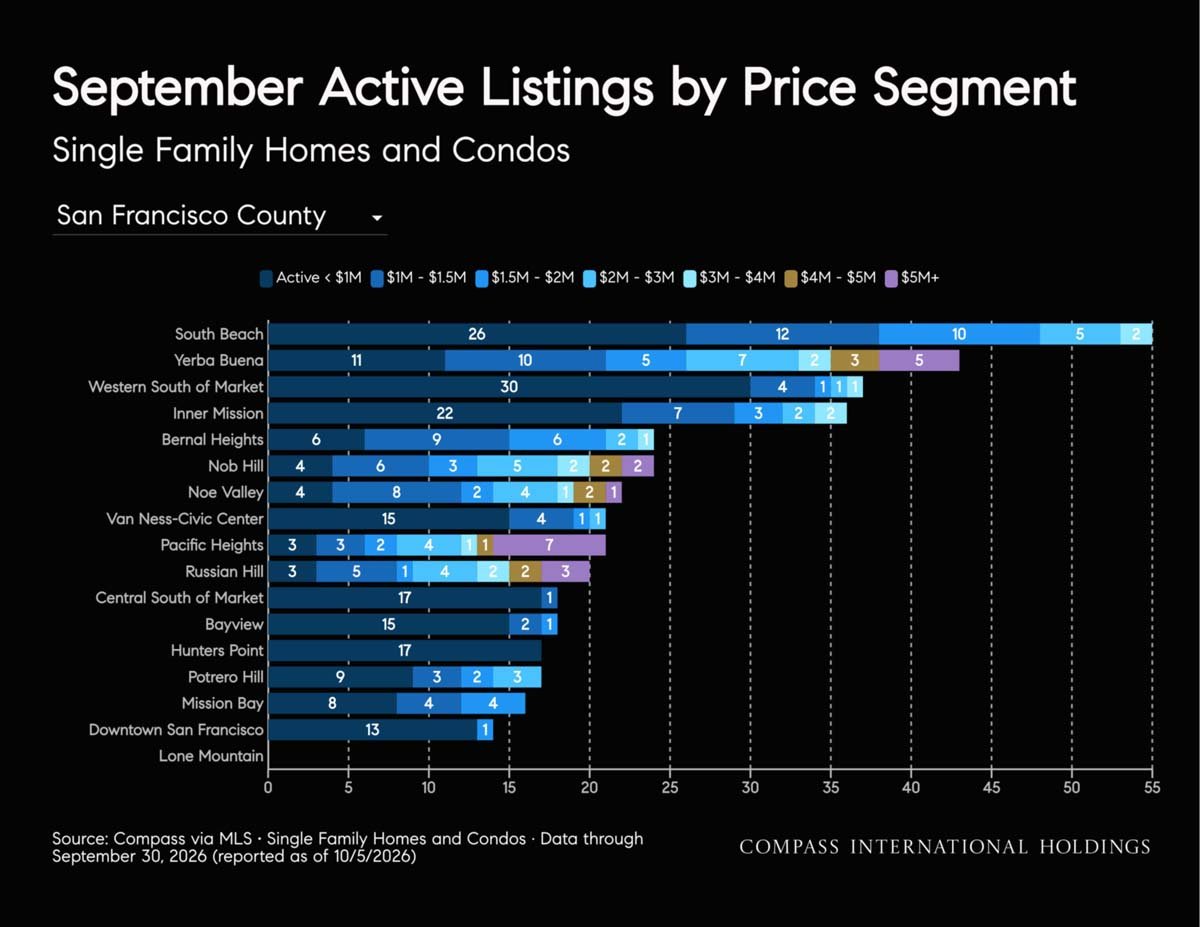
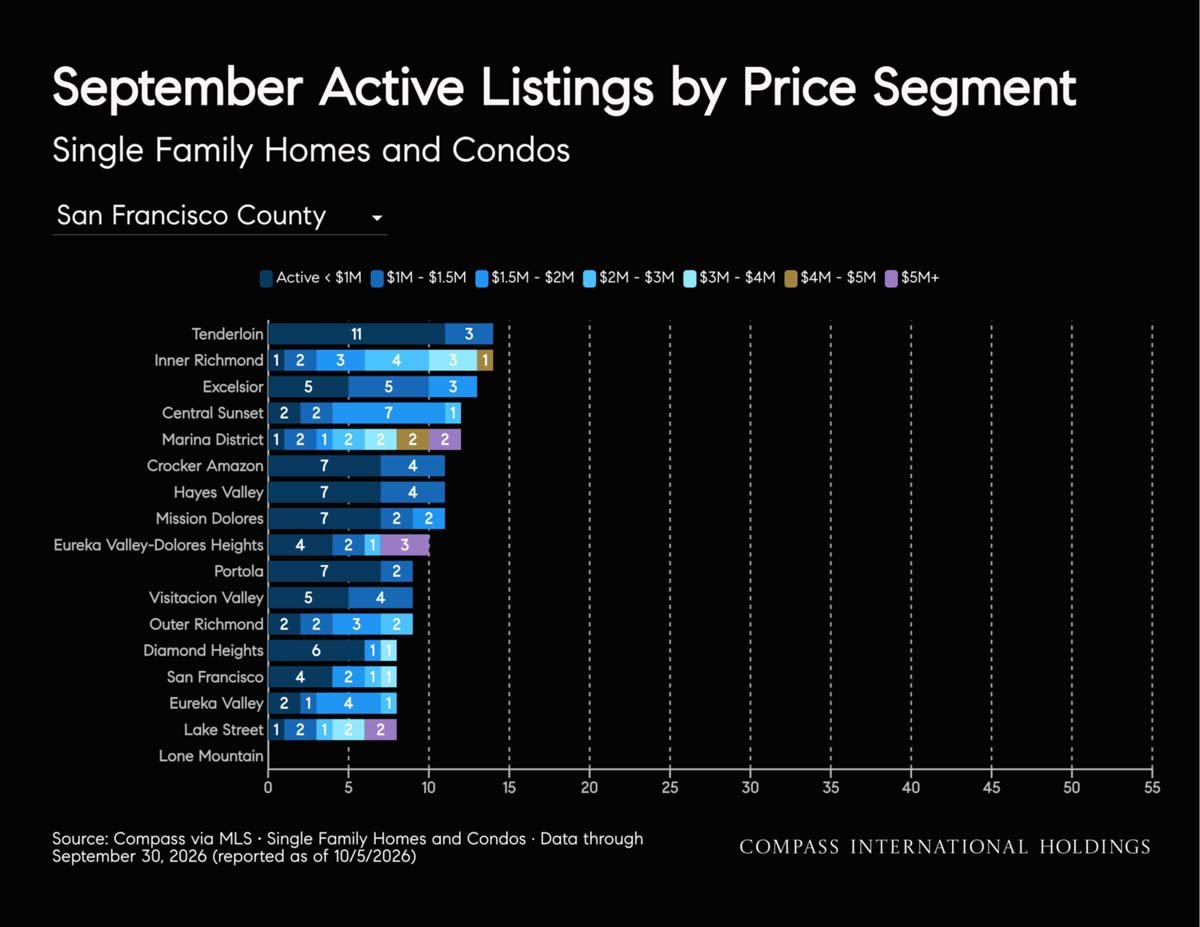
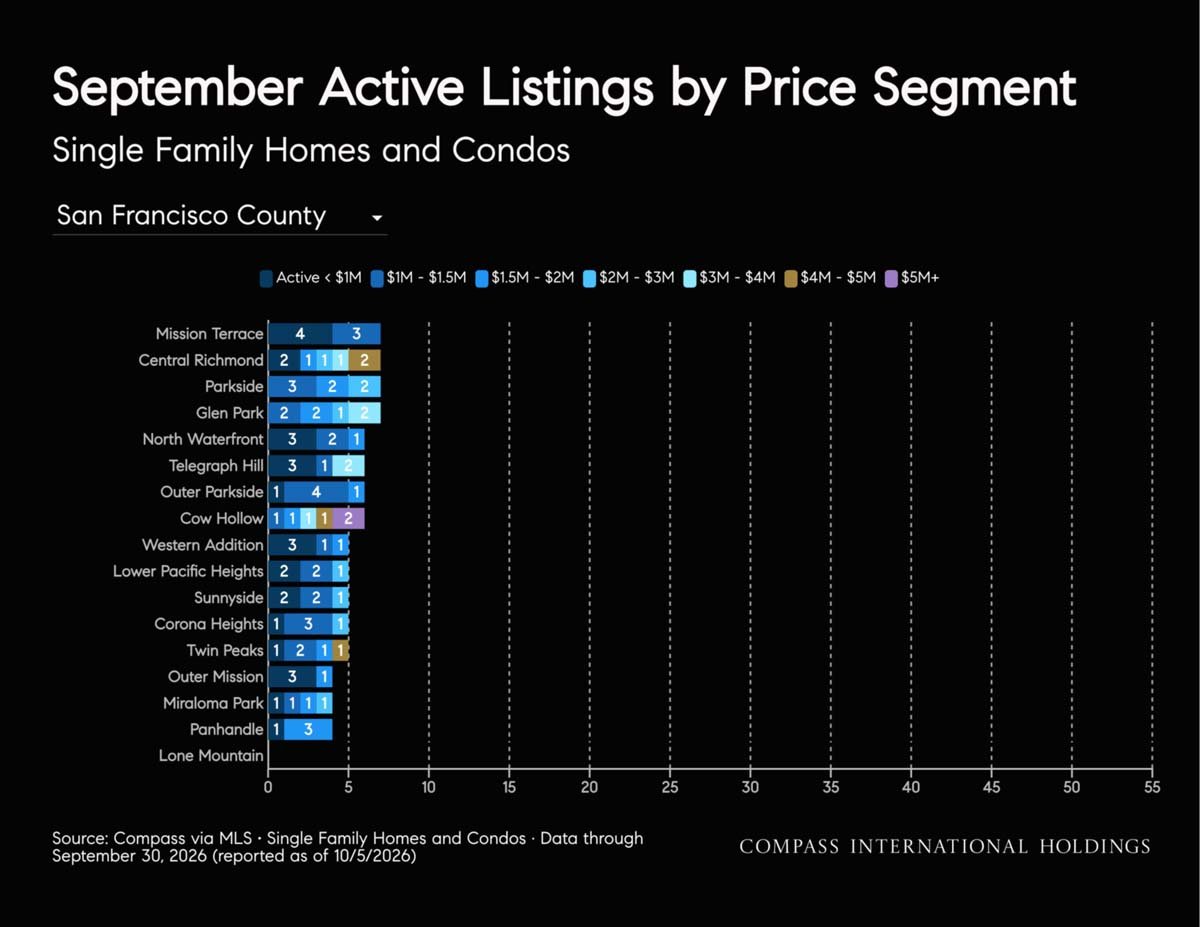
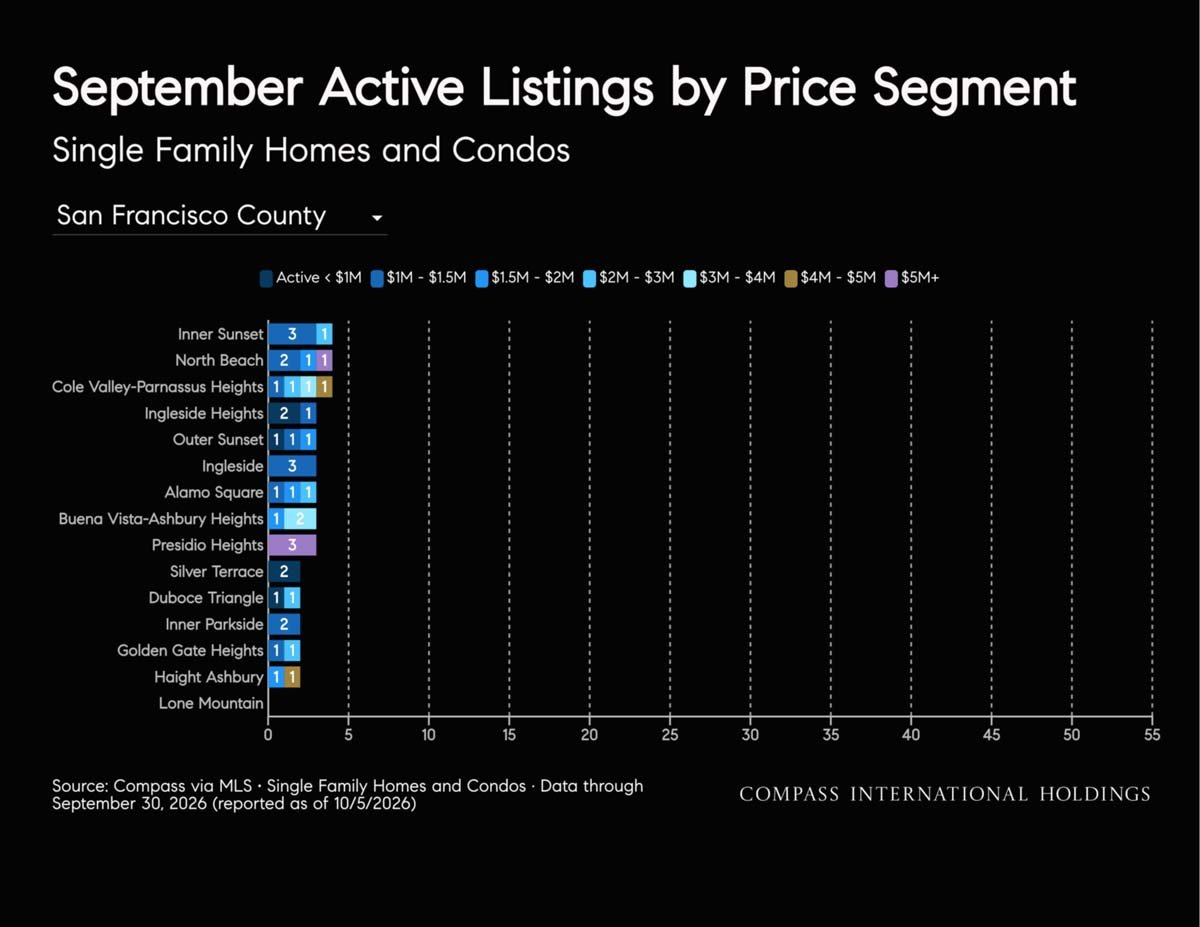
September active San Francisco listings by neighborhood and price segment.
September active San Francisco listings by price segment, shown in a neighborhood-by-neighborhood bar chart.
September active San Francisco listings by price segment, charted by neighborhood for single-family homes and condos.
Bar chart of September active home and condo listings by price segment across San Francisco neighborhoods.
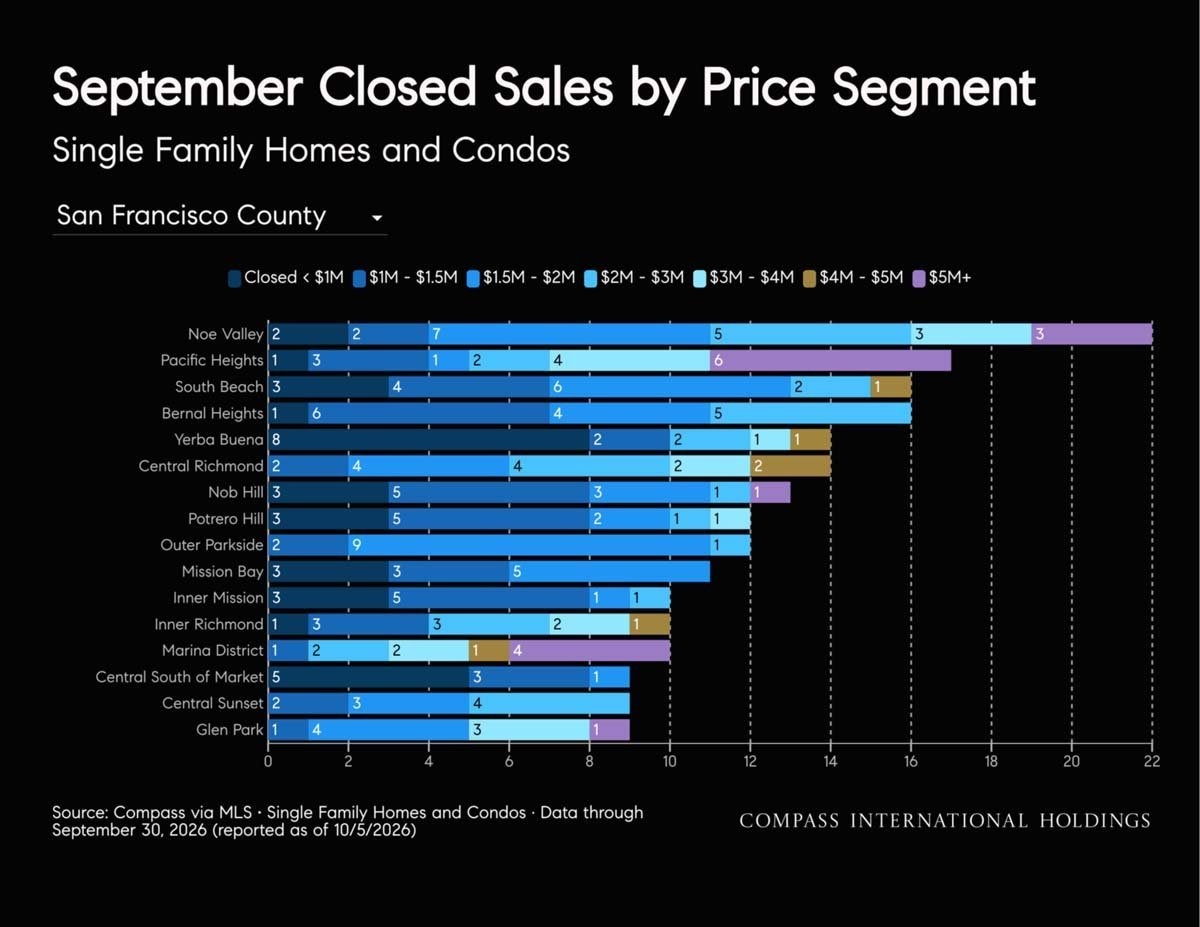
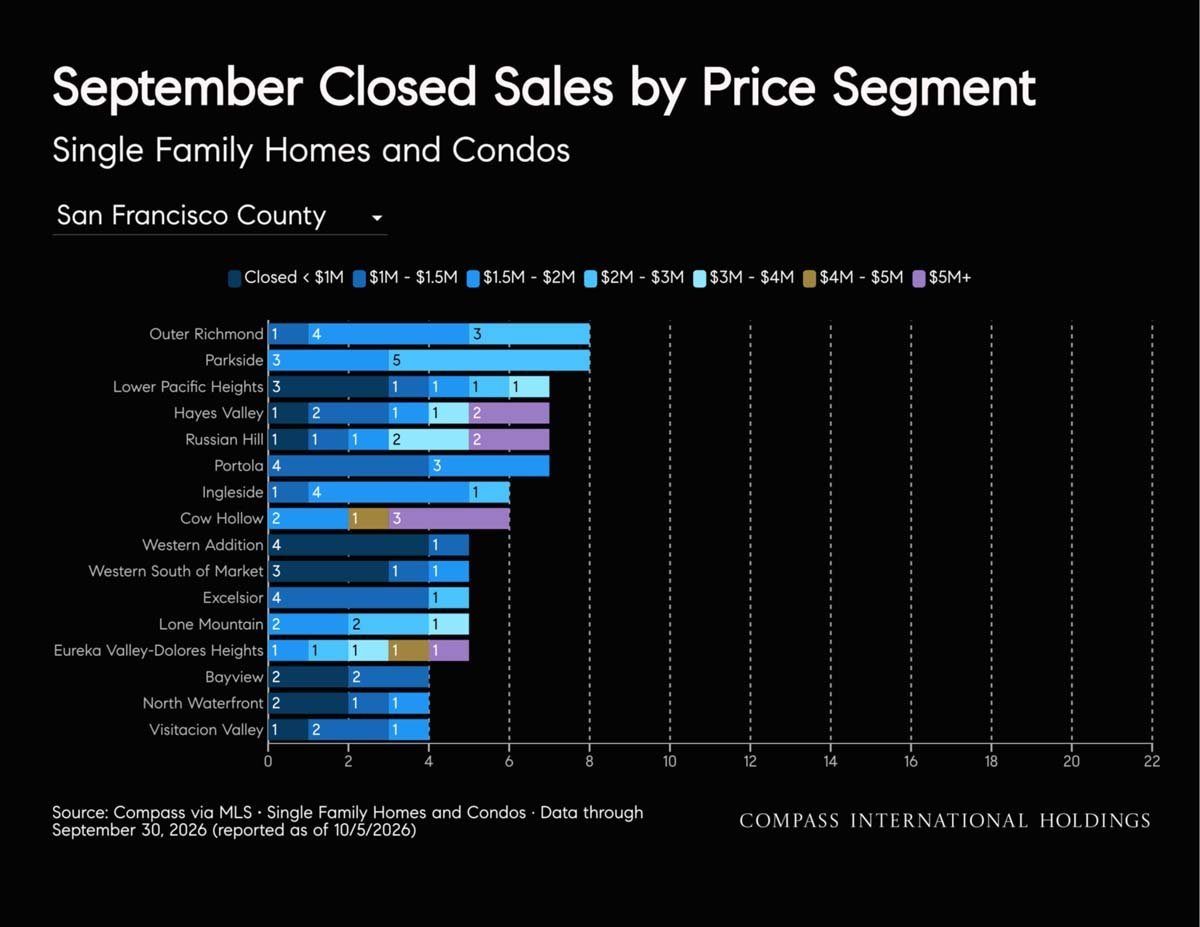
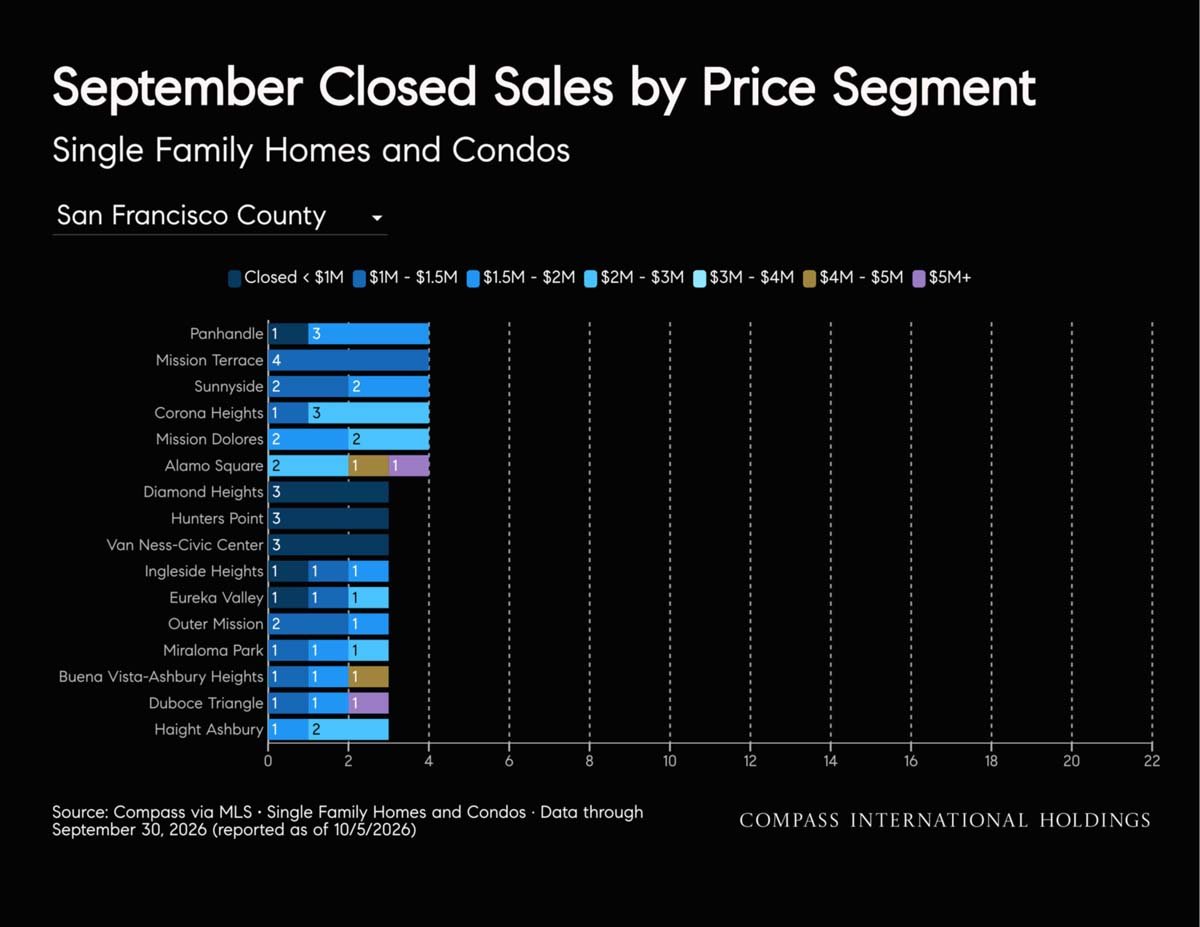
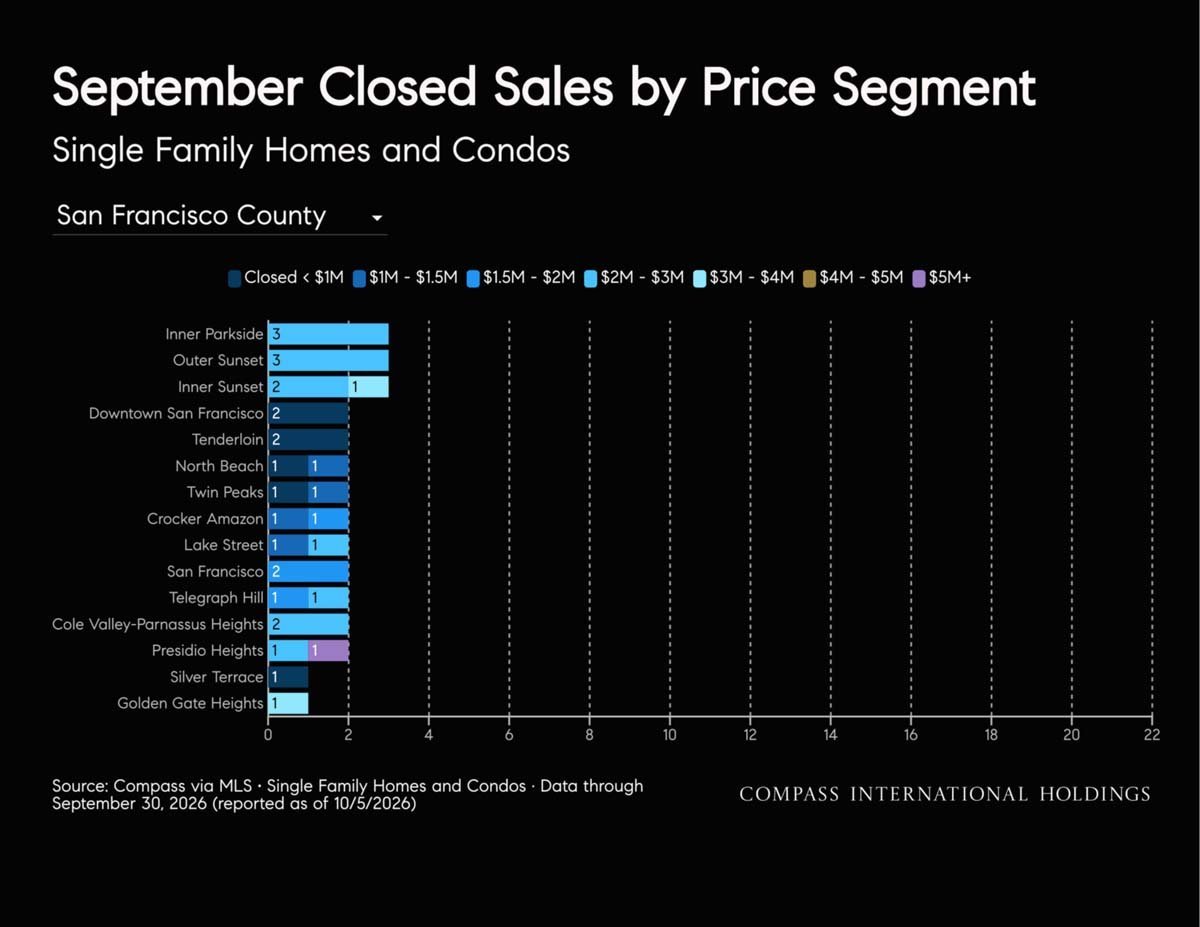
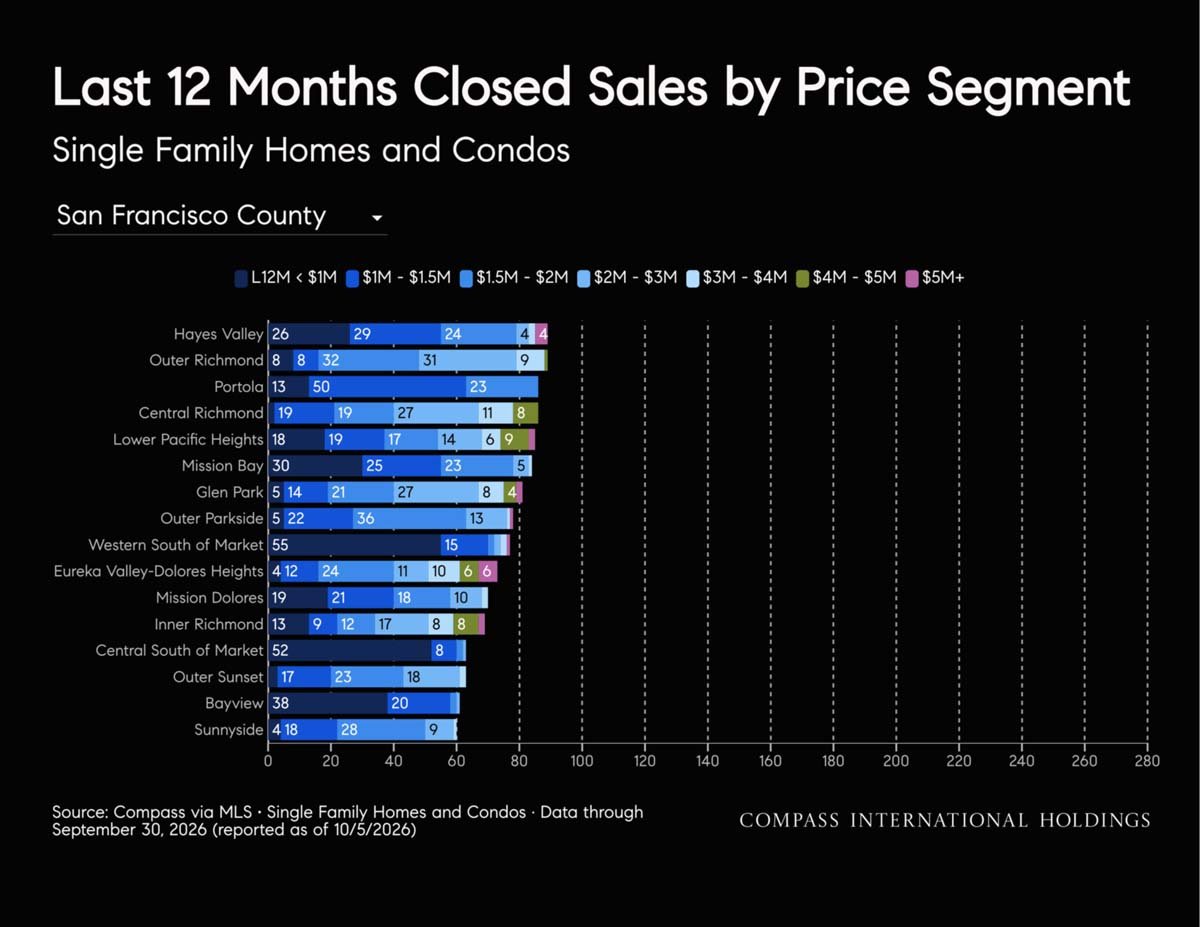
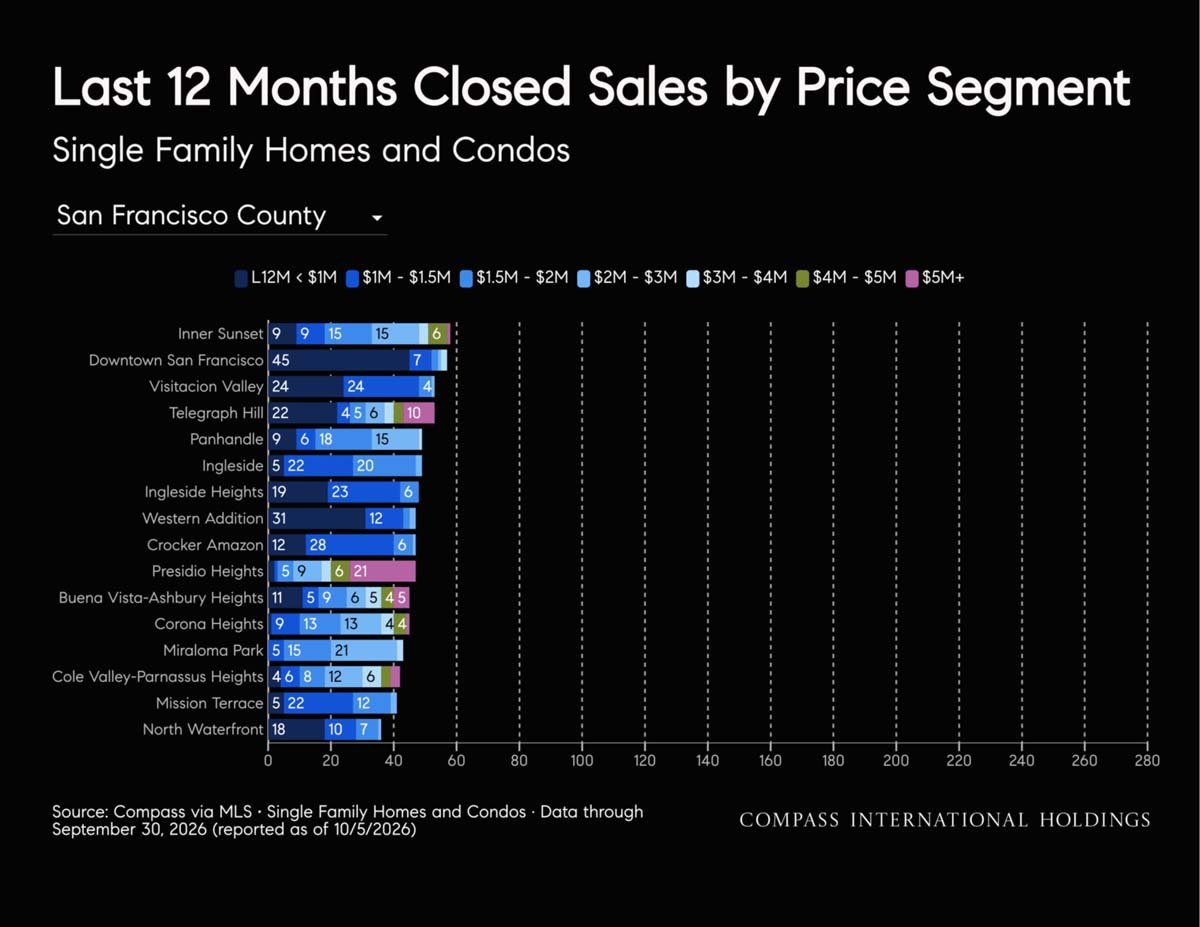
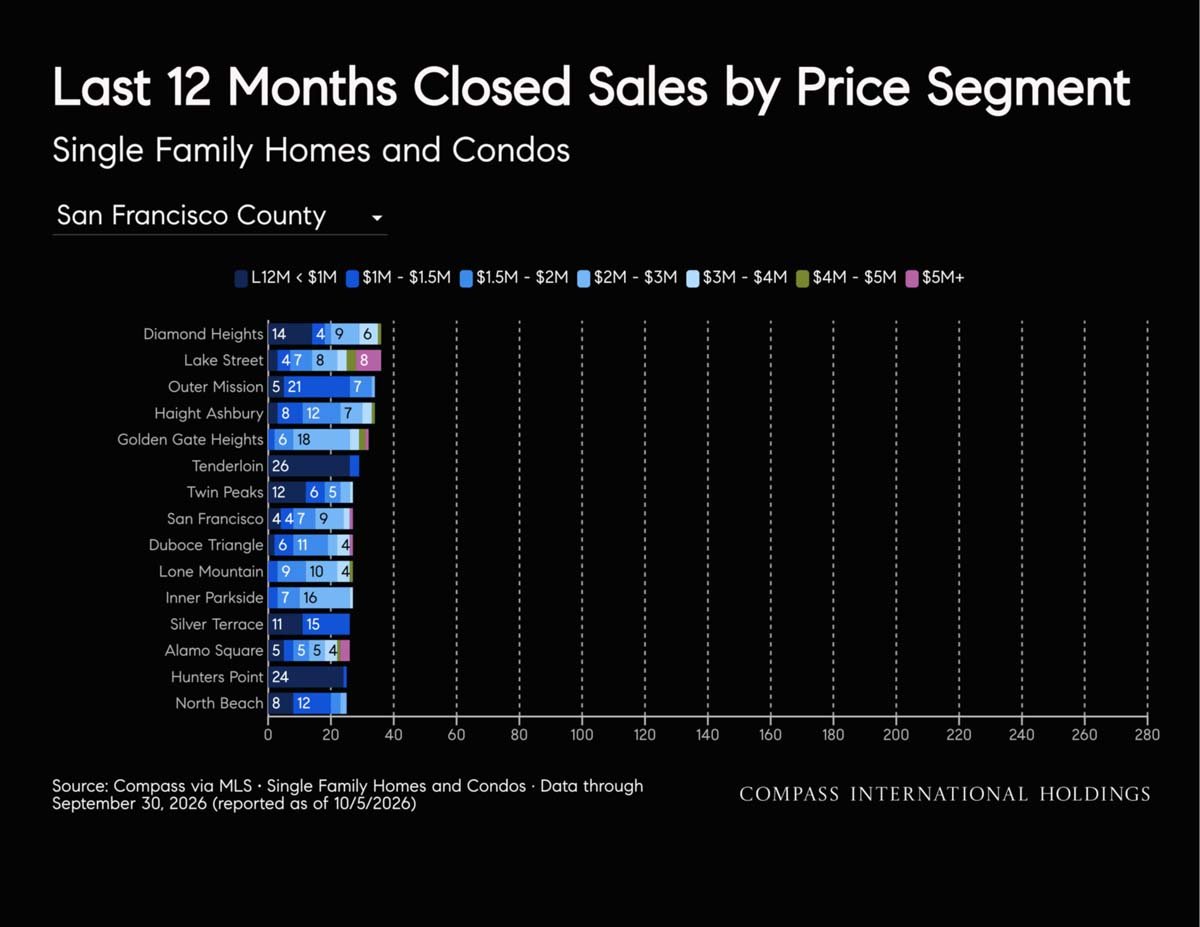
September closed home and condo sales by price segment across San Francisco neighborhoods.
Chart of September 2026 San Francisco closed home and condo sales by neighborhood and price segment.
September closed sales by price segment for San Francisco neighborhoods.
Stacked bar chart of San Francisco home and condo sales by neighborhood and price segment.
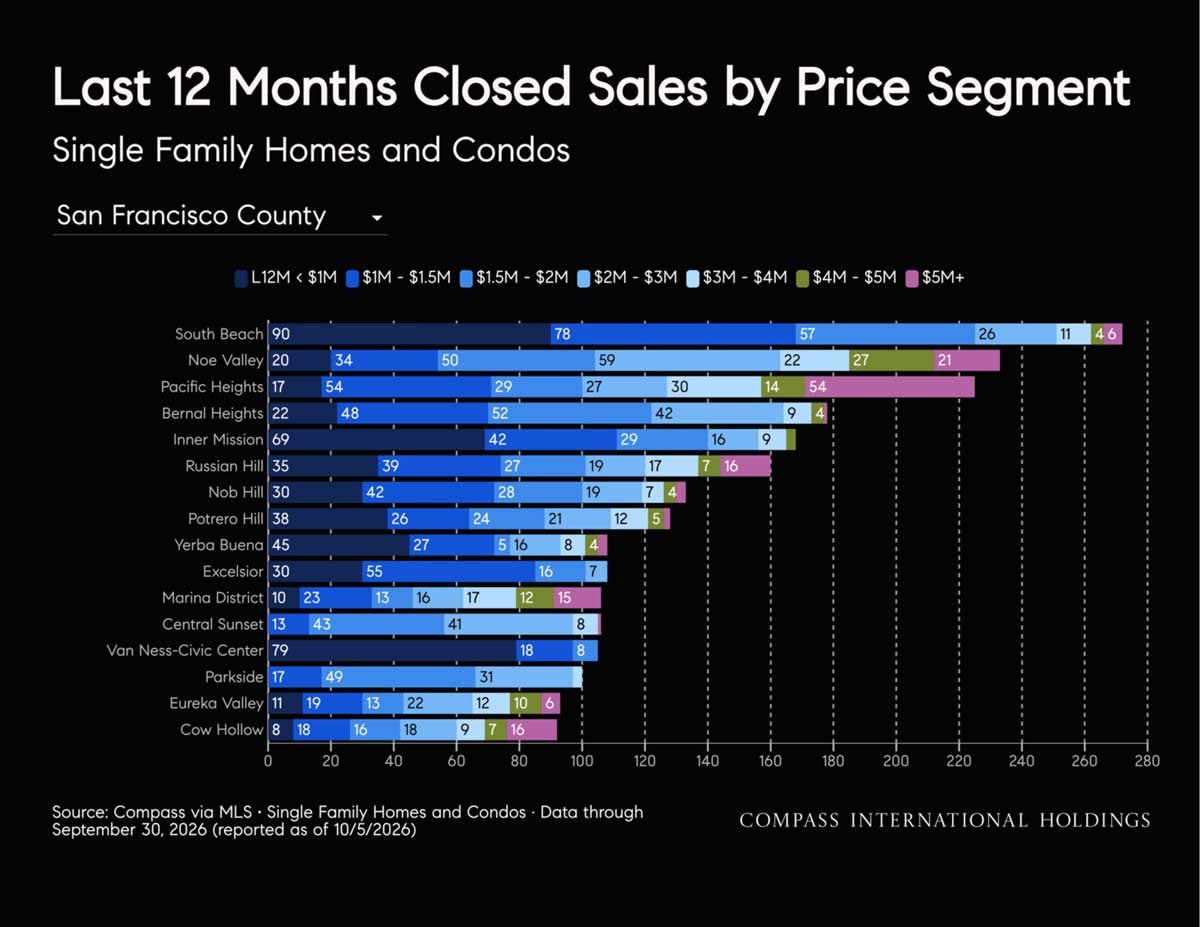
Stacked bar chart of San Francisco neighborhood home and condo sales by price segment over the last 12 months.
San Francisco closed home sales by neighborhood and price segment over the last 12 months.
Bar chart comparing San Francisco neighborhood home and condo sales across price segments over the last 12 months.
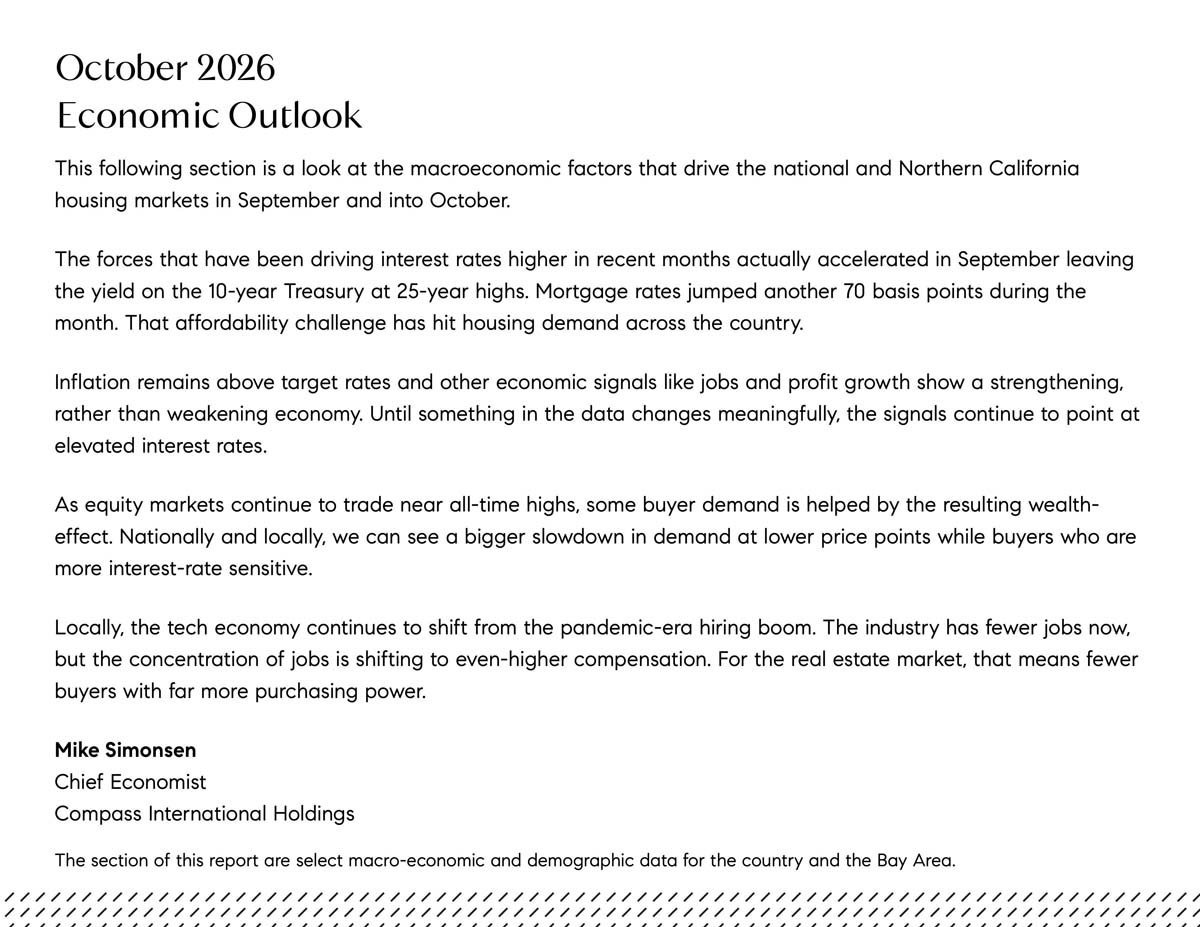
October 2026 economic outlook on interest rates, inflation, housing demand, and the Bay Area tech economy.
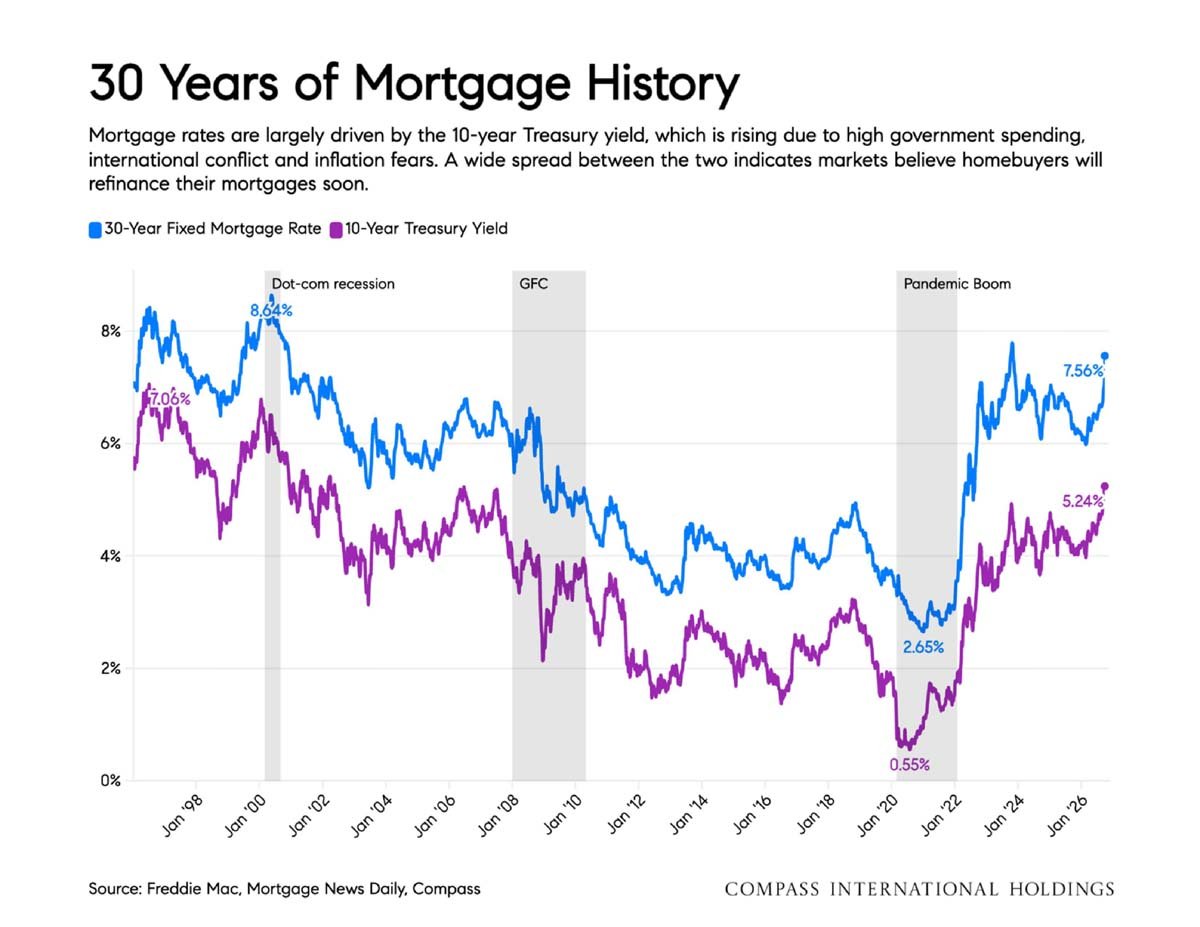
Thirty-year chart comparing fixed mortgage rates with the 10-year Treasury yield.
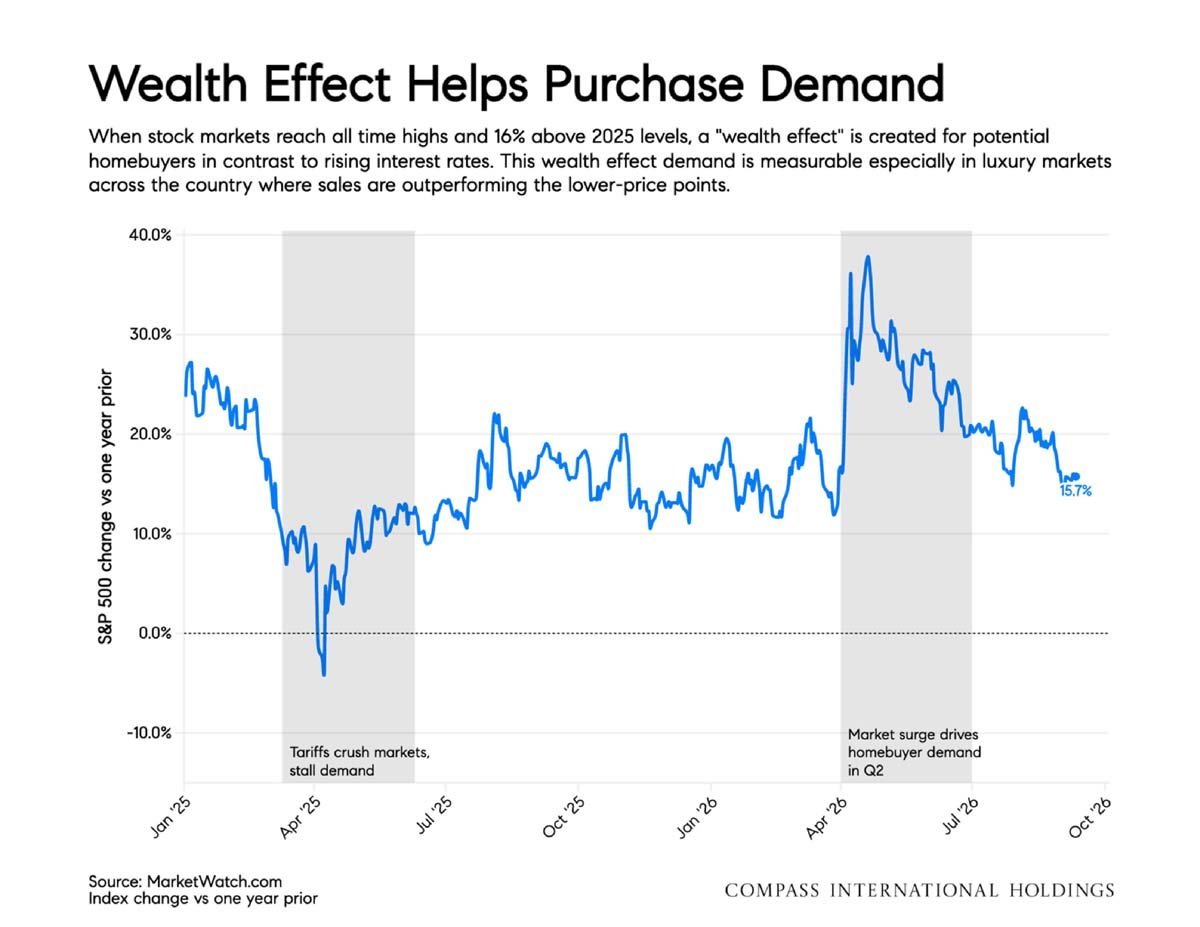
Chart showing S&P 500 gains year over year, with a sharp surge in Q2 2026.
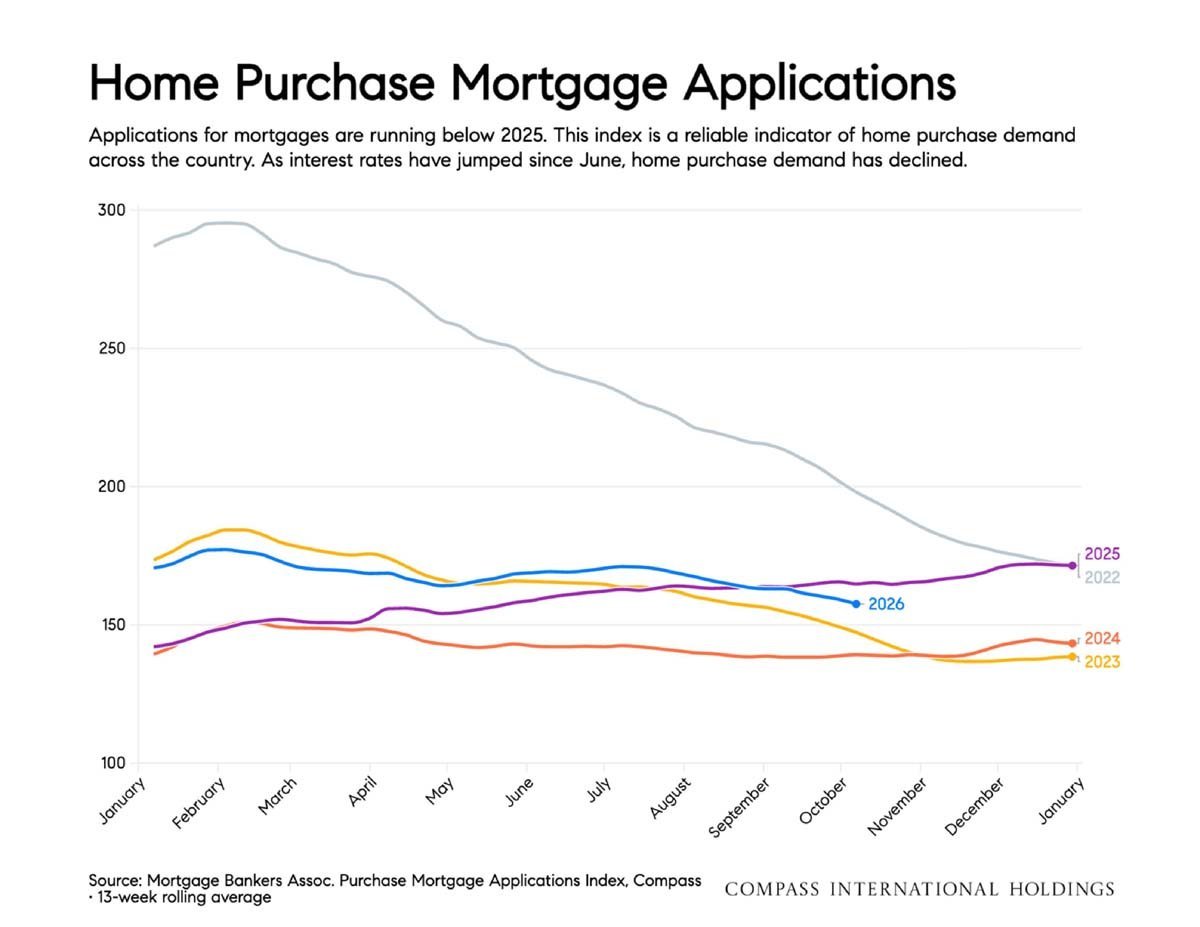
Chart showing home purchase mortgage applications declining in 2026 after rising through summer.
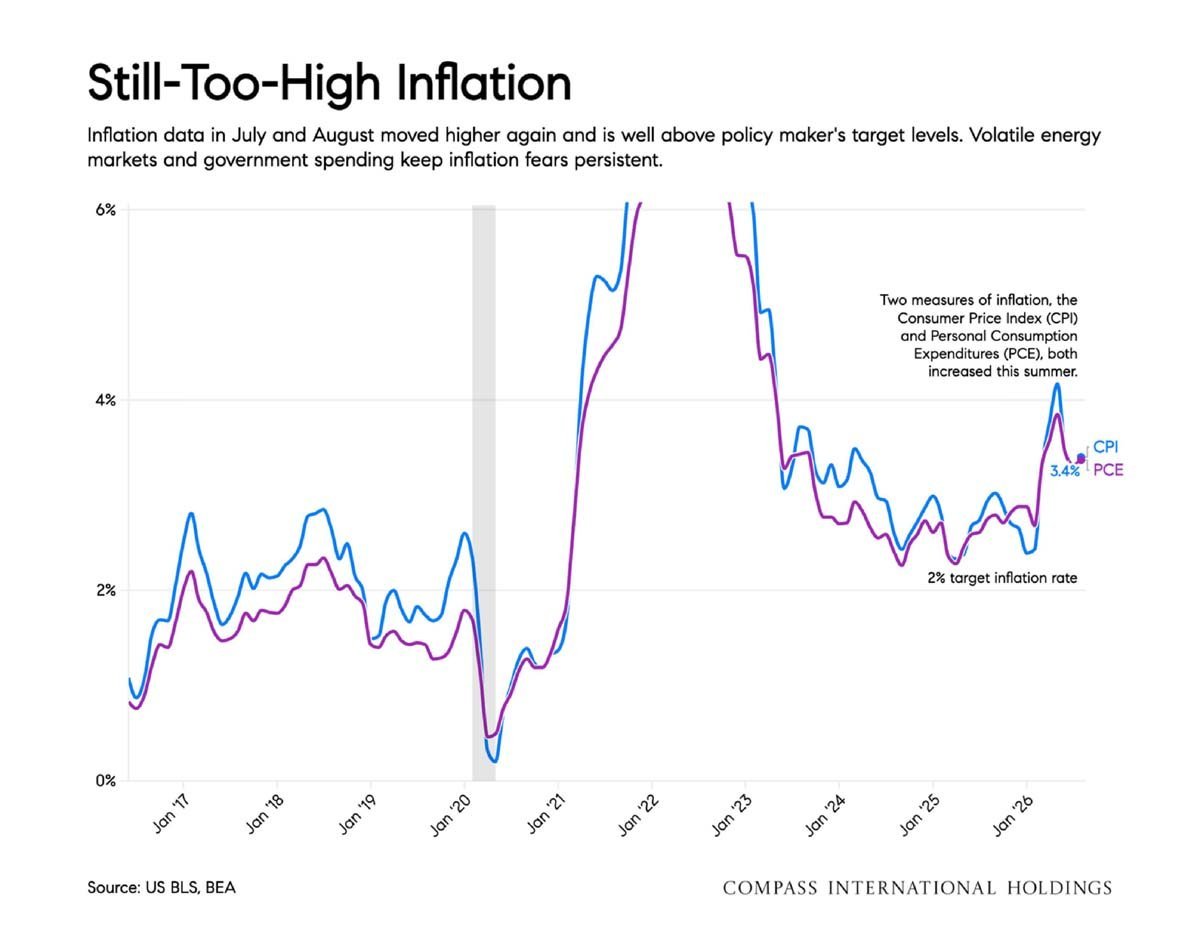
Chart comparing U.S. CPI and PCE inflation from 2017 to 2026, with both rising above the 2% target.
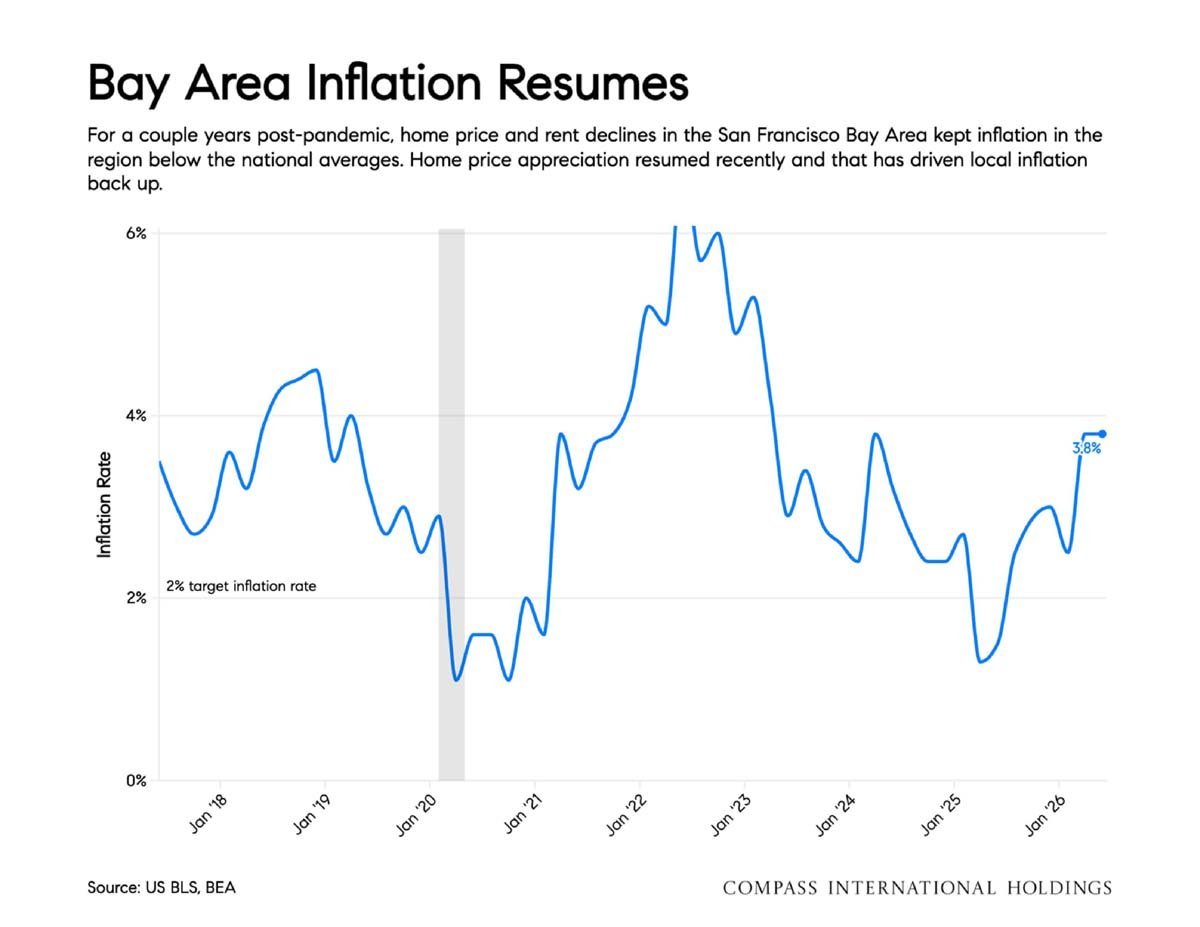
Bay Area inflation chart showing rates from 2018 to 2026, ending at 3.8%.
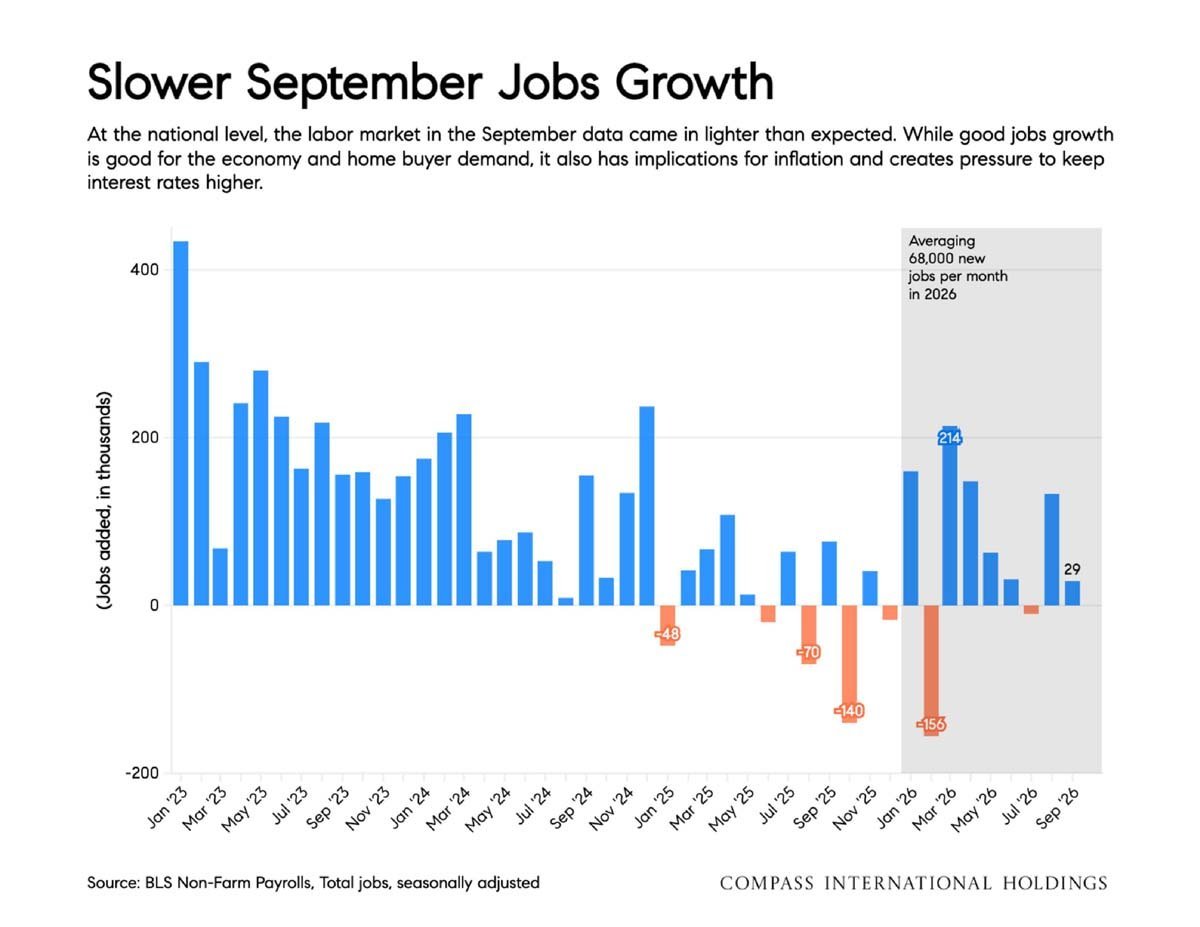
Bar chart of monthly U.S. job gains and losses, January 2023–September 2026.
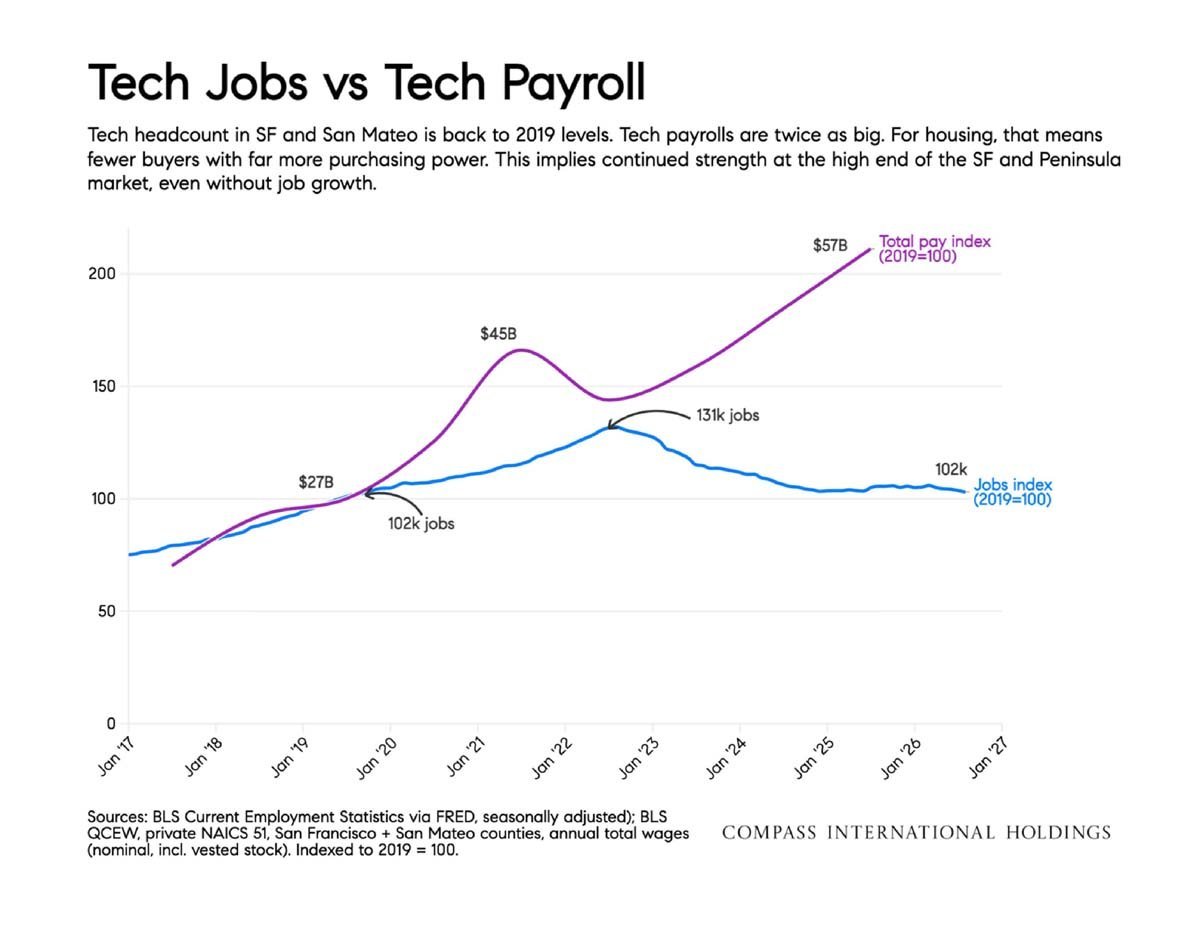
Chart comparing San Francisco and San Mateo tech job and payroll indexes from 2017 to 2027.
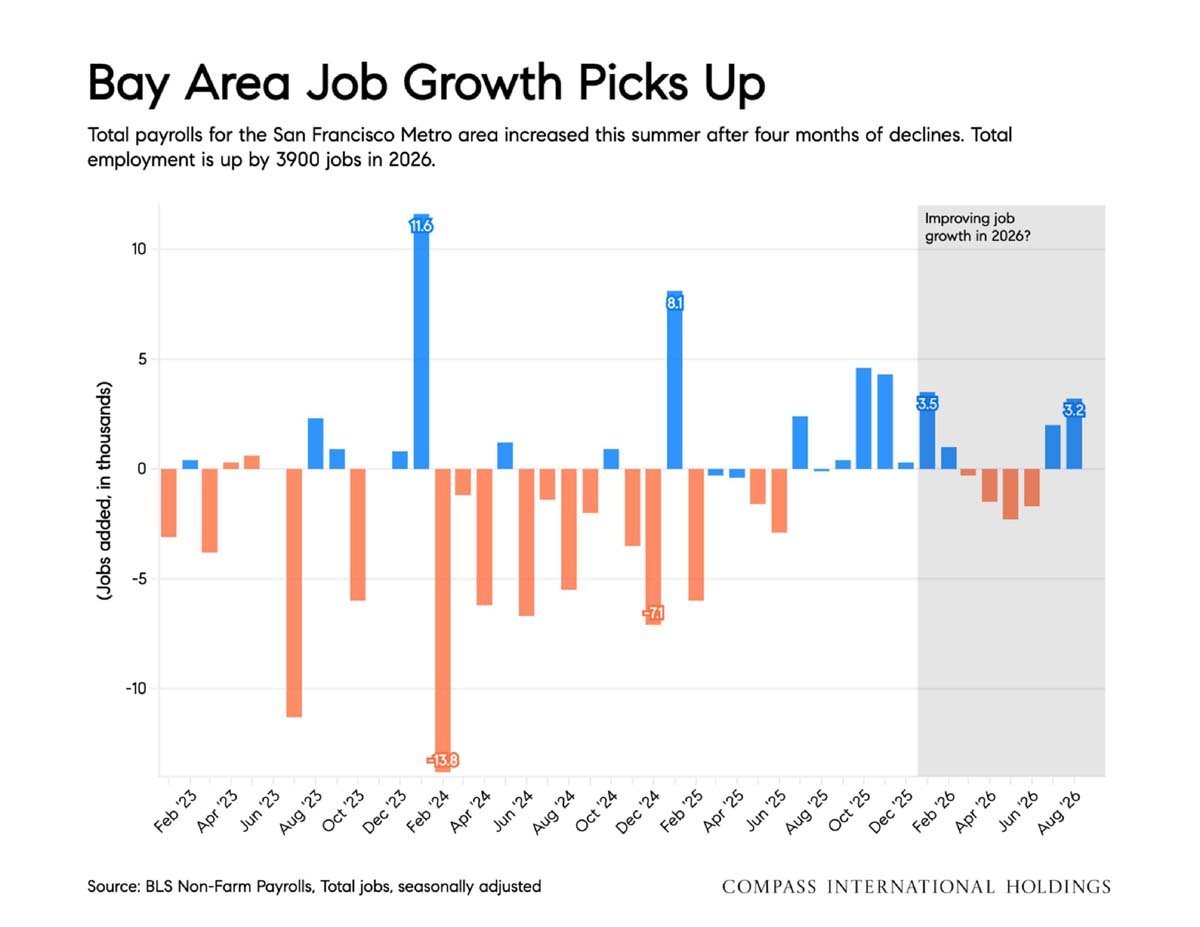
Chart of San Francisco metro job growth, showing payroll gains after months of declines.
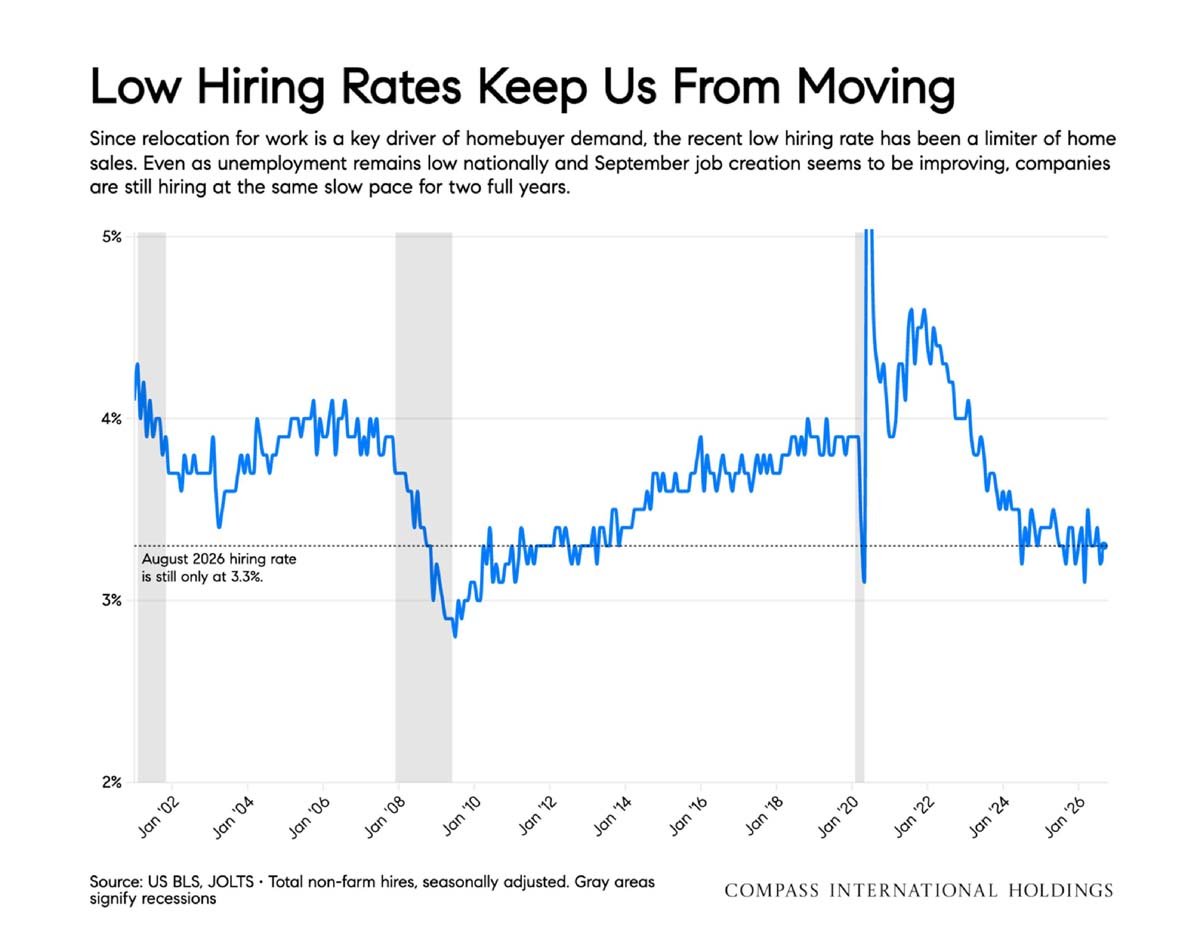
Chart showing U.S. hiring rates from 2002 to 2026, with rates at 3.3% in August 2026.
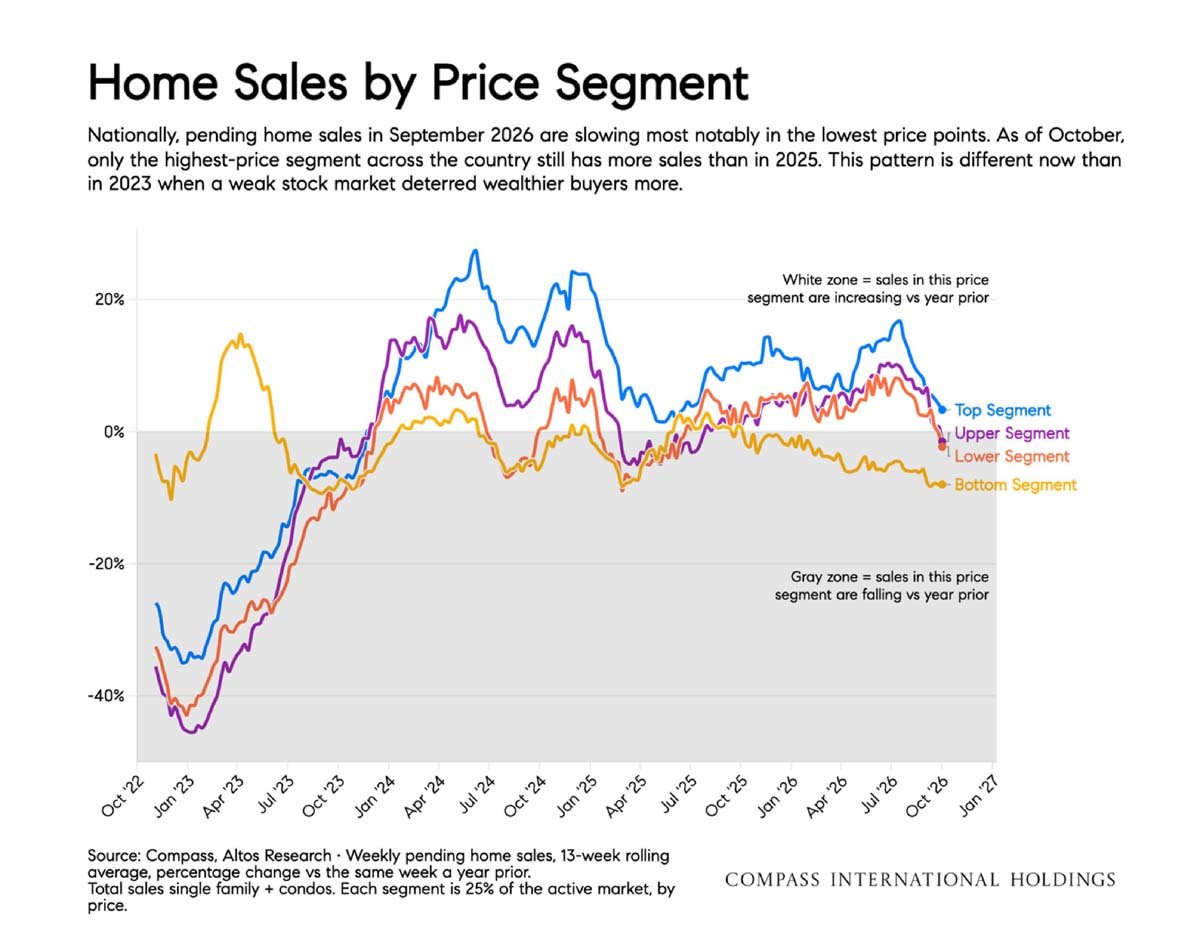
Line chart showing national home sales changes by price segment from October 2022 to October 2026.
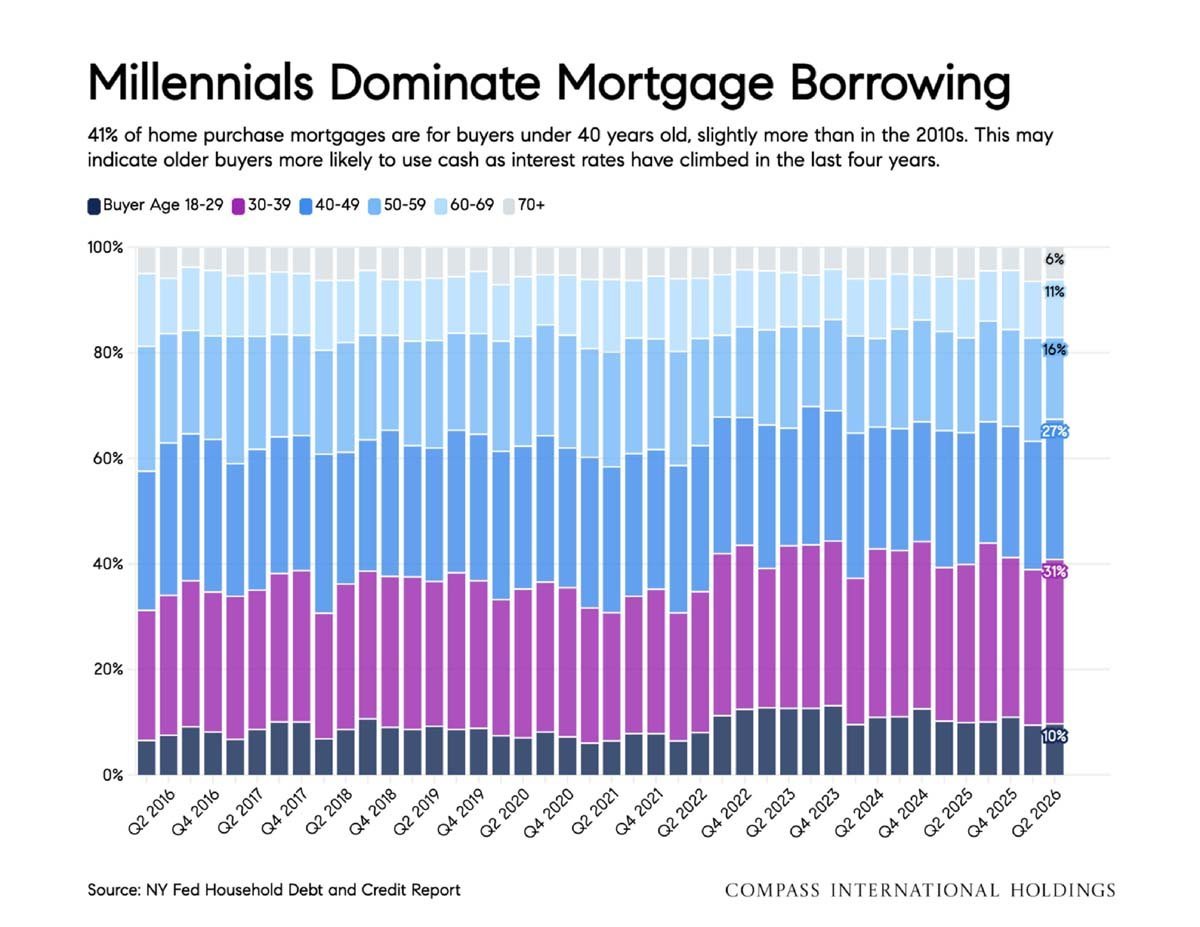
Stacked bar chart showing mortgage borrowing by buyer age from 2016 to 2026, with buyers aged 30–39 the largest group.
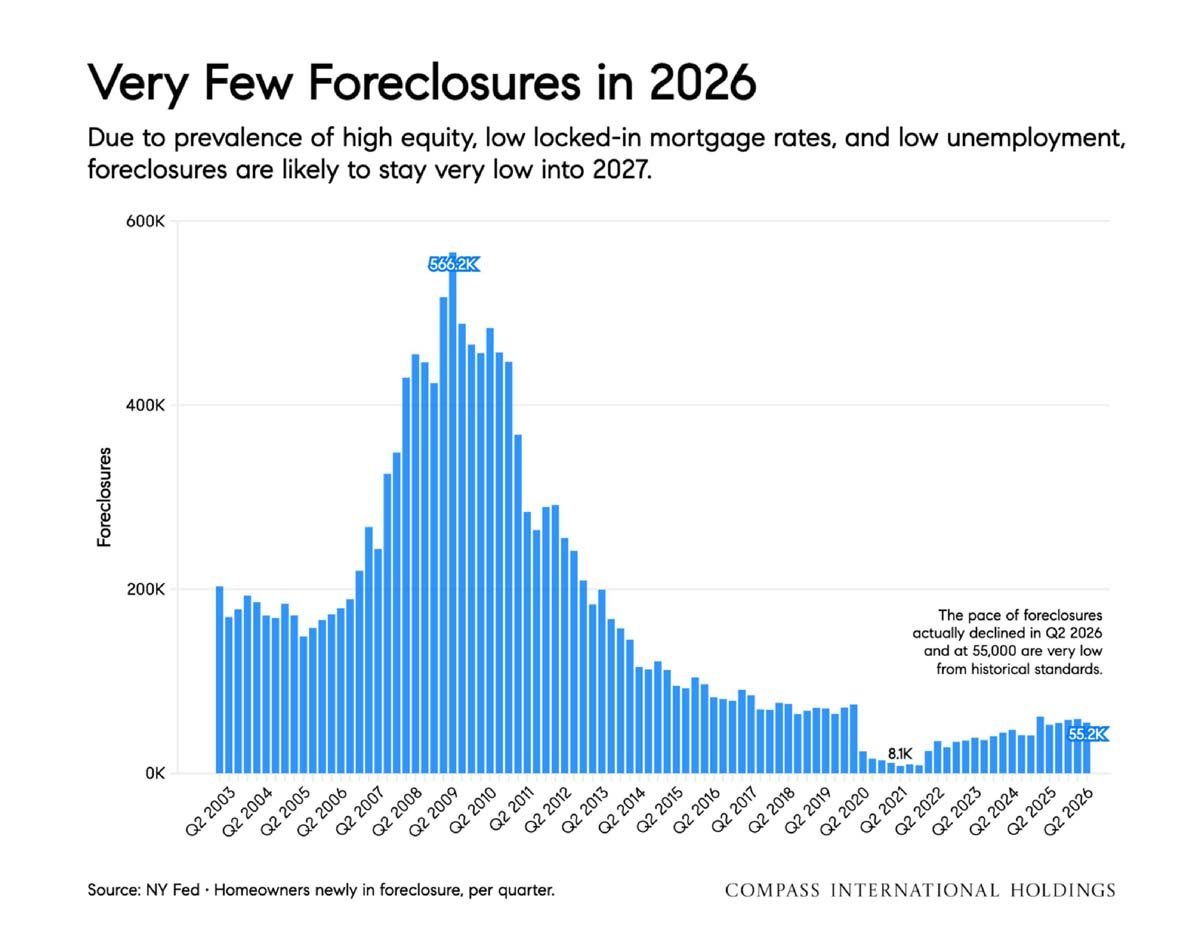
Bar chart of quarterly U.S. foreclosures from 2003 to 2026, peaking at 566,200 in 2009 and falling to 55,200 in 2026.
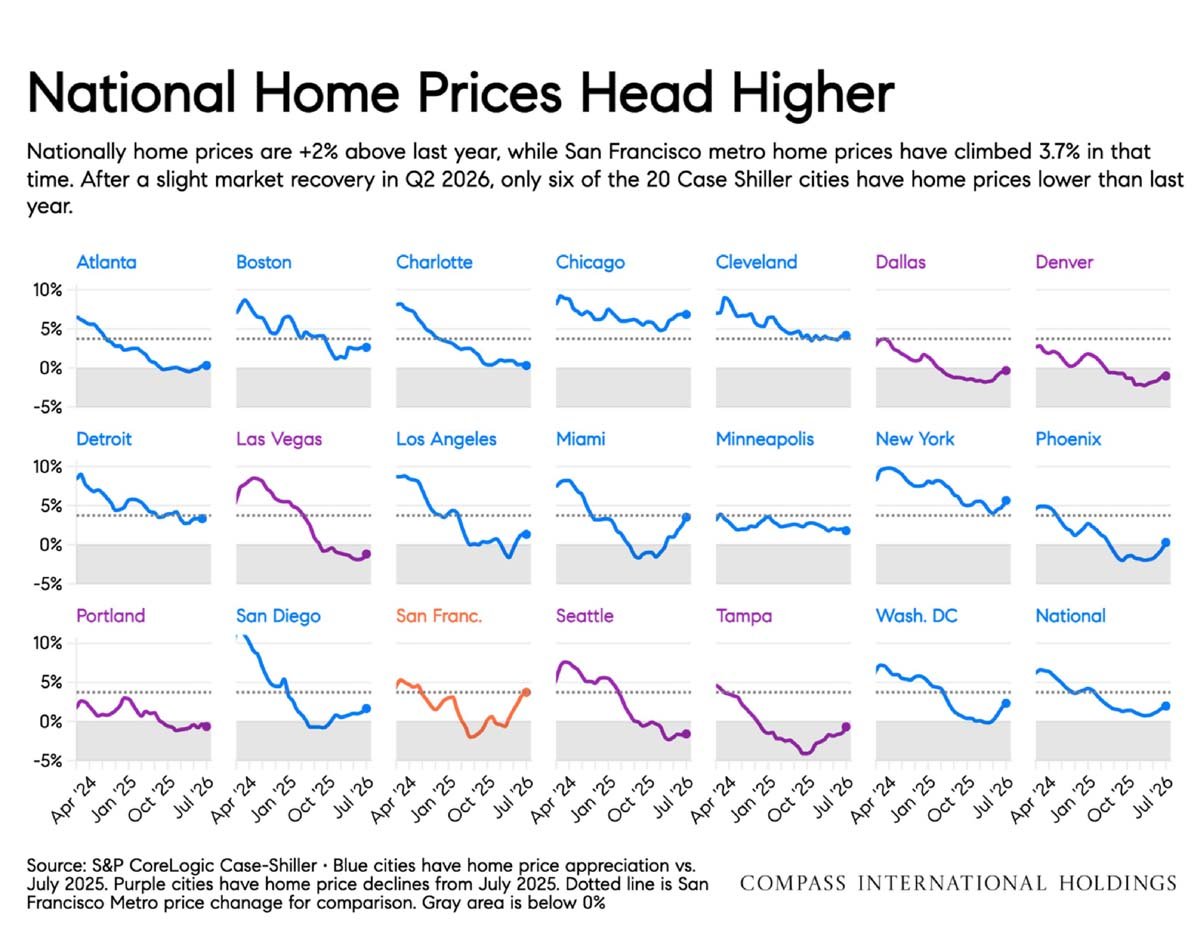
Chart comparing home price changes across 20 Case-Shiller cities and nationally through July 2026.
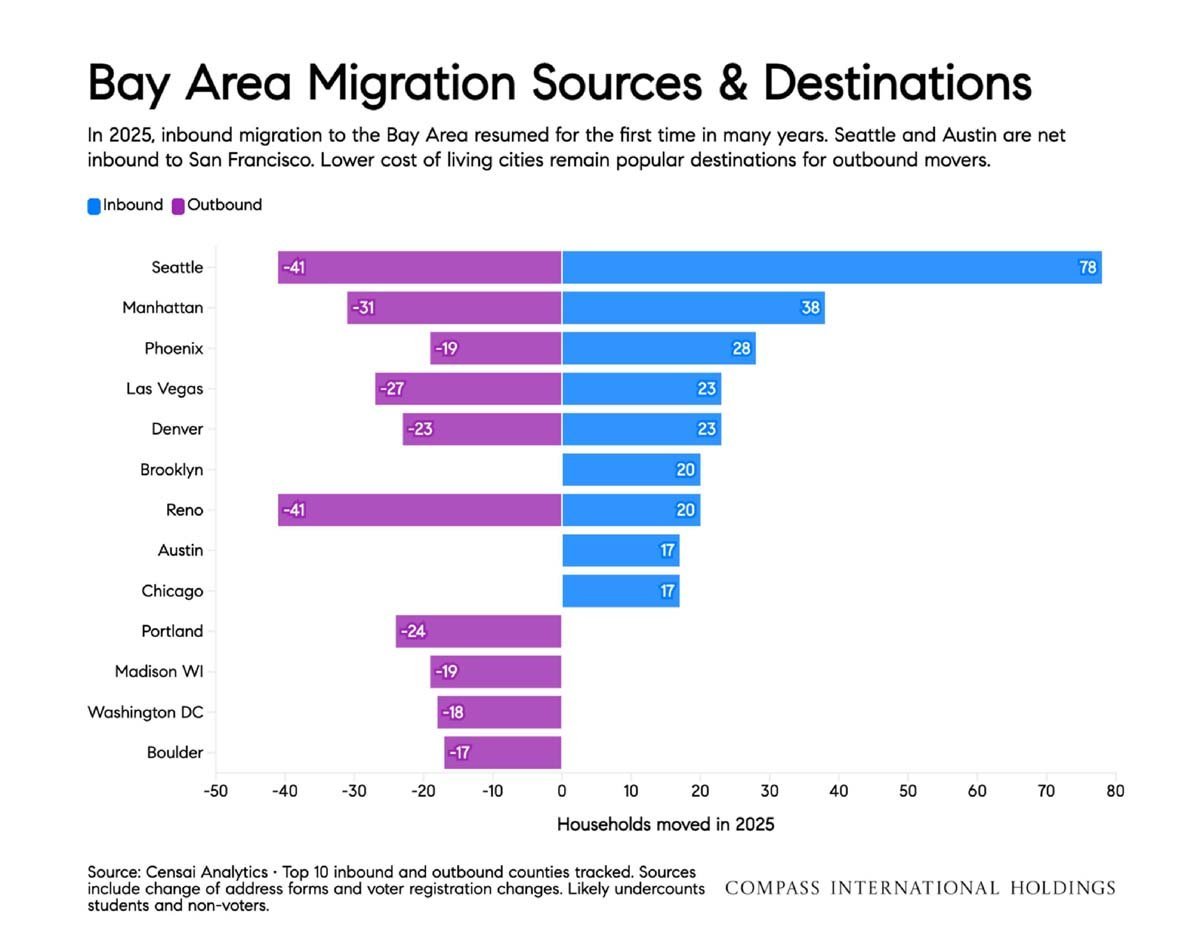
Bay Area migration chart comparing 2025 inbound and outbound household moves by city.
Compass
Work With Jane

Get assistance in determining the current property value, crafting a competitive offer, writing and negotiating a contract, and much more. Contact me today.

Follow Me on Instagram