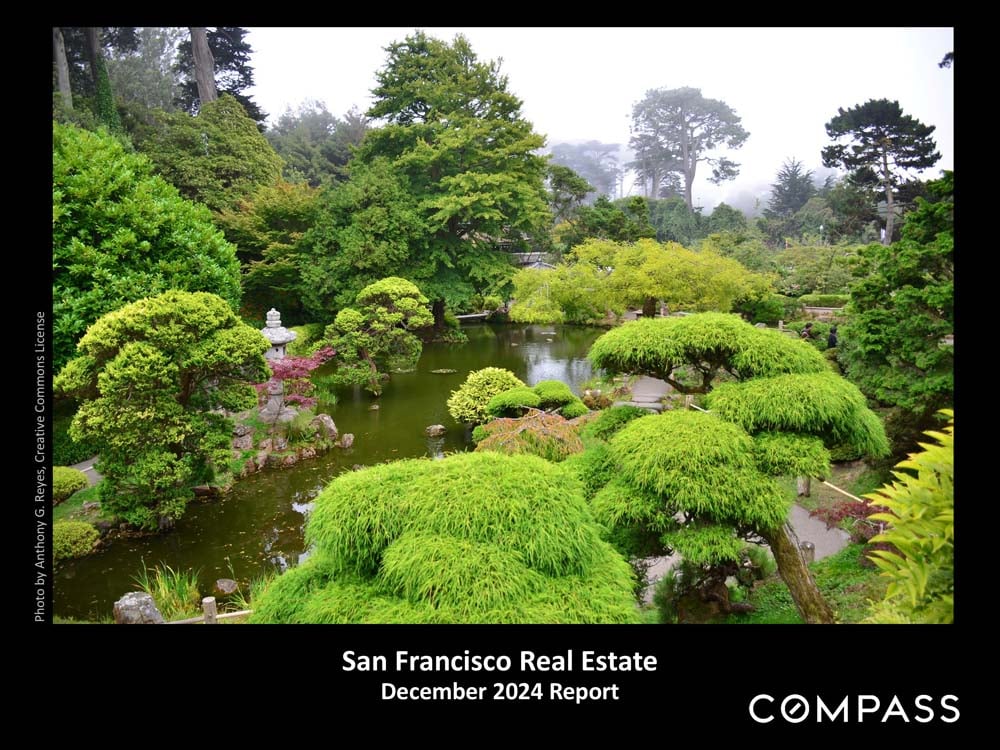
San Francisco real estate December 2024 report cover featuring a Japanese garden and pond.

San Francisco Home Prices, Market Conditions & December 2024

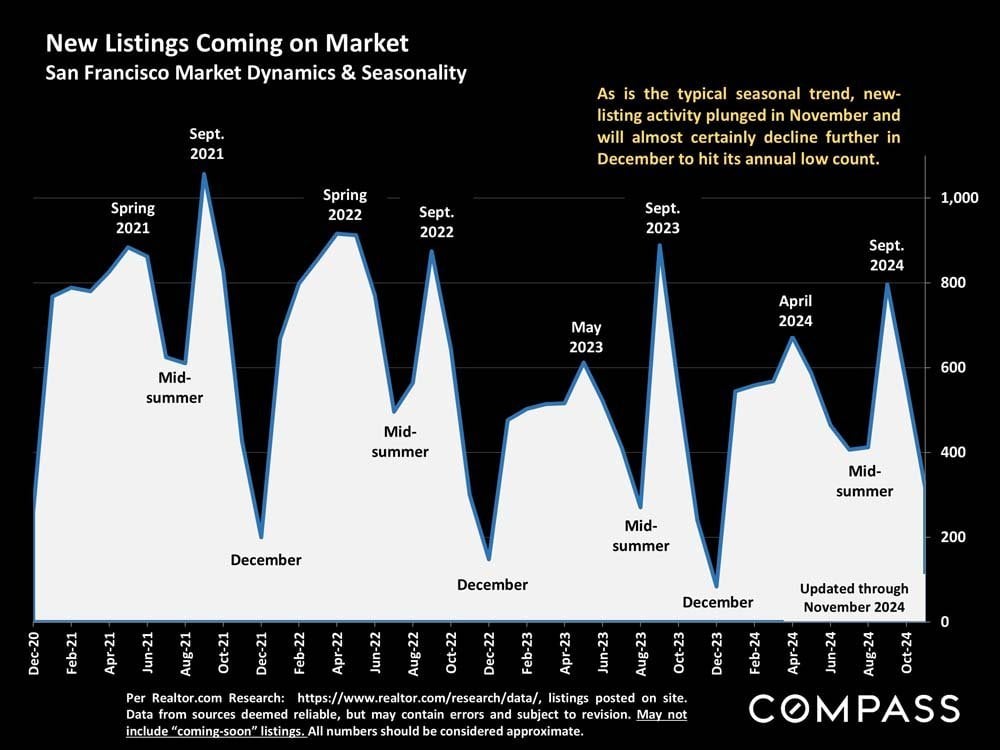
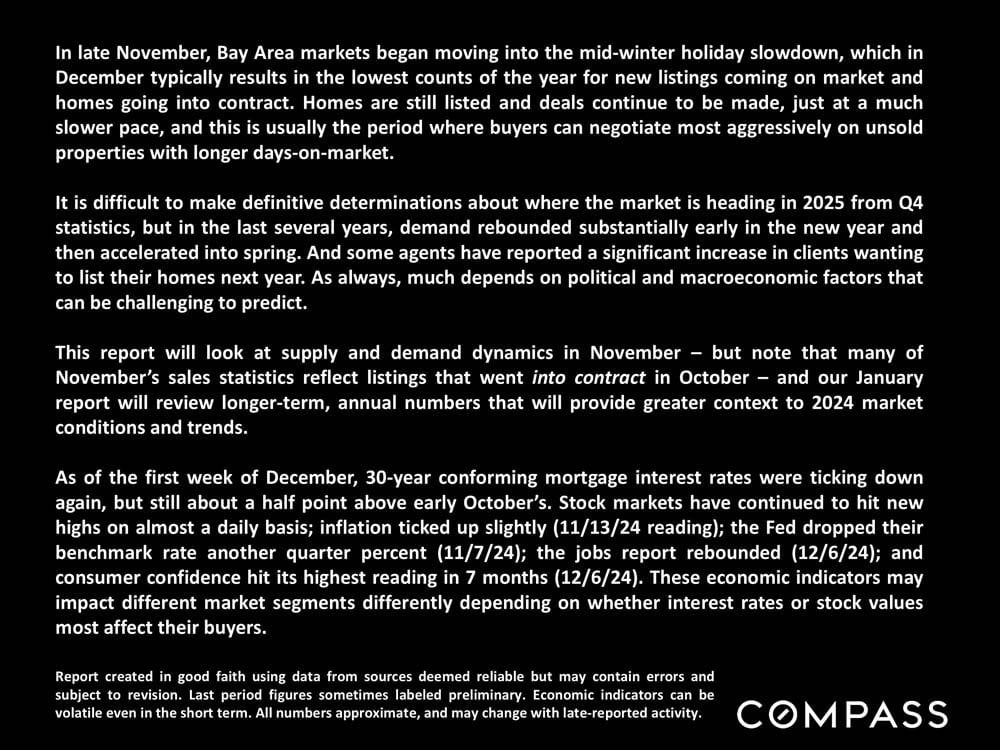
In late November, Bay Area markets began moving into the mid-winter holiday slowdown, which in December typically results in the lowest counts of the year for new listings coming on the market and homes going into contract.
 
San Francisco real estate December 2024 report cover featuring a Japanese garden and pond.
 
December 2024 San Francisco real estate market report on seasonal trends and economic conditions.
 
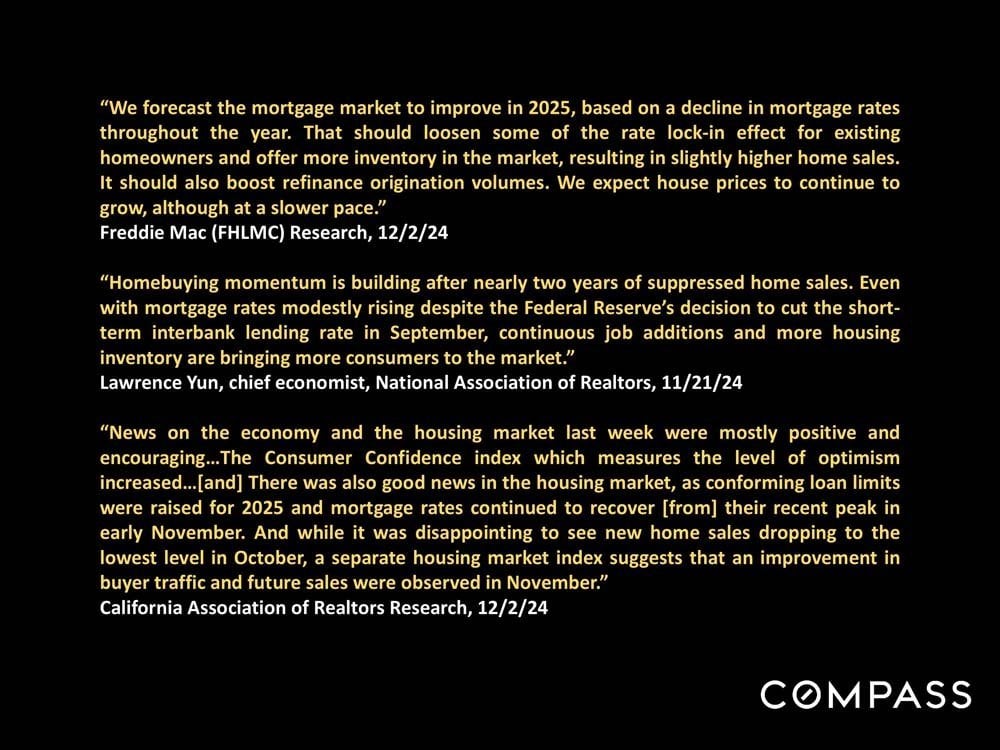
Housing market outlook quotes from Freddie Mac, Lawrence Yun, and California Association of Realtors Research.
 
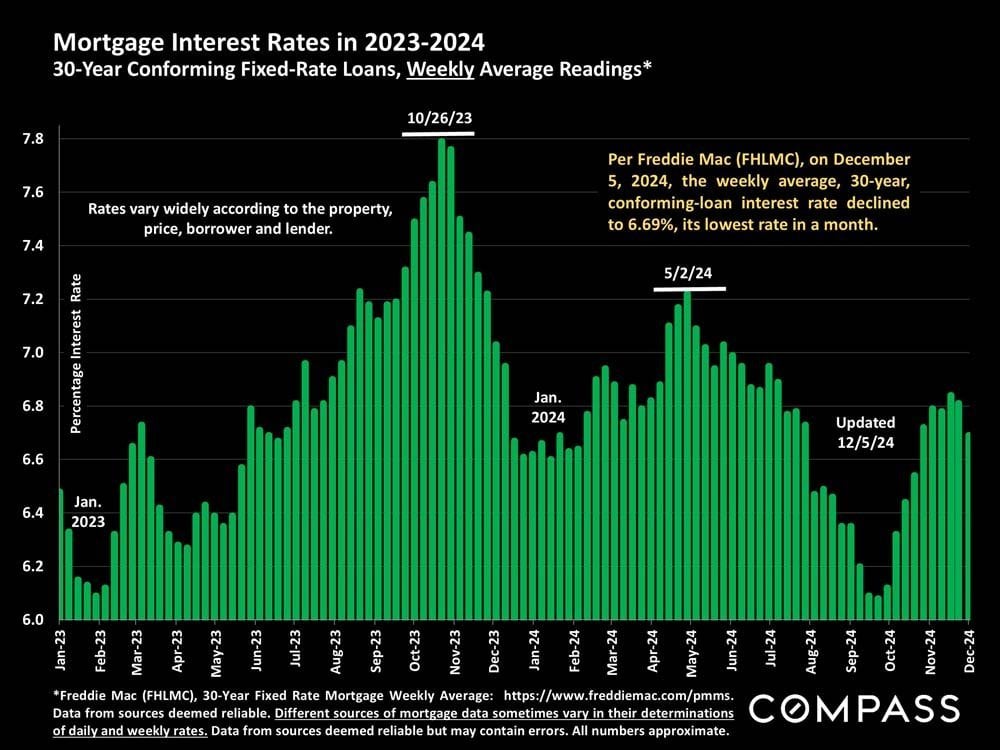
Chart of weekly 30-year mortgage rates from 2023 to 2024, peaking in October 2023 and ending near 6.7%.
 
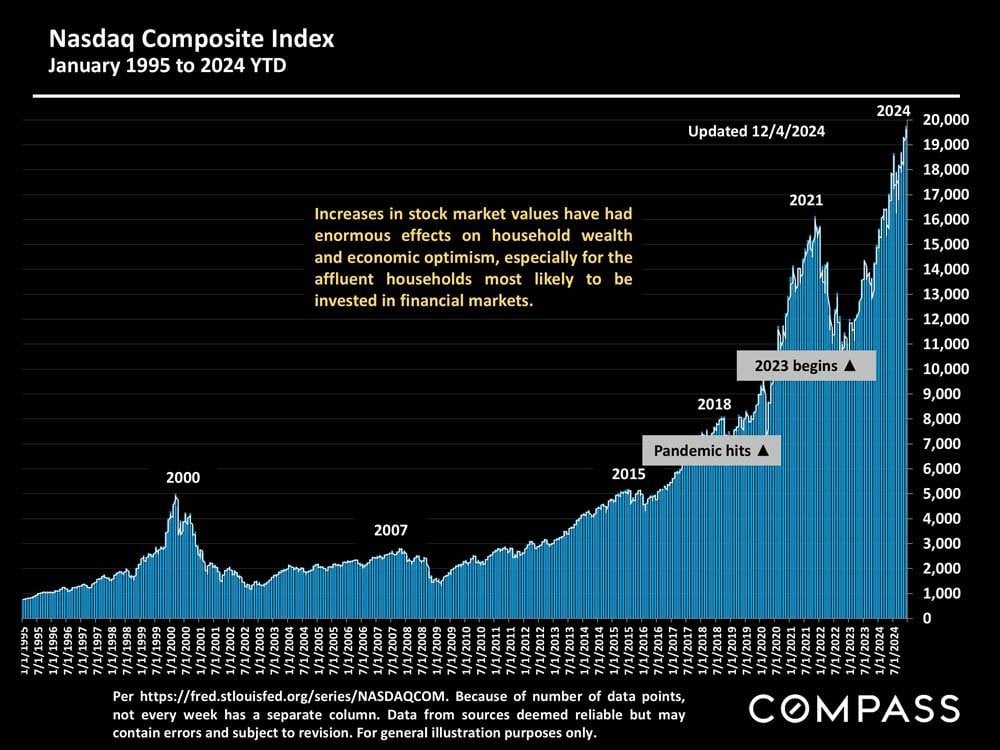
Chart of the Nasdaq Composite Index from 1995 to 2024, showing a sharp rise to nearly 20,000.
 
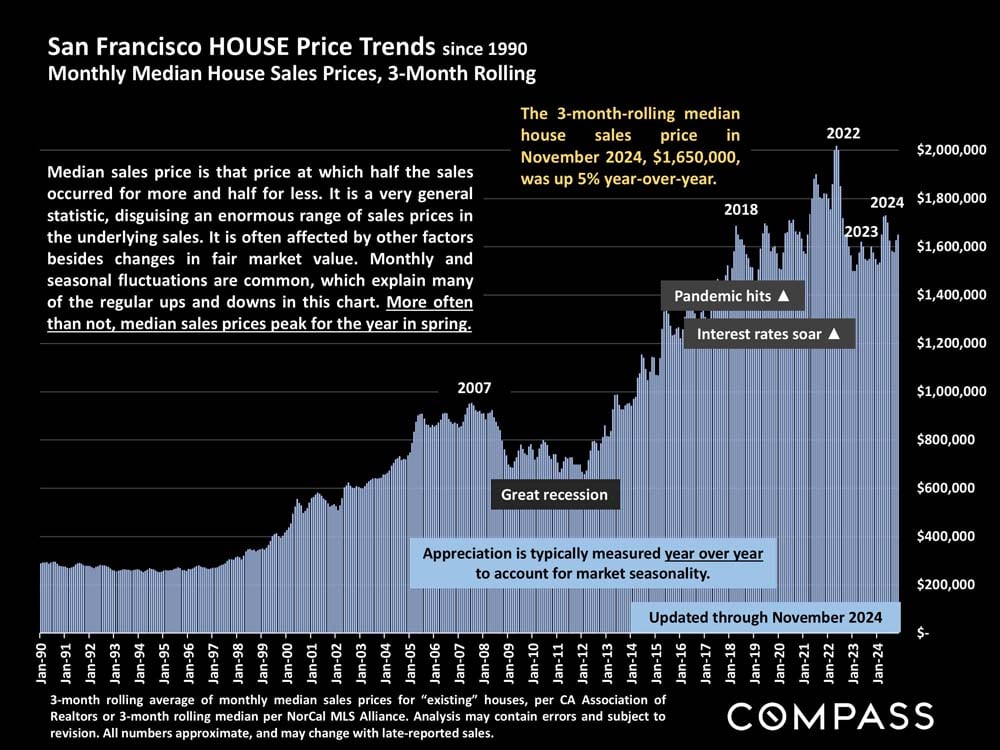
Chart of San Francisco median house sale prices from 1990 to November 2024, with market milestones.
 
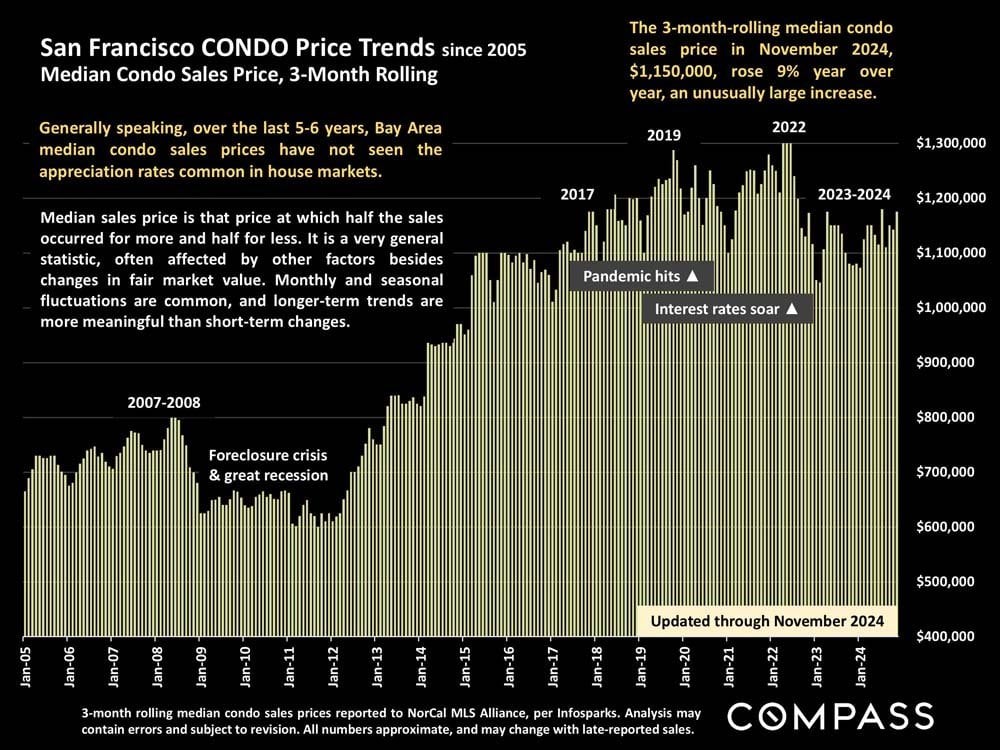
Chart tracks San Francisco condo prices from 2005 to November 2024, highlighting a $1.15 million median and 9% annual increase.
 
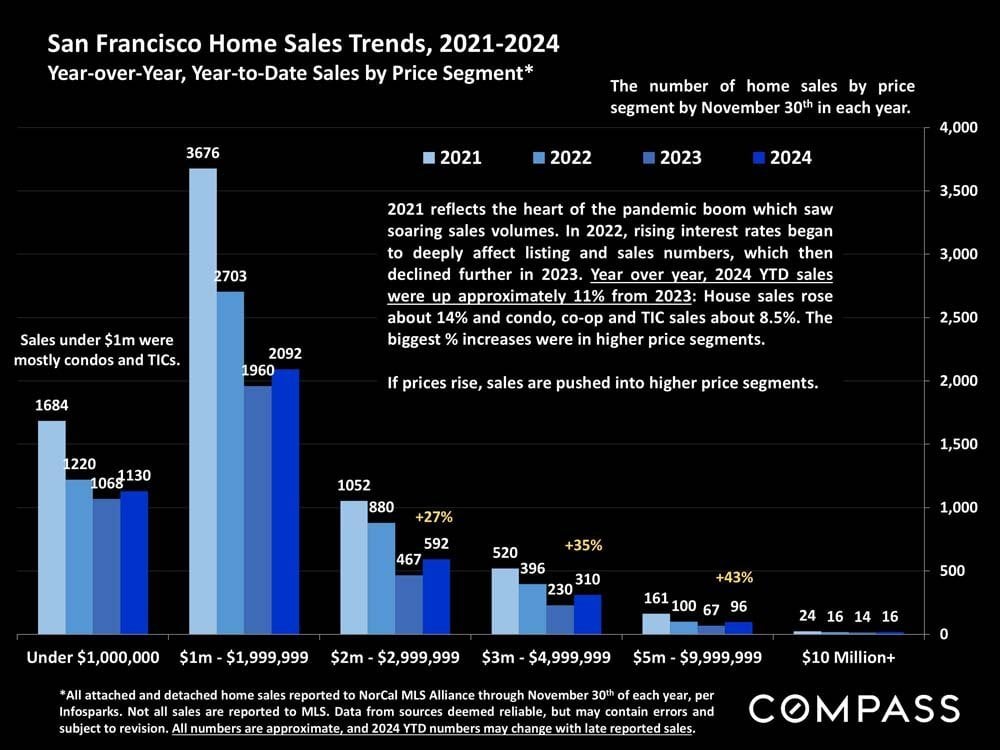
Bar chart comparing San Francisco home sales by price segment from 2021 to 2024, with the most sales in the $1–2 million range.
 
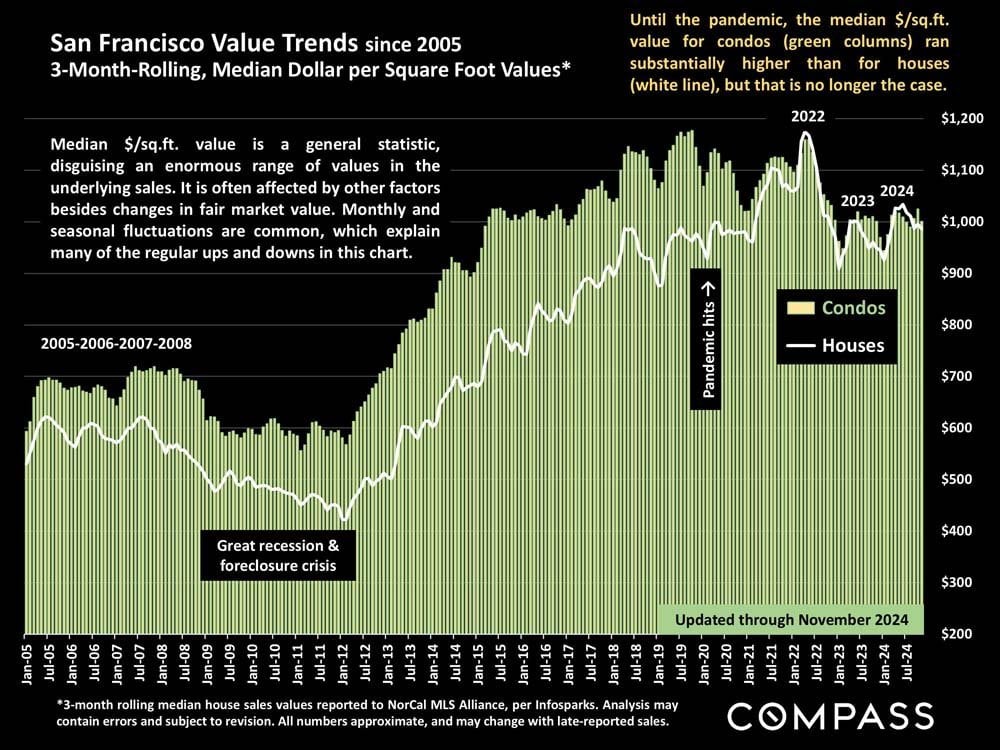
Chart comparing San Francisco condo and house median prices per square foot from 2005 through 2024.
 
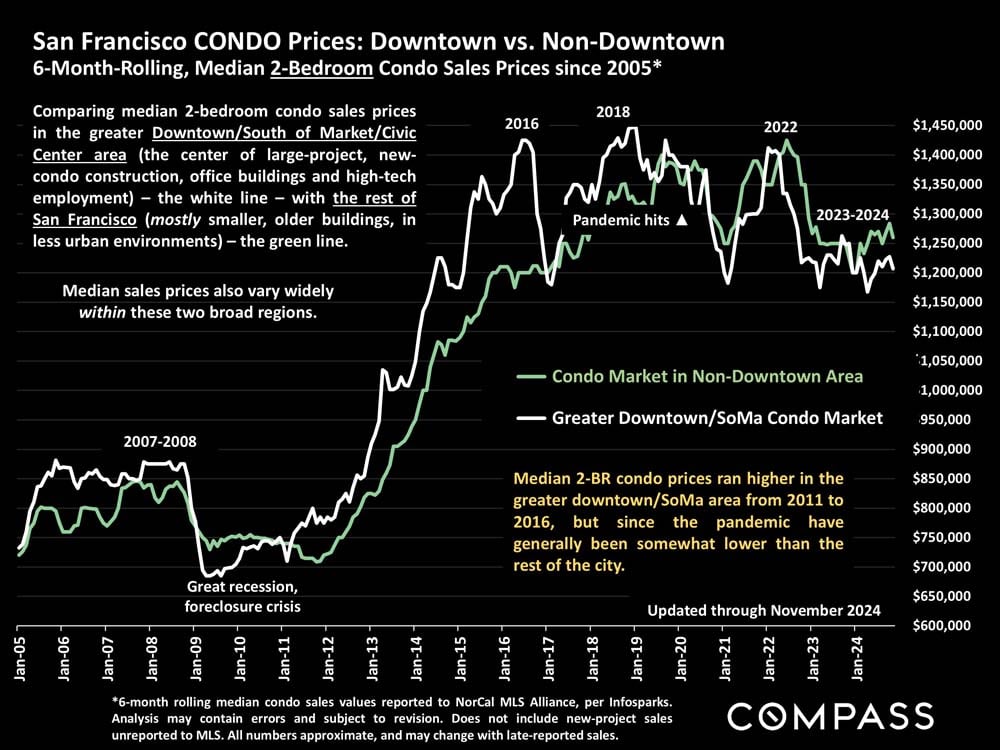
Chart comparing median two-bedroom condo prices in downtown/SoMa and the rest of San Francisco, 2005–2024.
 
Chart of San Francisco new listings, showing seasonal peaks and declines from December 2020 through November 2024.
 
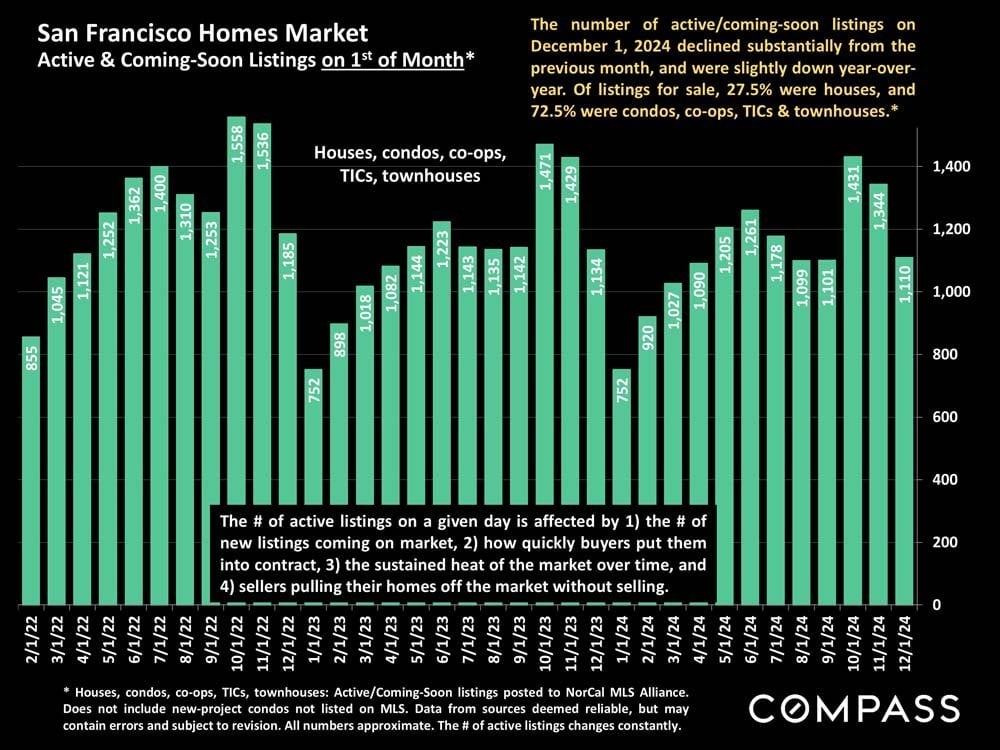
San Francisco active and coming-soon home listings chart, with monthly counts from February 2022 to December 2024.
 
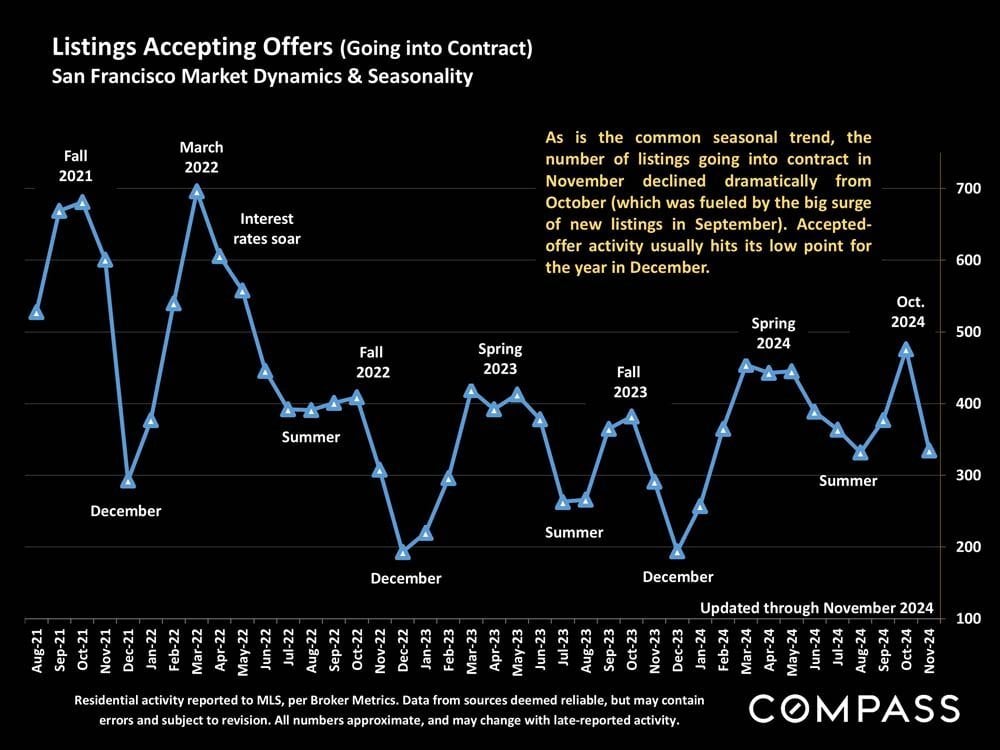
Chart of San Francisco listings accepting offers, showing seasonal market trends from August 2021 through November 2024.
 
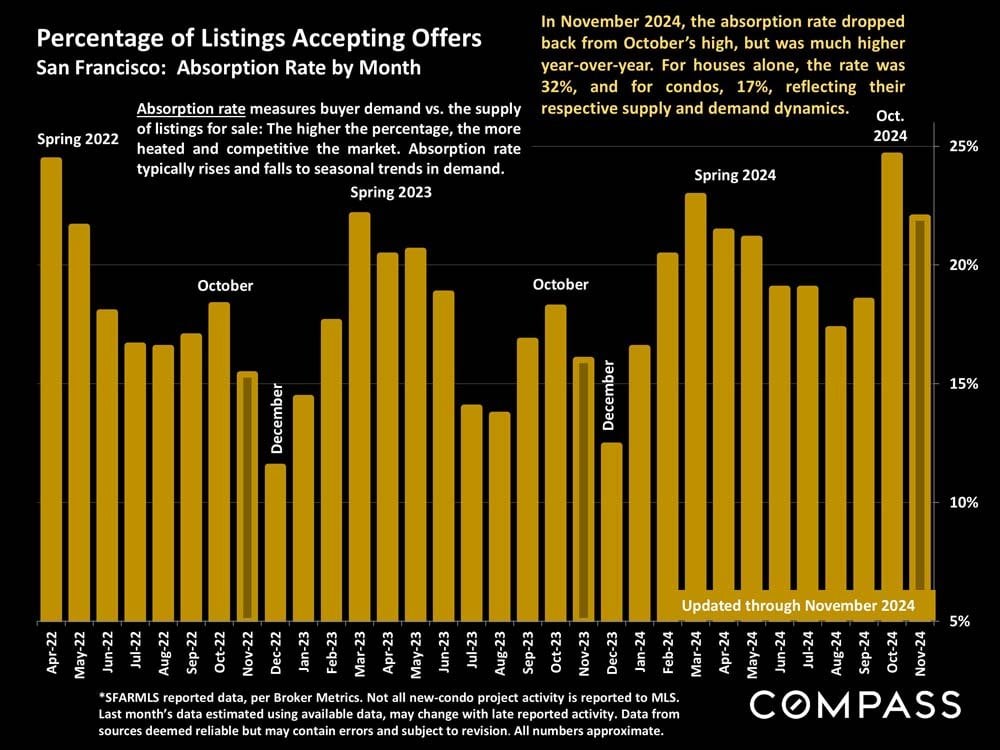
Bar chart of San Francisco listing absorption rates by month, April 2022–November 2024; November 2024 is about 22%.
 
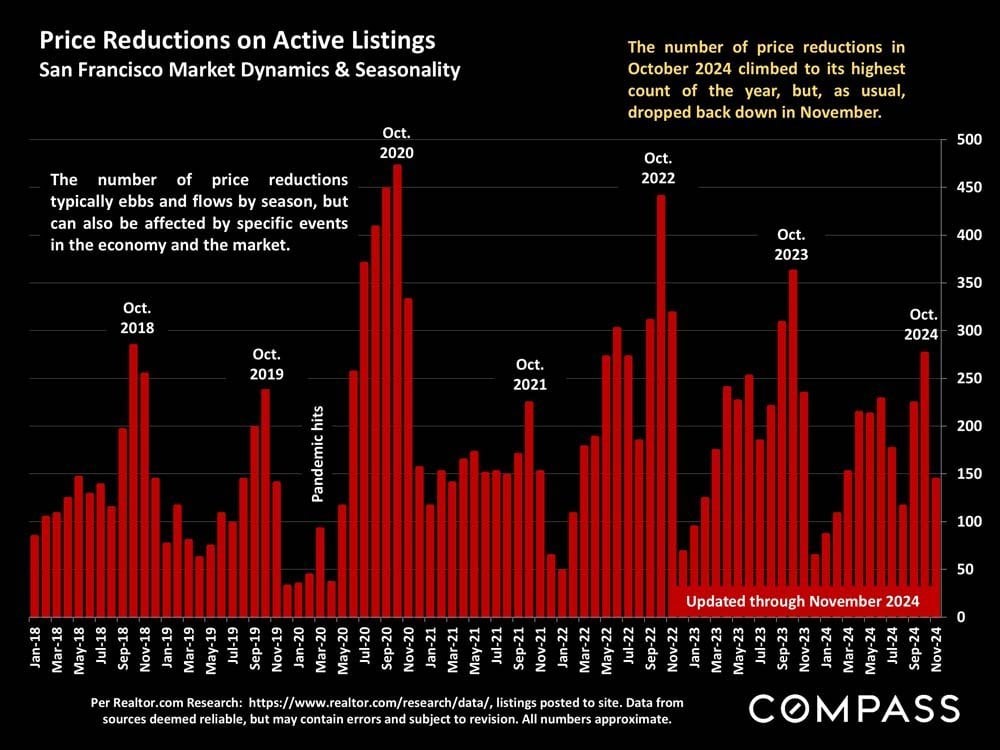
Chart of San Francisco listing price reductions, with monthly red bars and October peaks from 2018 through 2024.
 
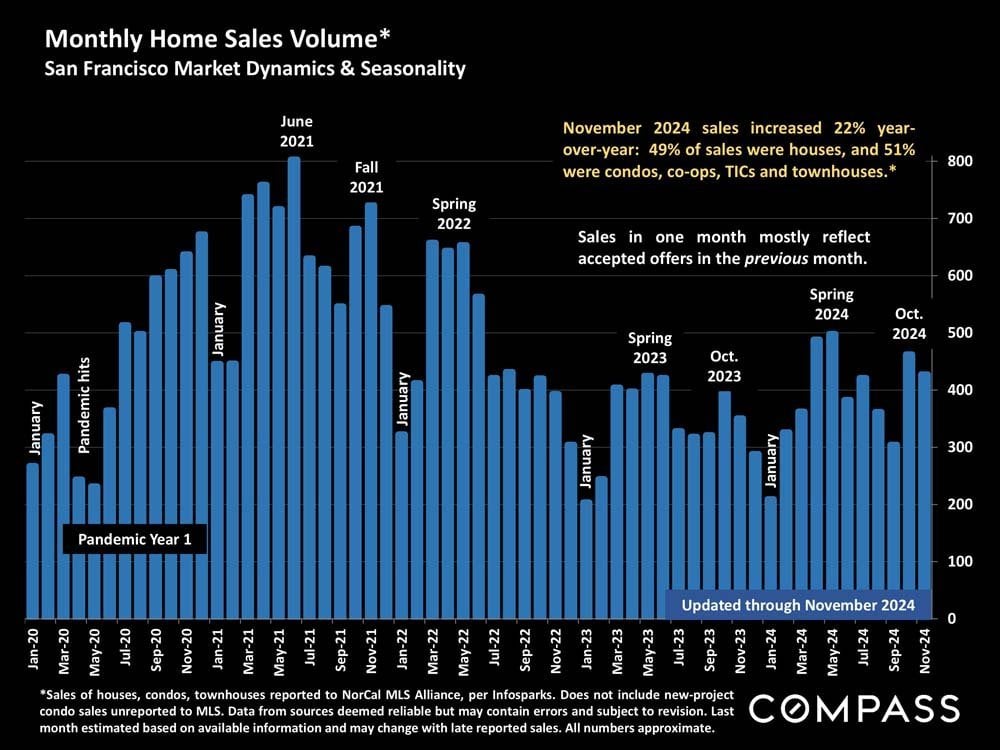
Bar chart of San Francisco monthly home sales, January 2020–November 2024, with a 22% year-over-year increase noted for November.
 
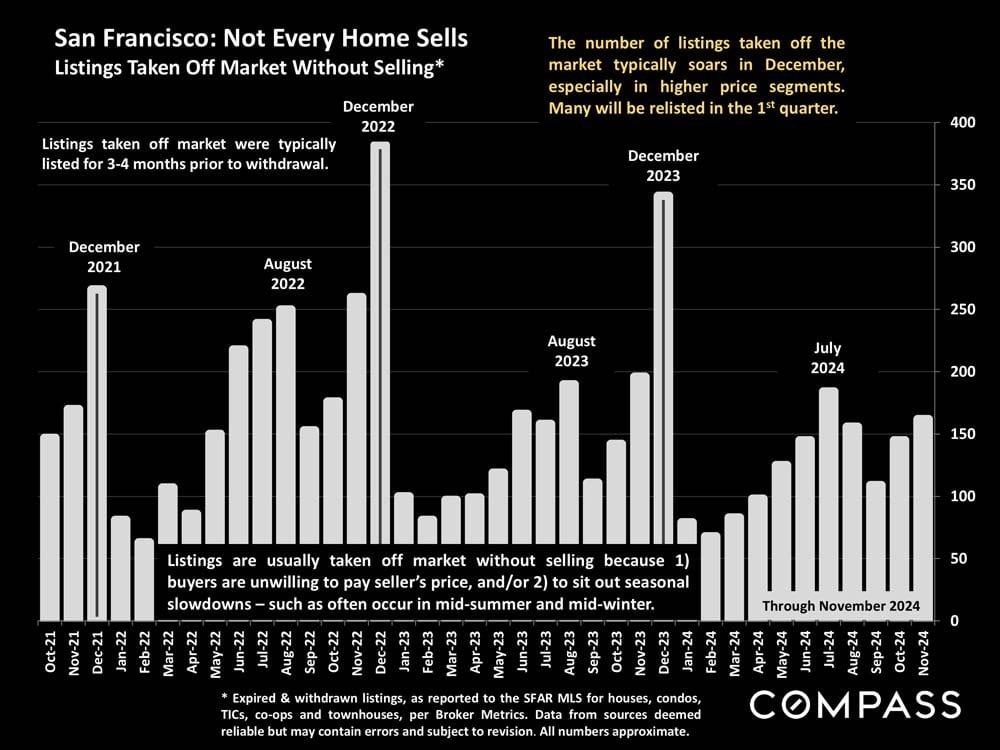
San Francisco monthly listings taken off market without selling, October 2021–November 2024.
 
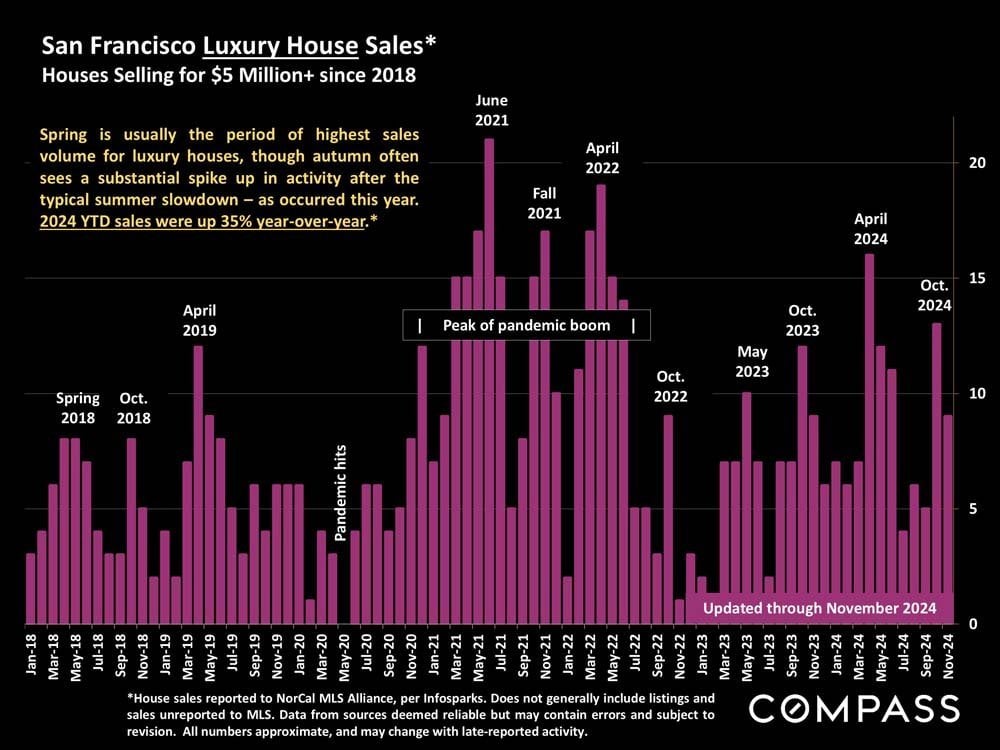
Bar chart of San Francisco $5 million-plus house sales from 2018 to November 2024, with pandemic-era peaks.
 
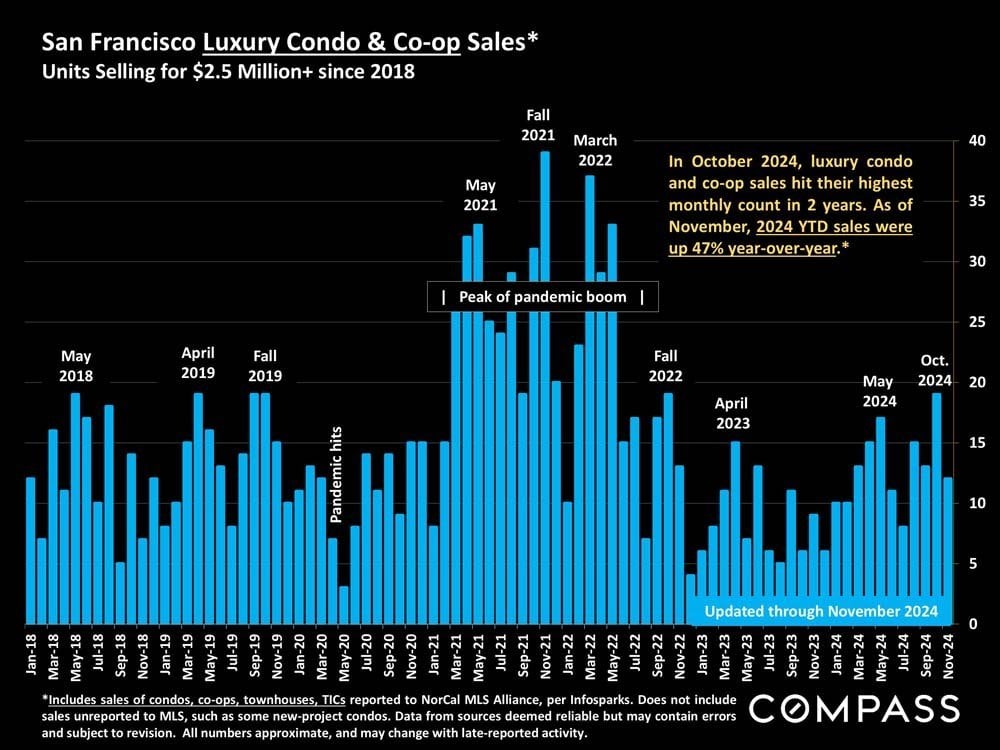
Chart of San Francisco luxury condo and co-op sales, with peak activity in 2021 and year-over-year growth noted for 2024.
 
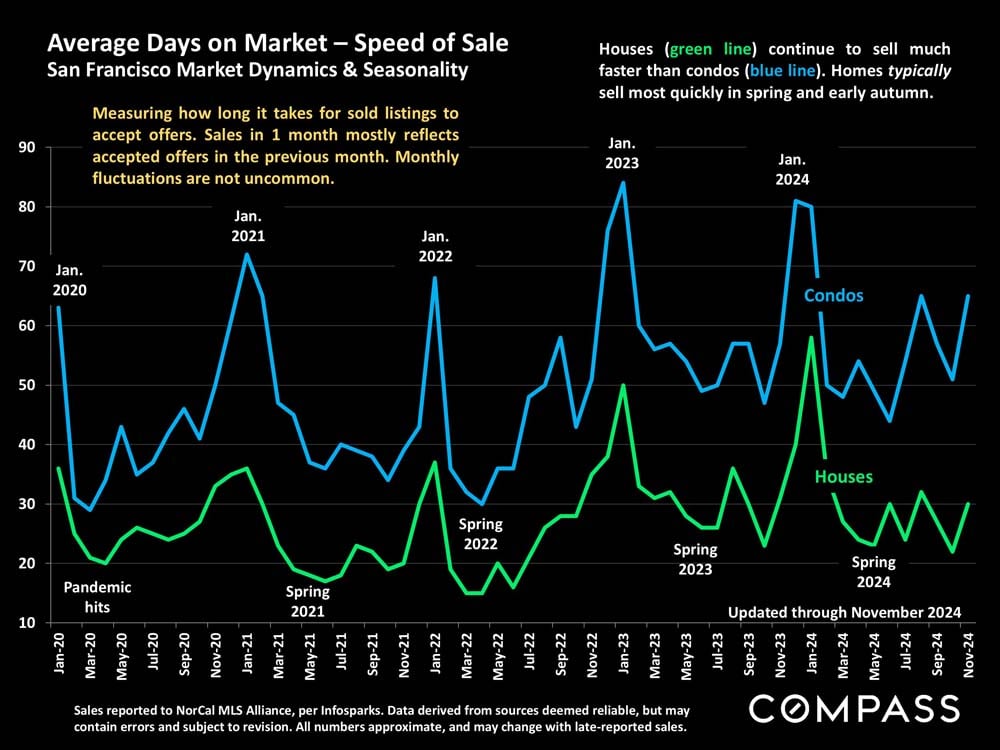
Line chart of San Francisco days on market, January 2020–November 2024: condos generally take longer to sell than houses.
 
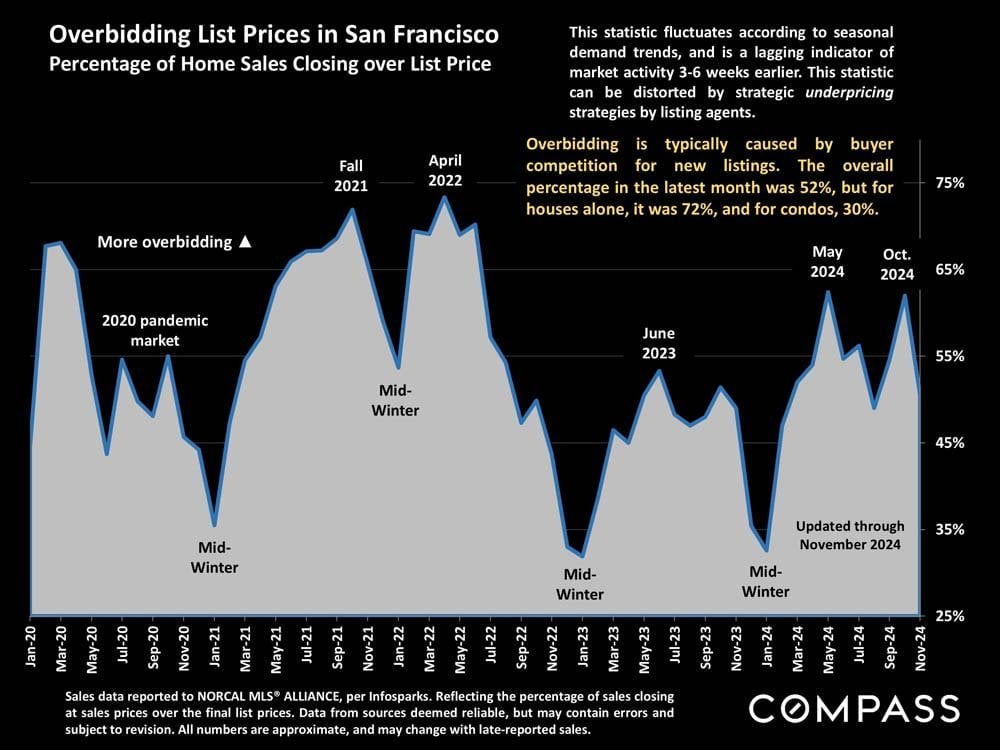
Chart of San Francisco home sales closing over list price, January 2020–November 2024, with seasonal peaks and lows.
 
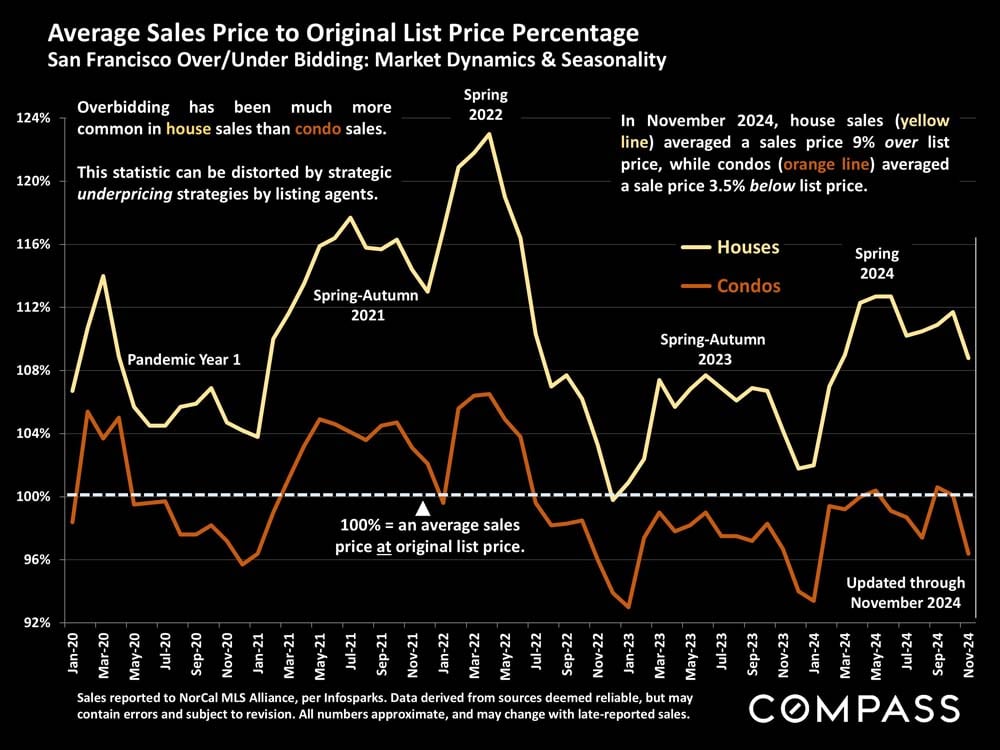
Chart comparing San Francisco house and condo sale prices to original list prices, January 2020–November 2024.
 
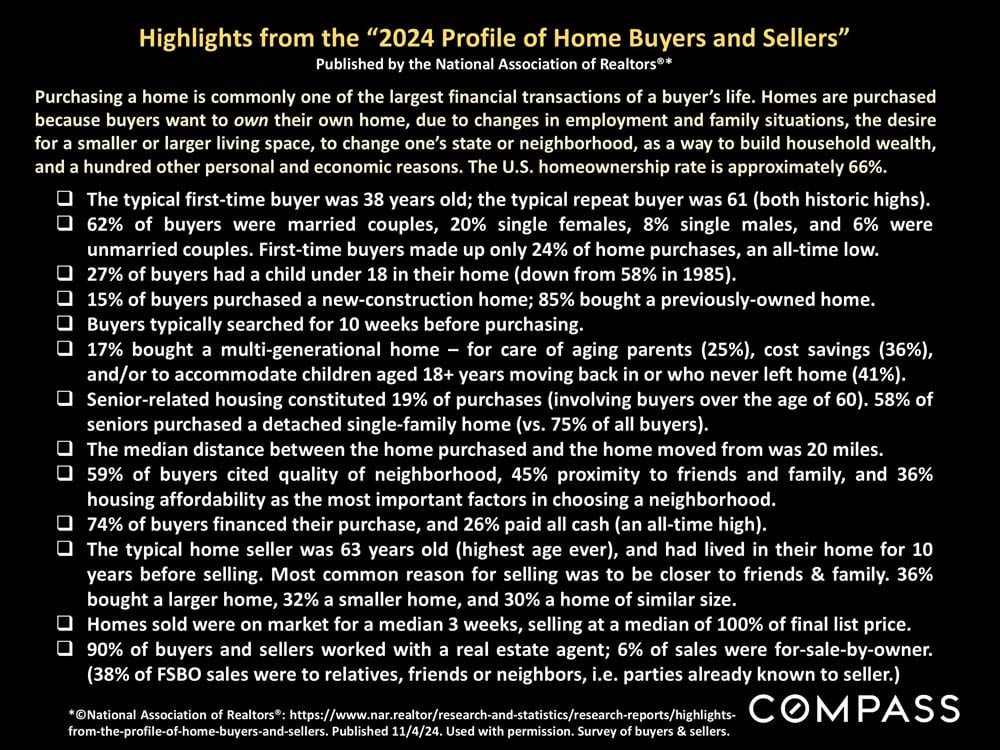
2024 home buyer and seller profile highlights with statistics on purchases, demographics, financing, and market conditions.
 
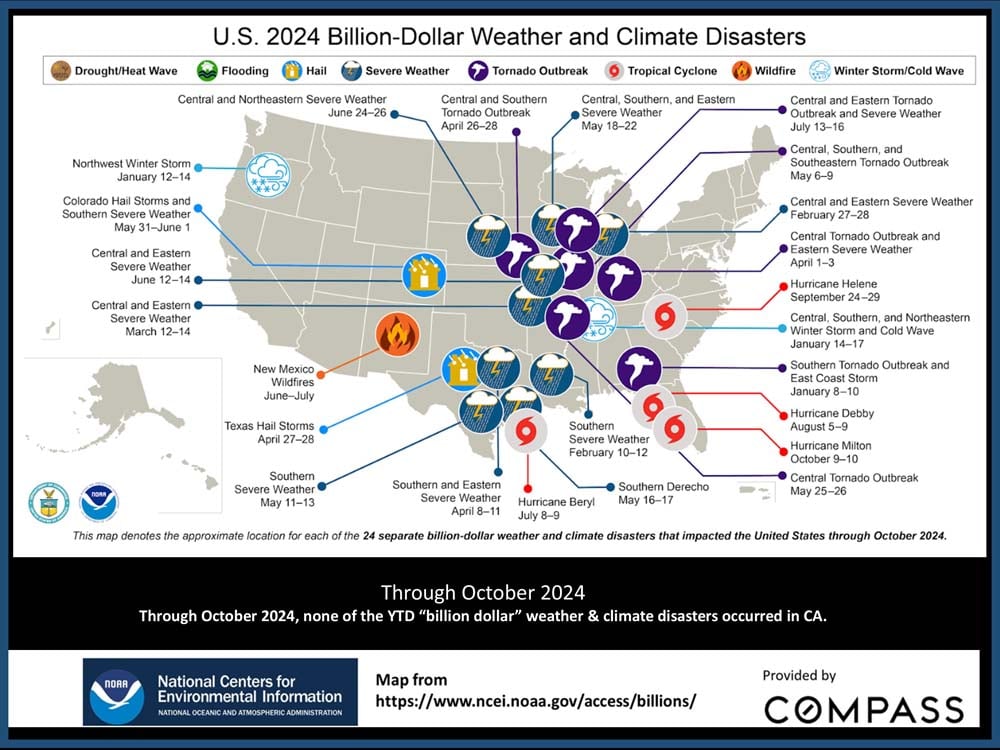
Map of U.S. billion-dollar weather and climate disasters through October 2024, with a note that none occurred in California.
 
Market report notes explain statistics, pricing measures, photo licensing, and Compass disclaimers.

Work With Jane

Get assistance in determining the current property value, crafting a competitive offer, writing and negotiating a contract, and much more. Contact me today.
Follow Me on Instagram