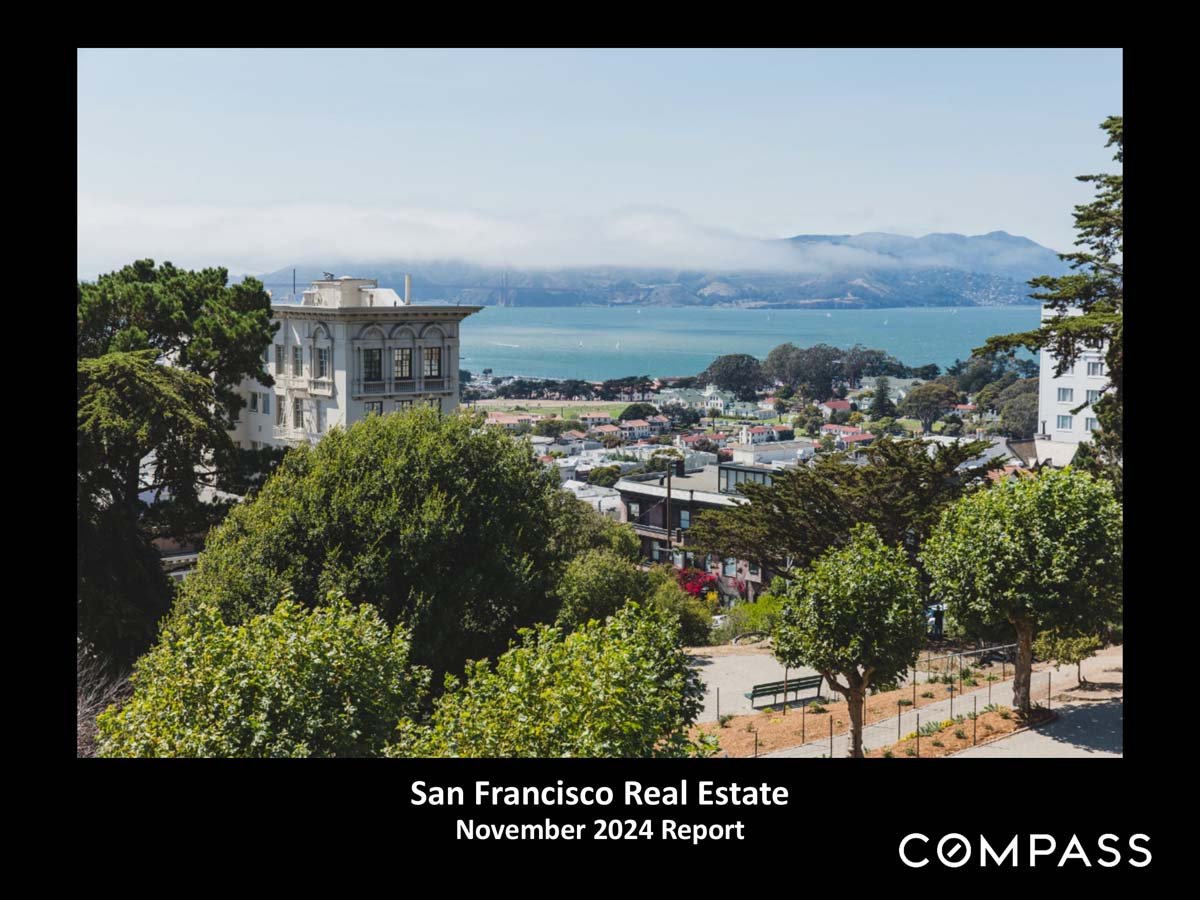
November 2024 San Francisco real estate report cover with a bay view and COMPASS branding.

San Francisco Home Prices, Market Conditions & November 2024

Year over year, median house and condo sales prices were up in October 2024, 2% and 5.5% respectively.

 
November 2024 San Francisco real estate report cover with a bay view and COMPASS branding.

 
San Francisco October 2024 market update: prices, sales activity, luxury sales, and seasonal buyer trends.
 
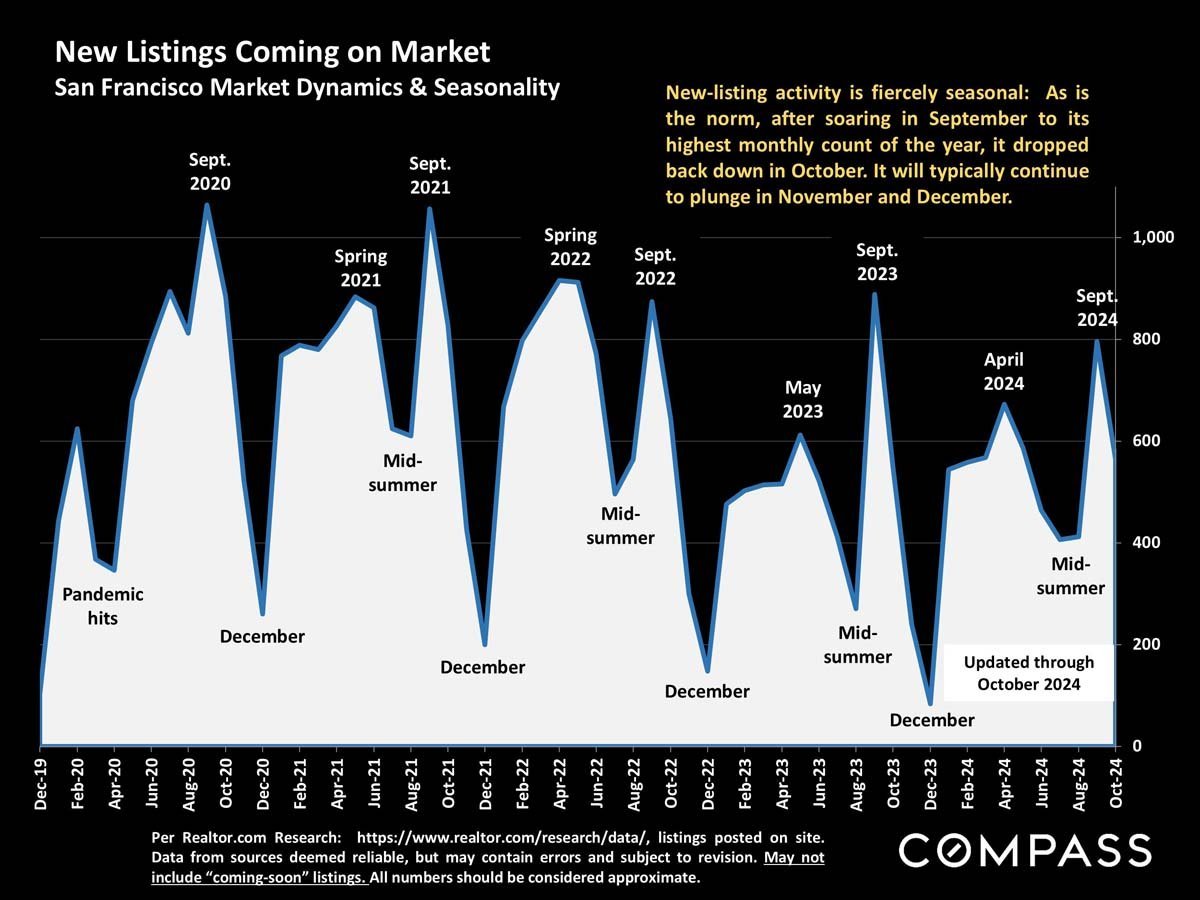
Chart of San Francisco new listings, showing recurring September peaks and winter declines from 2019 through October 2024.
 
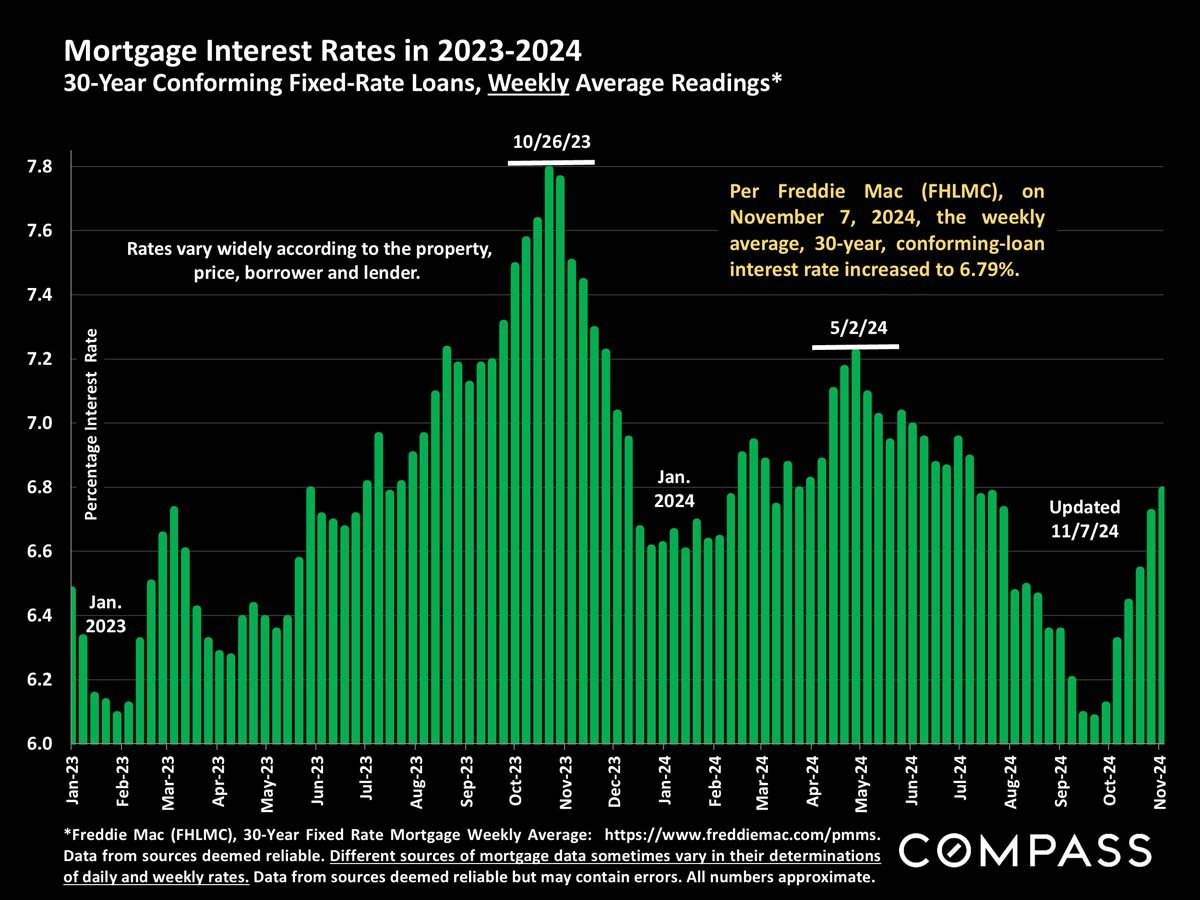
Chart of weekly 30-year fixed mortgage rates, peaking near 7.8% in October 2023 before falling and rising again.
 
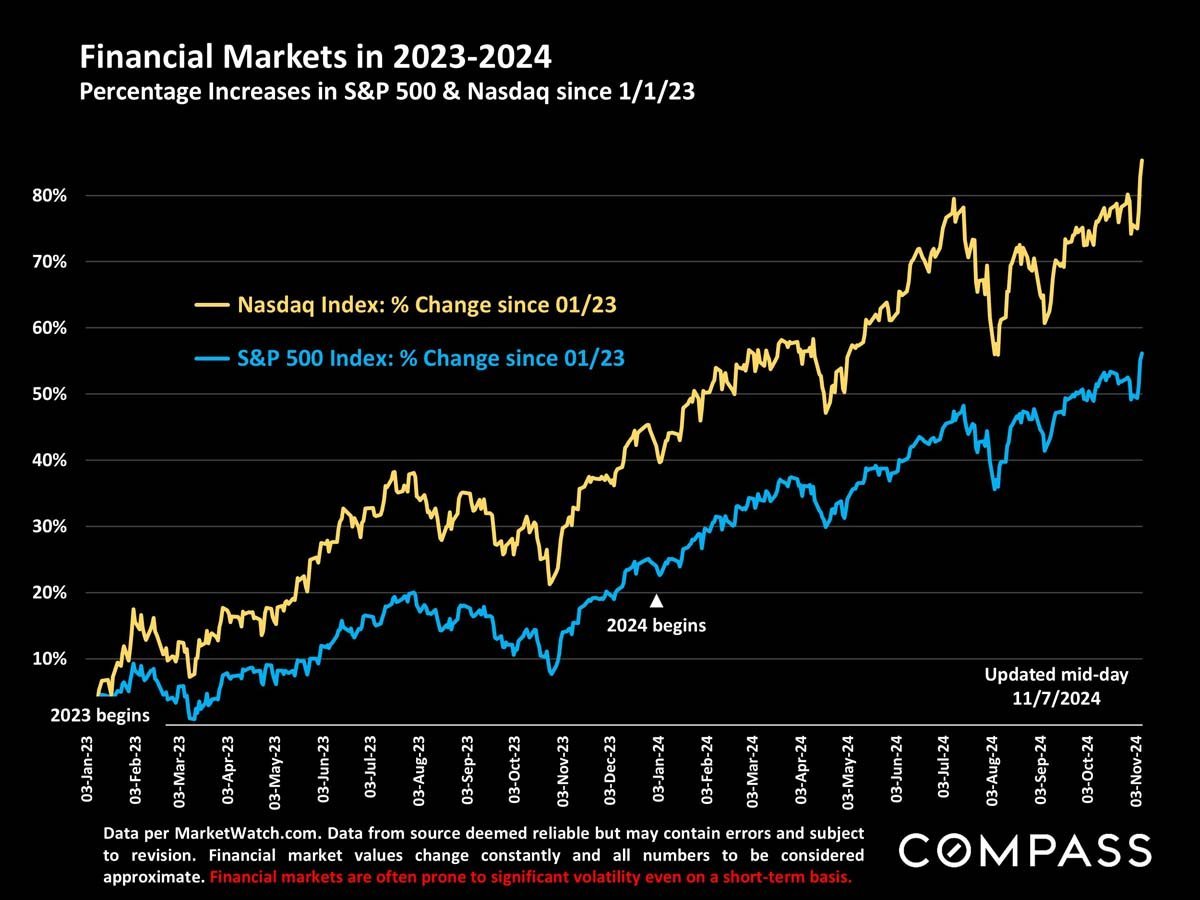
Line chart comparing Nasdaq and S&P 500 gains from January 2023 to November 7, 2024.
 
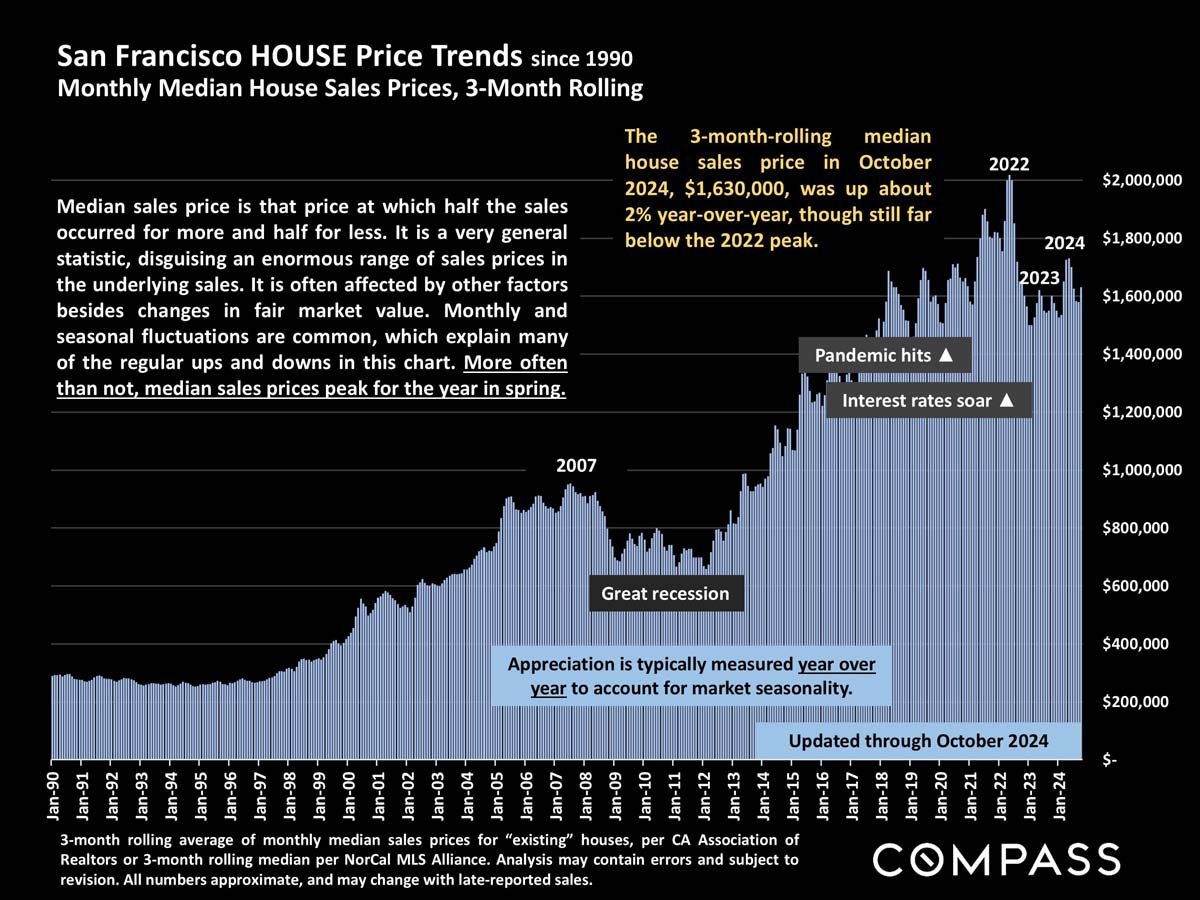
Chart of San Francisco median house prices since 1990, with the October 2024 median at $1.63 million.
 
Chart of San Francisco condo prices since 2005, showing the 2022 peak and October 2024 median of $1.14 million.
 
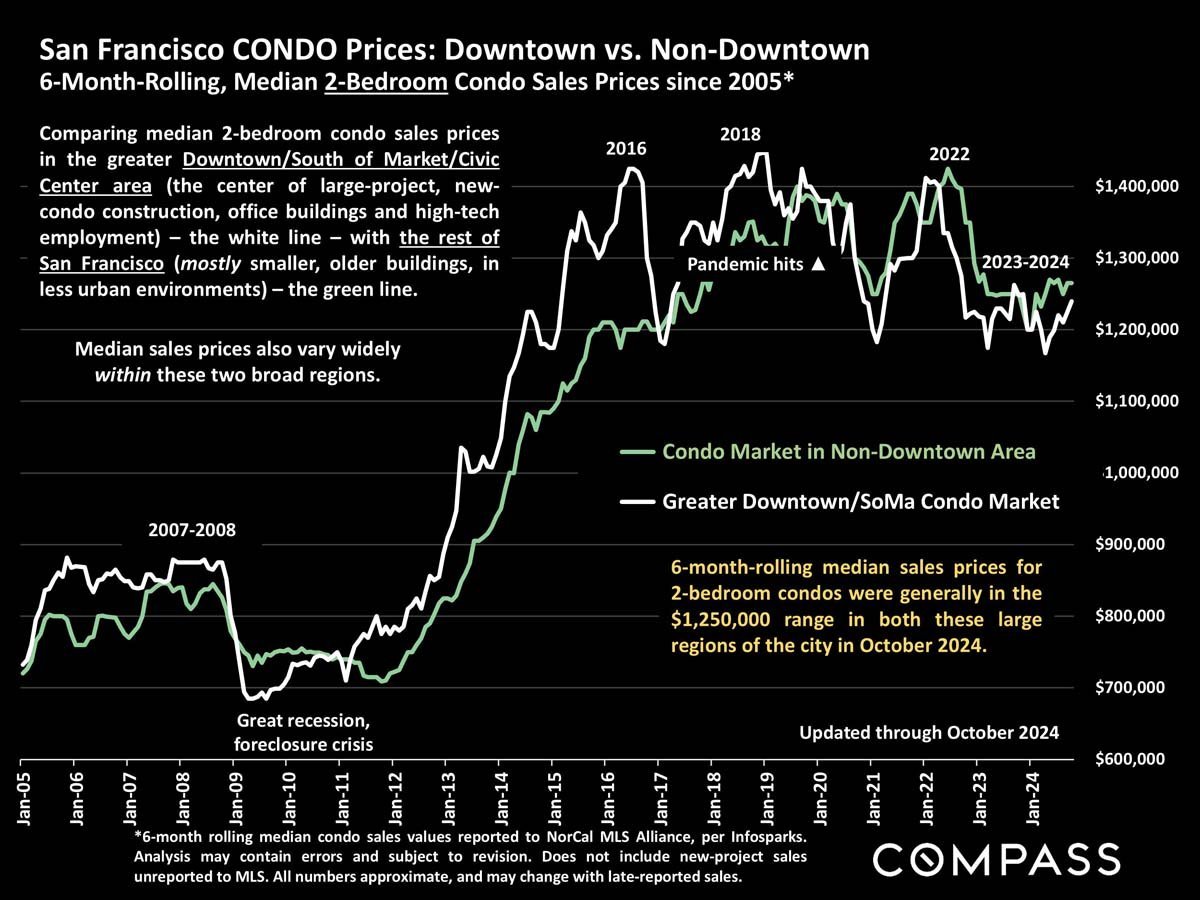
Chart comparing San Francisco two-bedroom condo prices downtown and outside downtown from 2005 through October 2024.
 
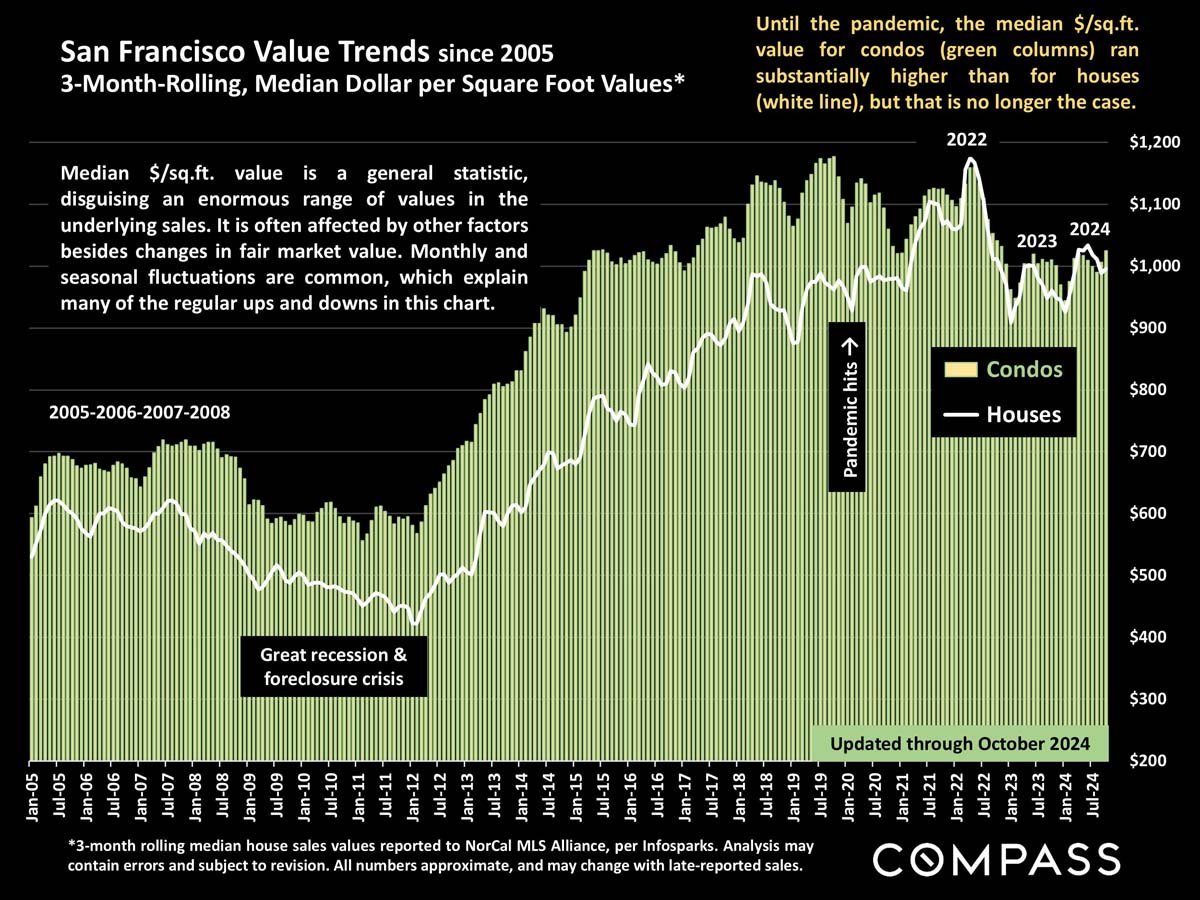
Chart comparing San Francisco condo and house median prices per square foot from 2005 through October 2024.
 
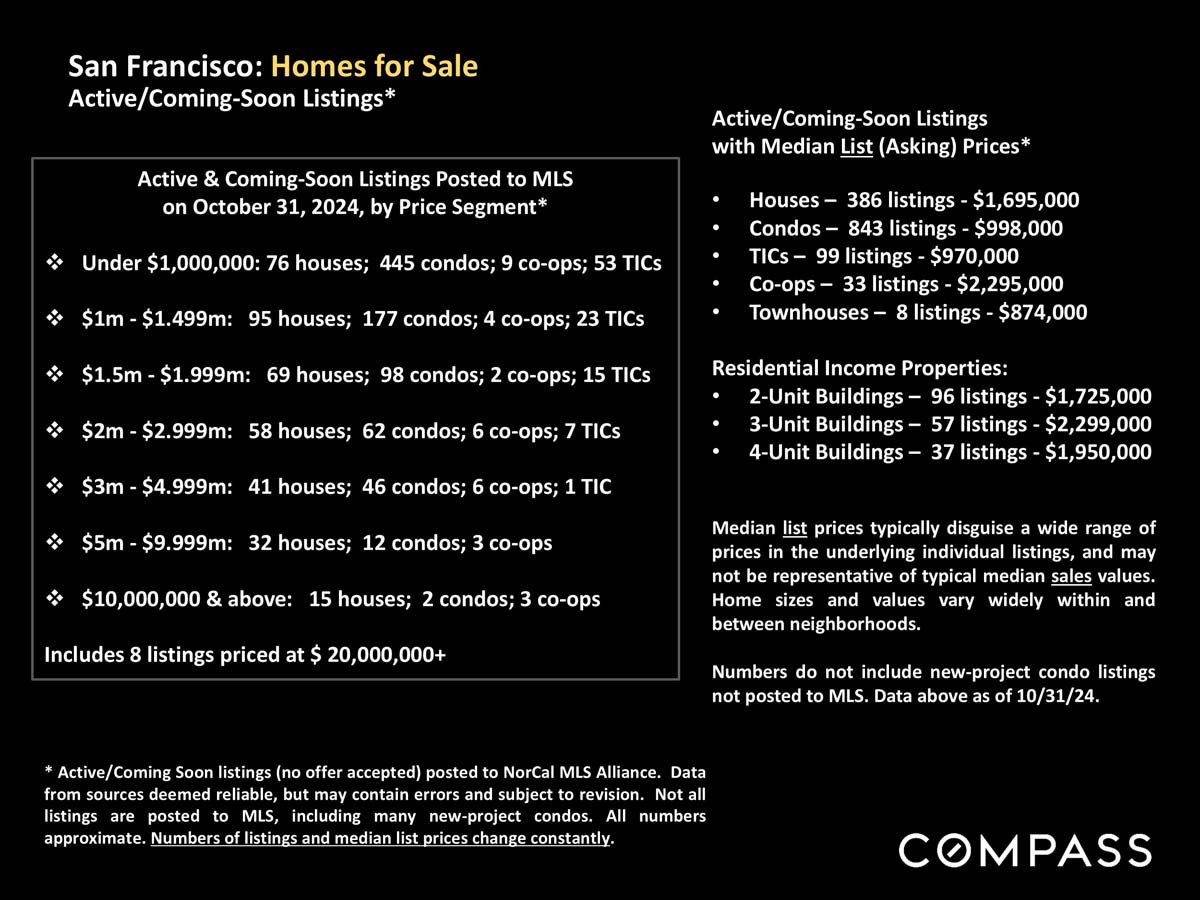
San Francisco home listings infographic with counts by price range and median asking prices as of October 31, 2024.
 
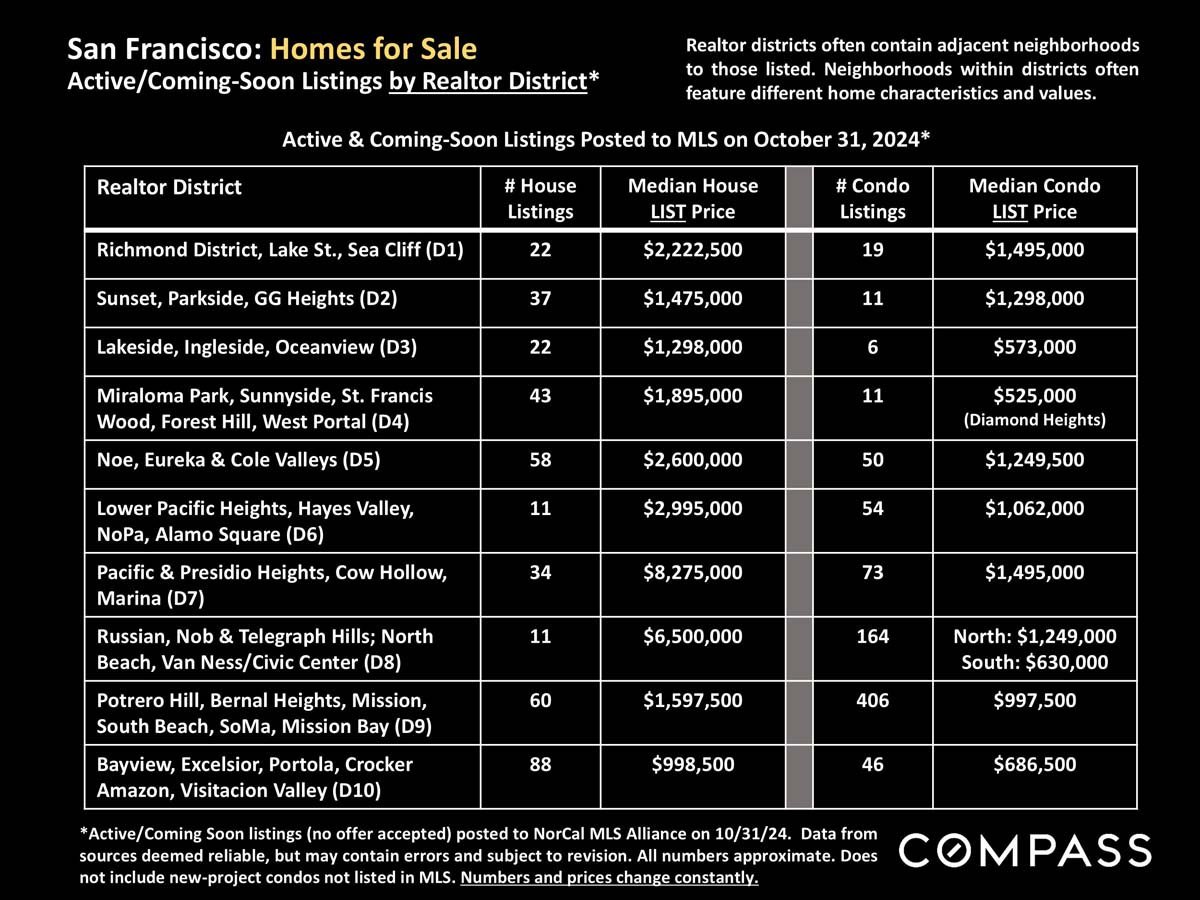
San Francisco listing counts and median house and condo prices by Realtor district, October 31, 2024.
 
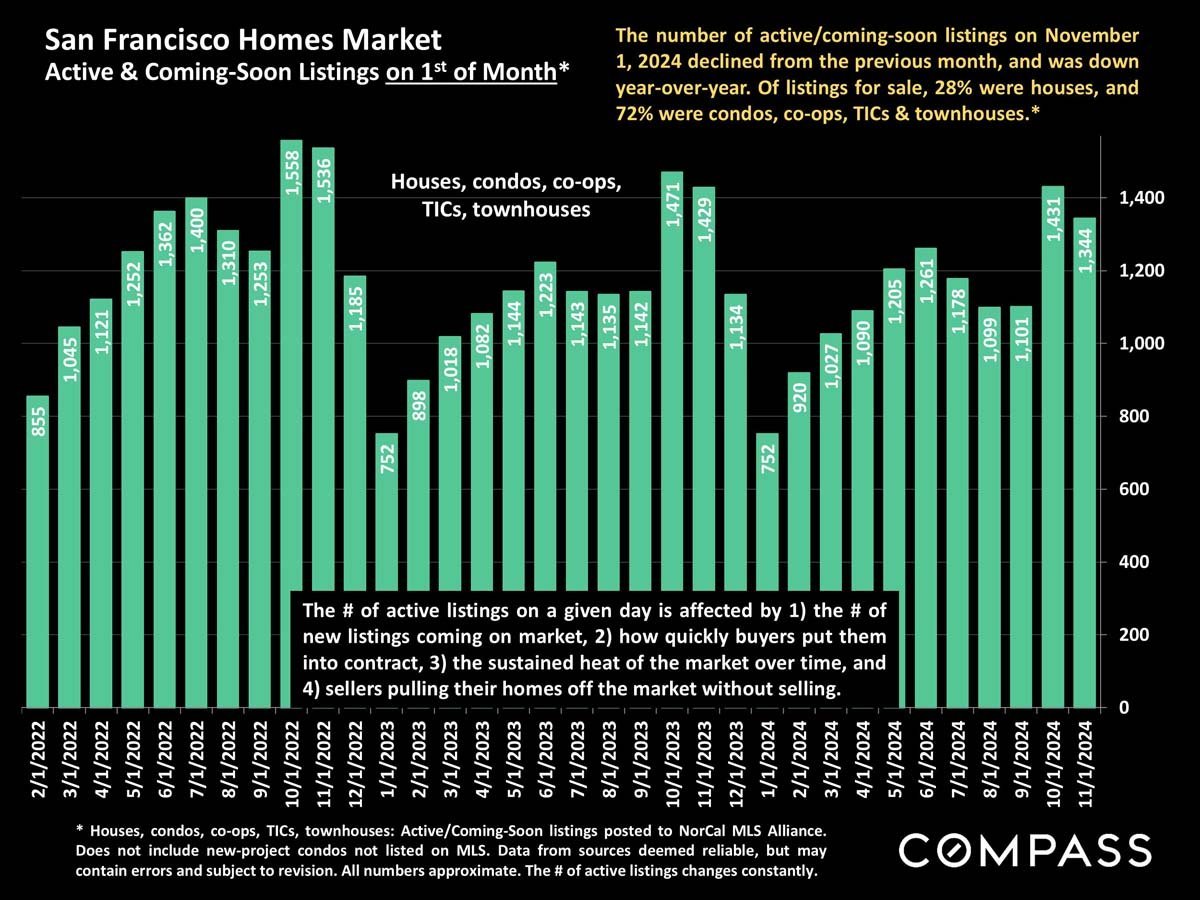
Bar chart of San Francisco active and coming-soon listings by month, February 2022 to November 2024.
 
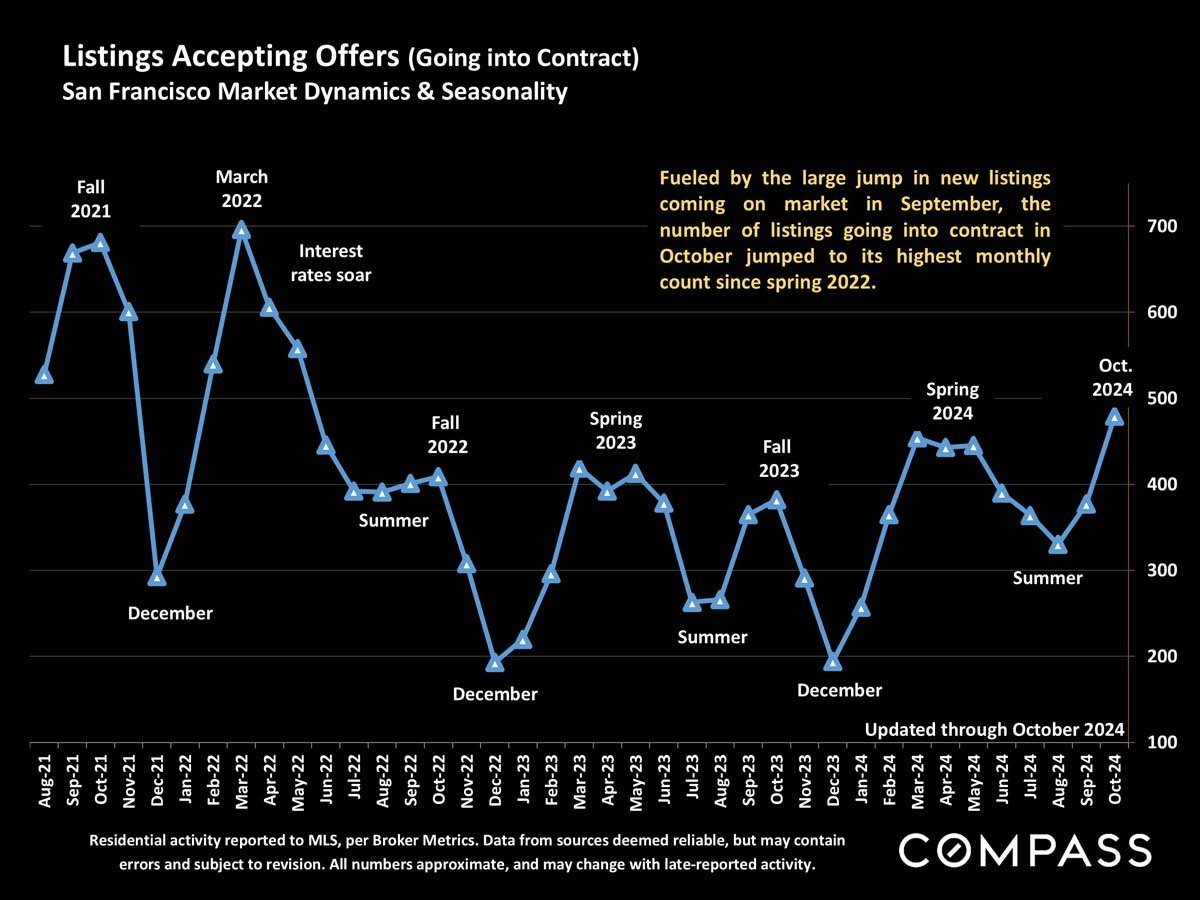
Chart of San Francisco listings accepting offers from August 2021 through October 2024.
 
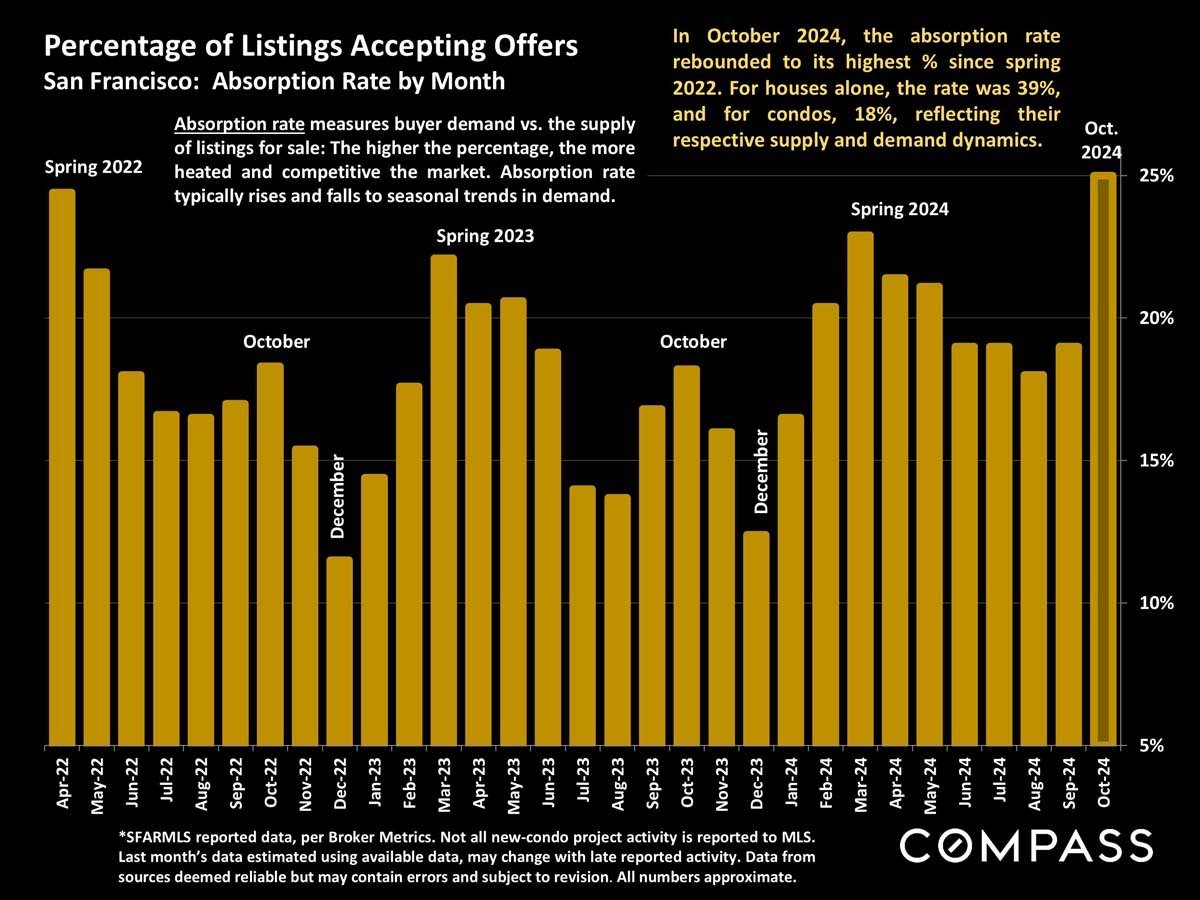
San Francisco monthly absorption-rate chart, April 2022–October 2024; listings accepting offers peak near 25% in October 2024.
 
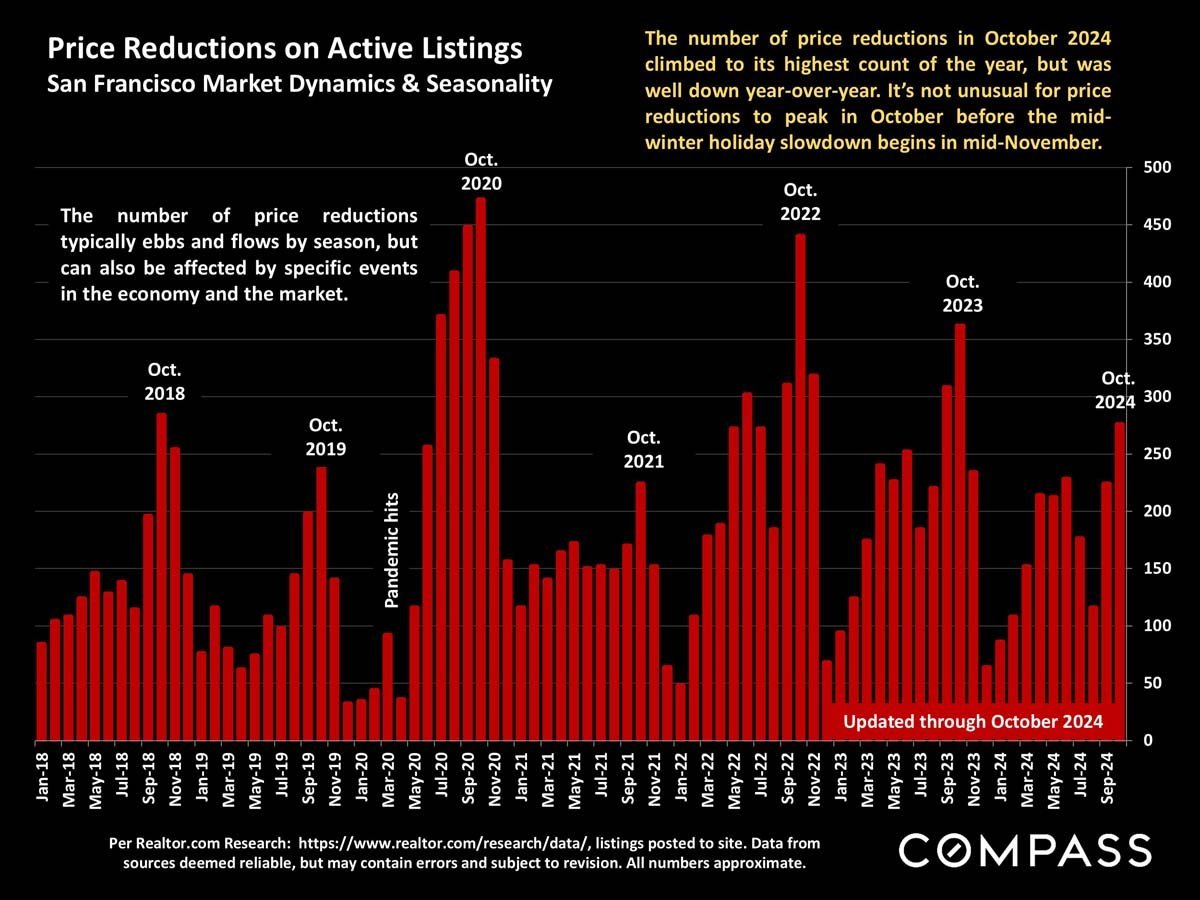
Chart of San Francisco active-listing price reductions, with monthly red bars from 2018 through October 2024.
 
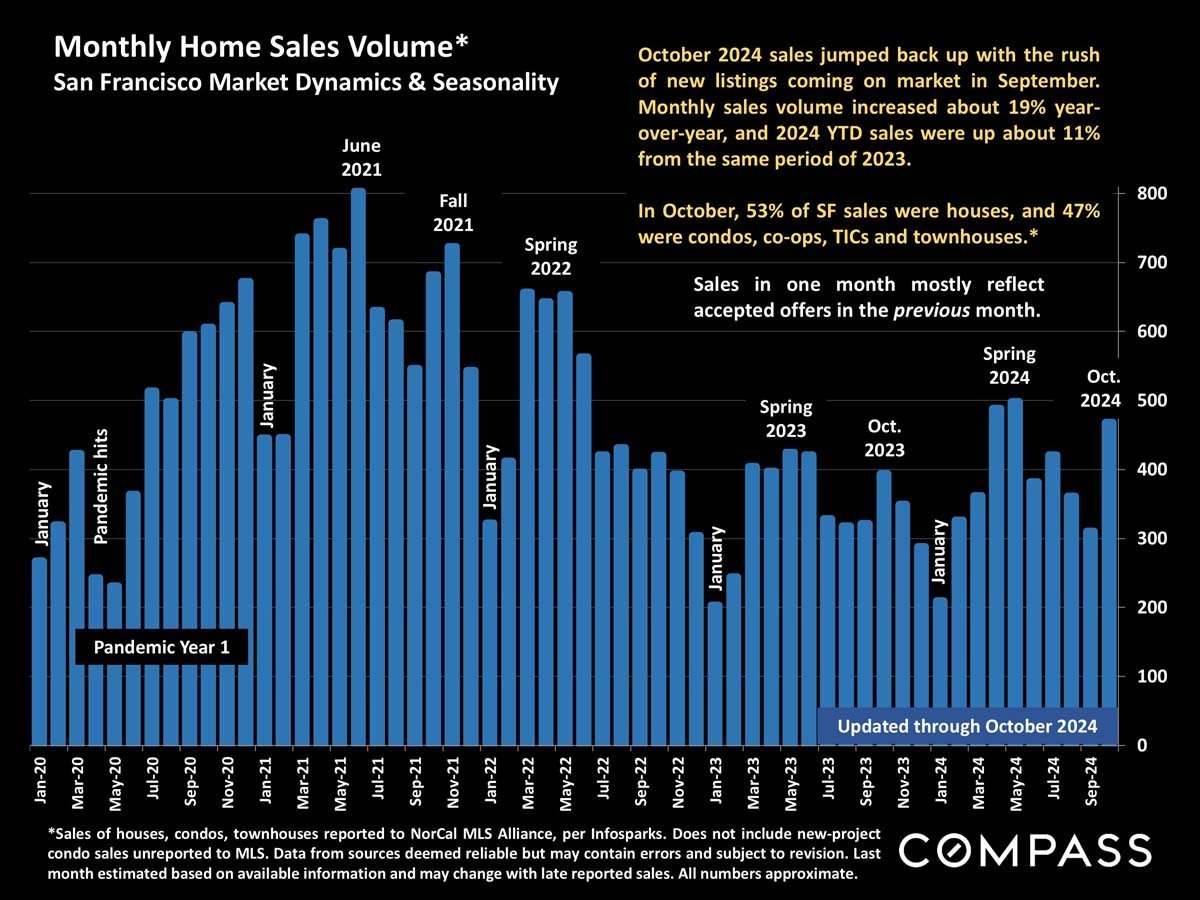
Chart of monthly San Francisco home sales, January 2020–October 2024, with October 2024 market notes.
 
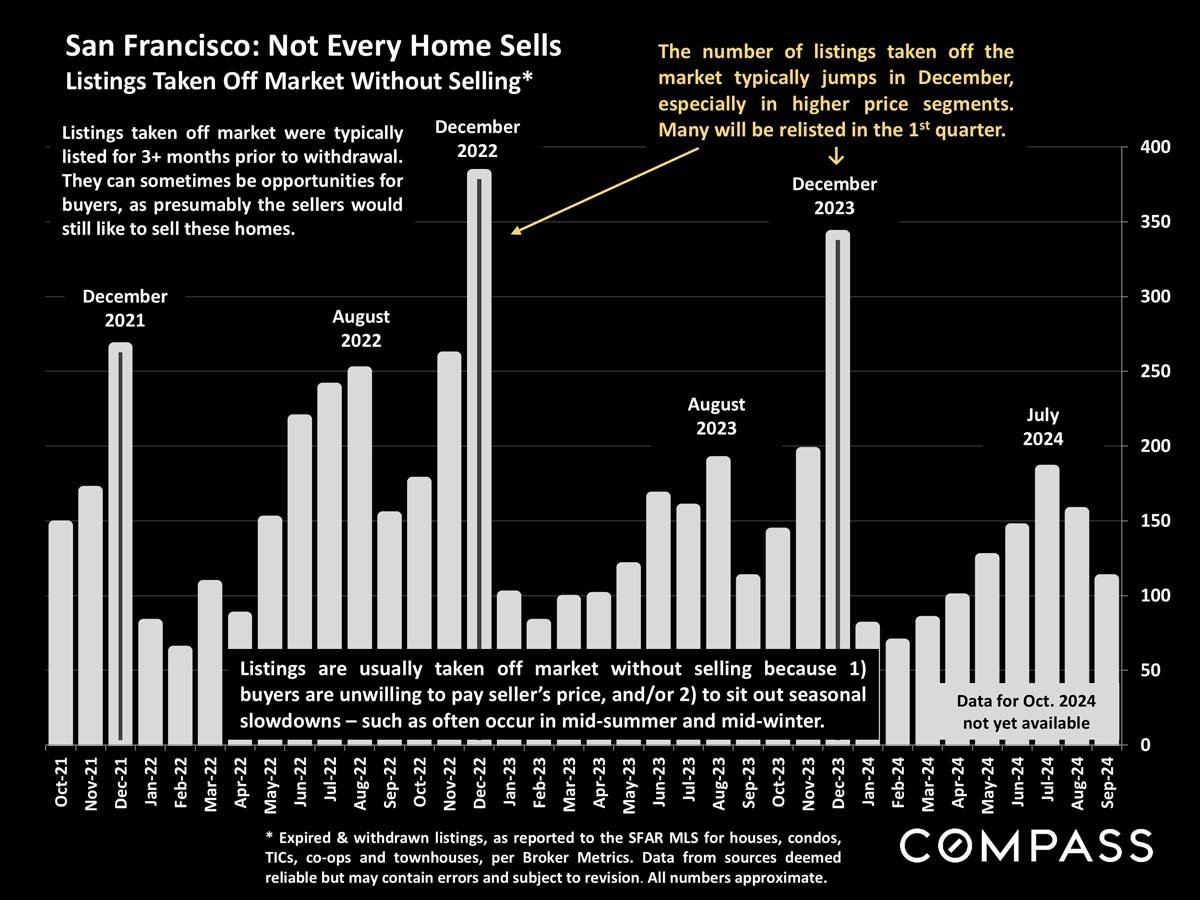
Bar chart of San Francisco withdrawn listings, showing pronounced December peaks from October 2021 to September 2024.
 
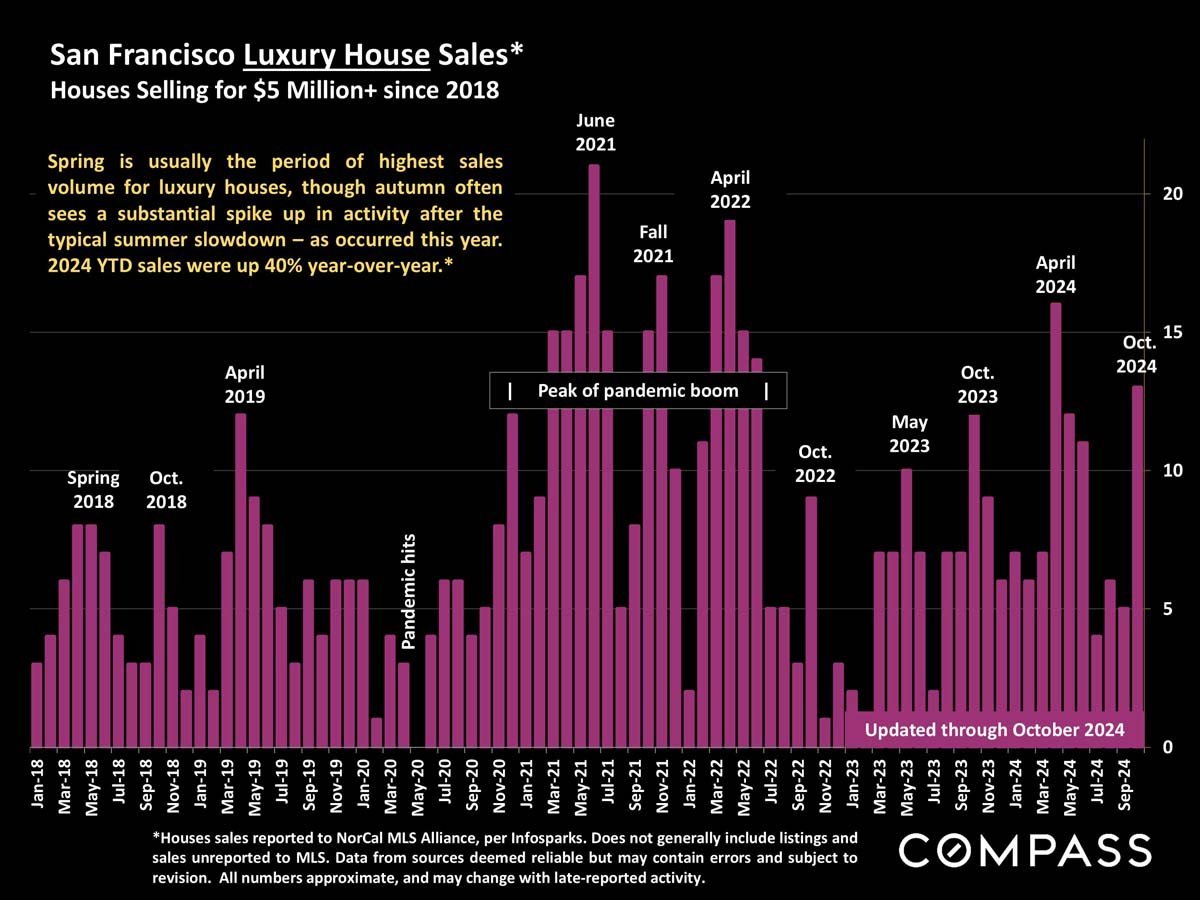
Chart of San Francisco sales of $5 million-plus homes from 2018 to October 2024, with monthly bars and market milestones.
 
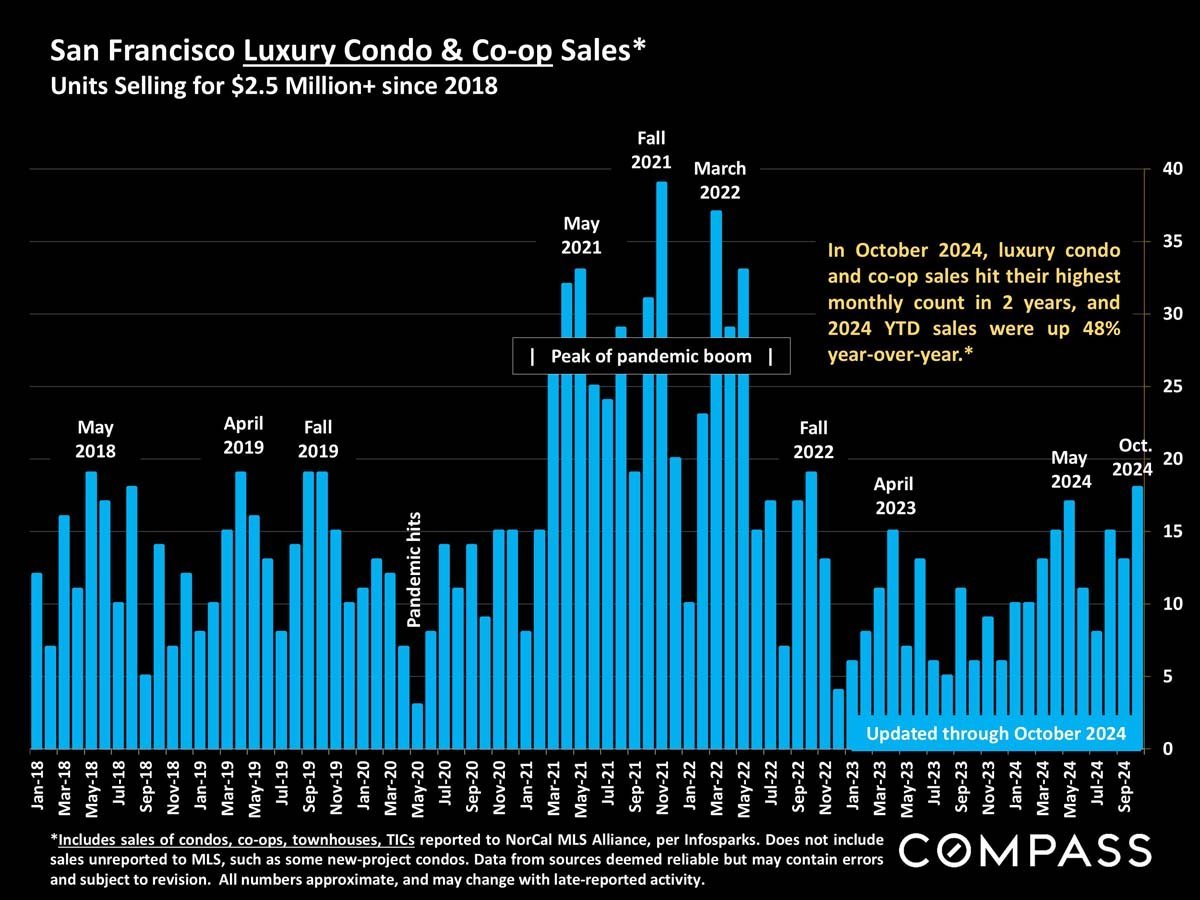
Chart of San Francisco luxury condo and co-op sales since 2018, with a 48% year-to-date increase in 2024.
 
San Francisco chart comparing houses and condo days on market, January 2020–October 2024.
 
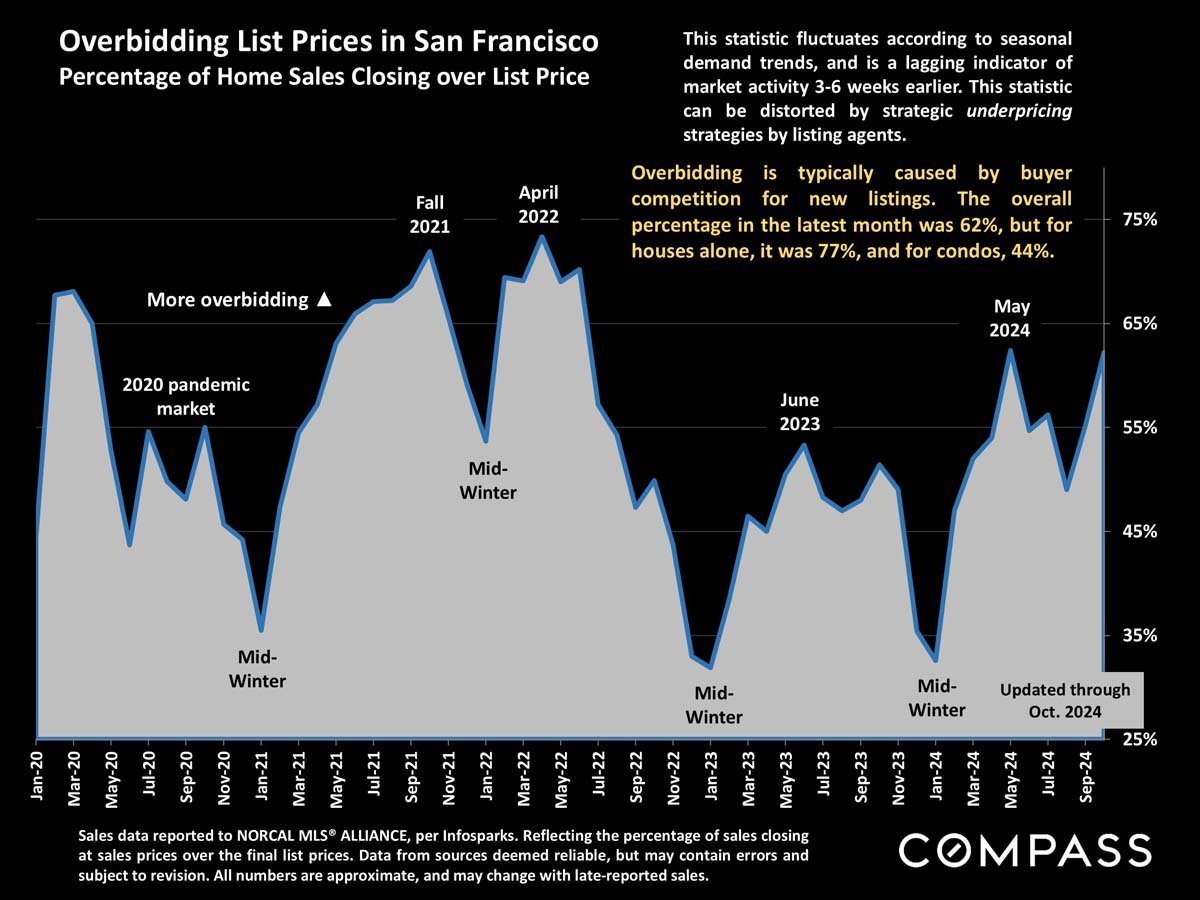
Chart of San Francisco home sales over list price, showing monthly fluctuations from 2020 through October 2024.
 
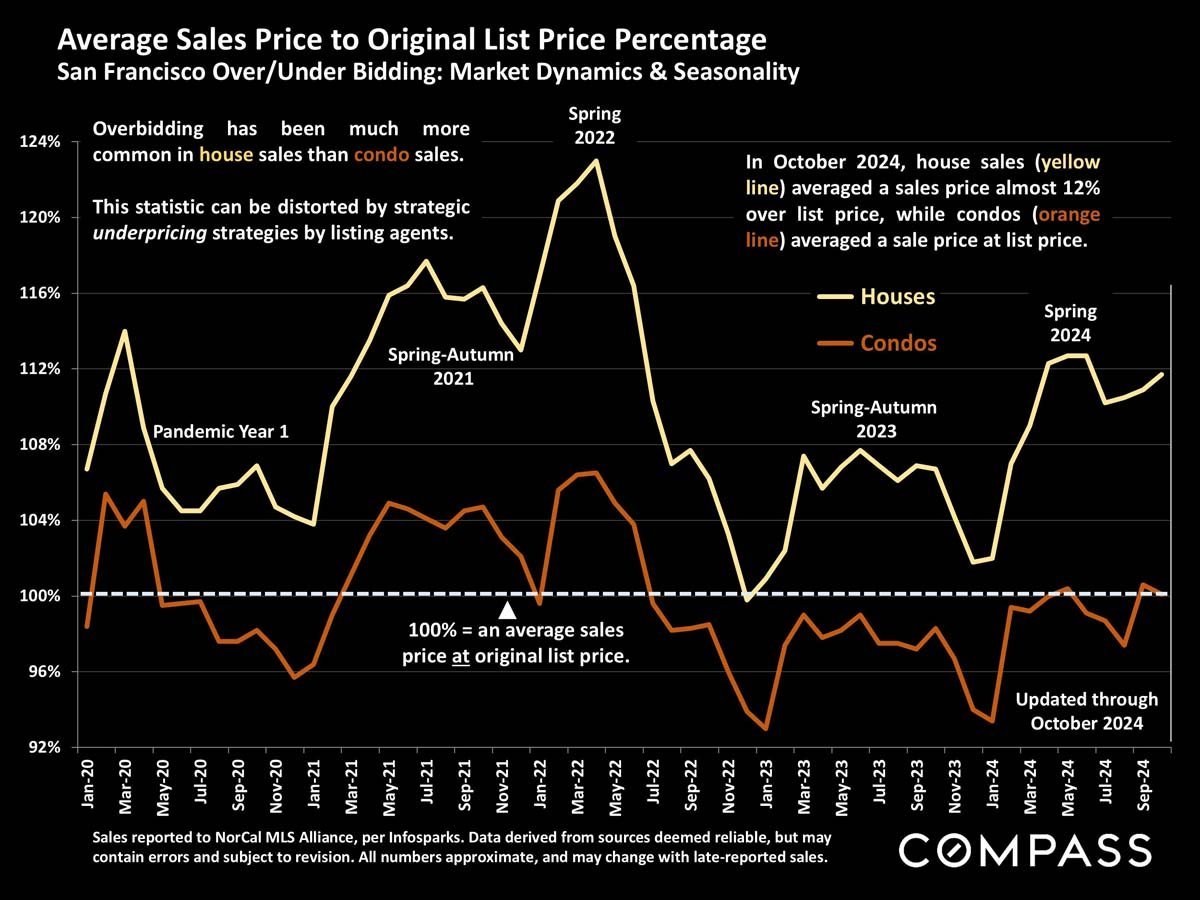
Chart comparing San Francisco house and condo sale prices with original list prices from 2020 to October 2024.
 
Infographic compares California’s 2023 in-migration and out-migration rankings, totals, and the share moving within the state.
 
Pie chart compares housing-unit counts across 11 Bay Area counties; Santa Clara leads with 703,922 units.
 
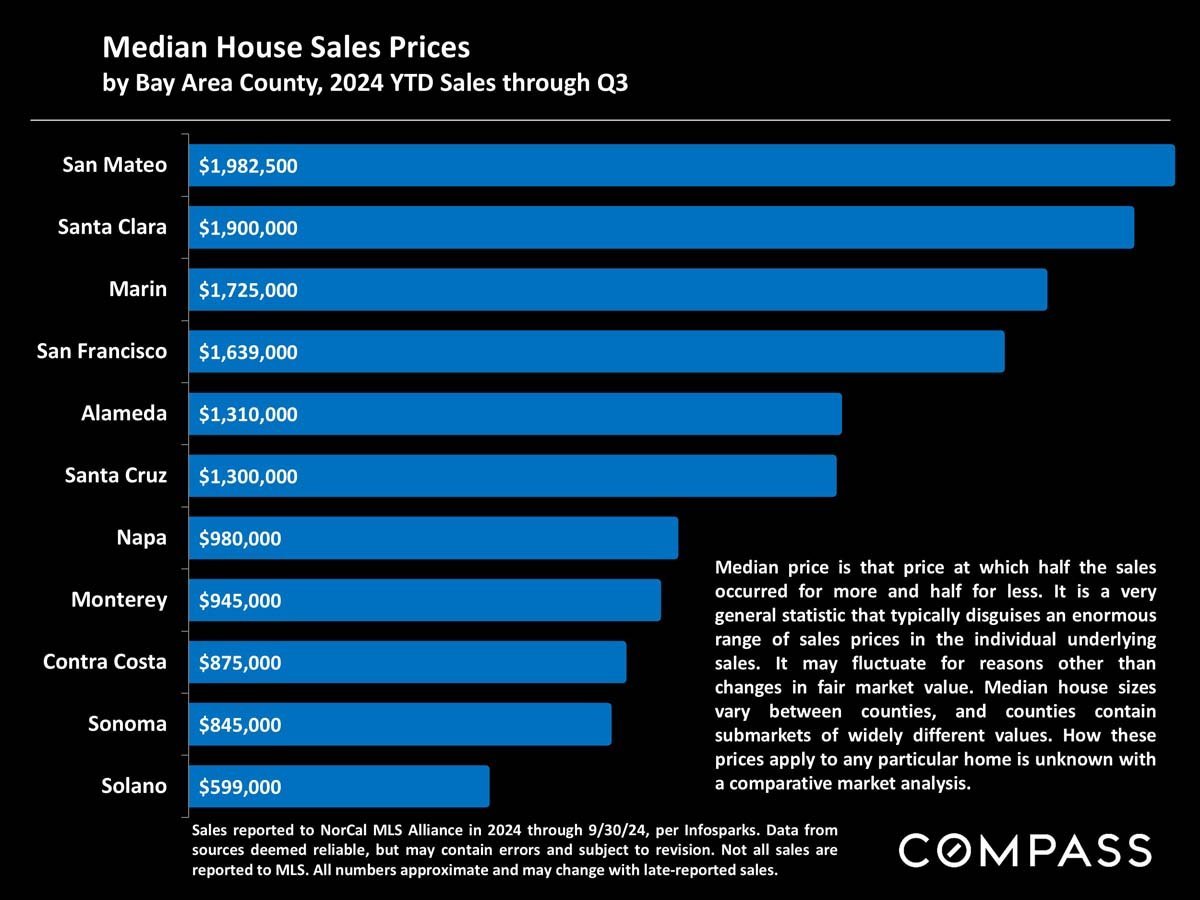
Bar chart of 2024 Bay Area county median home prices; San Mateo leads at $1,982,500 and Solano is lowest at $599,000.
 
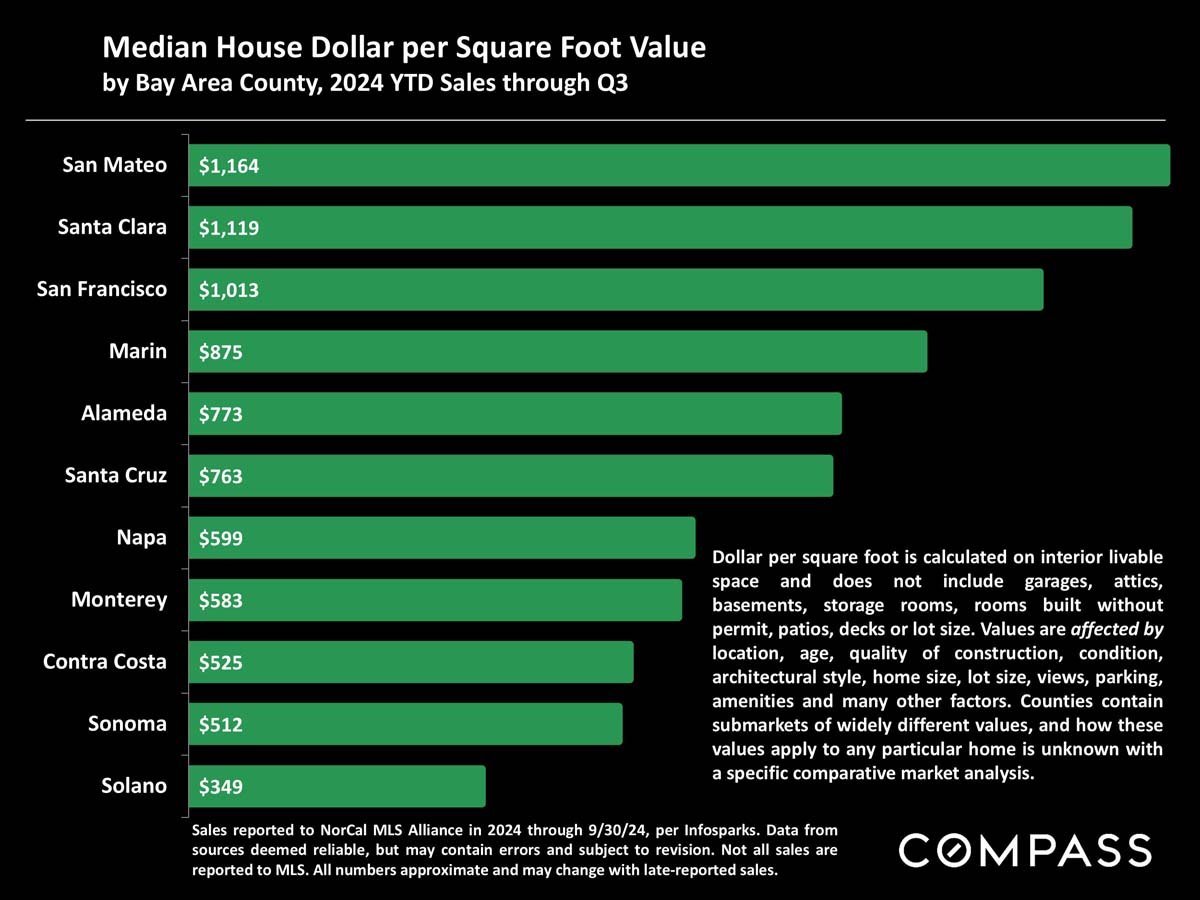
Chart comparing 2024 year-to-date house prices per square foot across 11 Bay Area counties; San Mateo leads at $1,164.
 
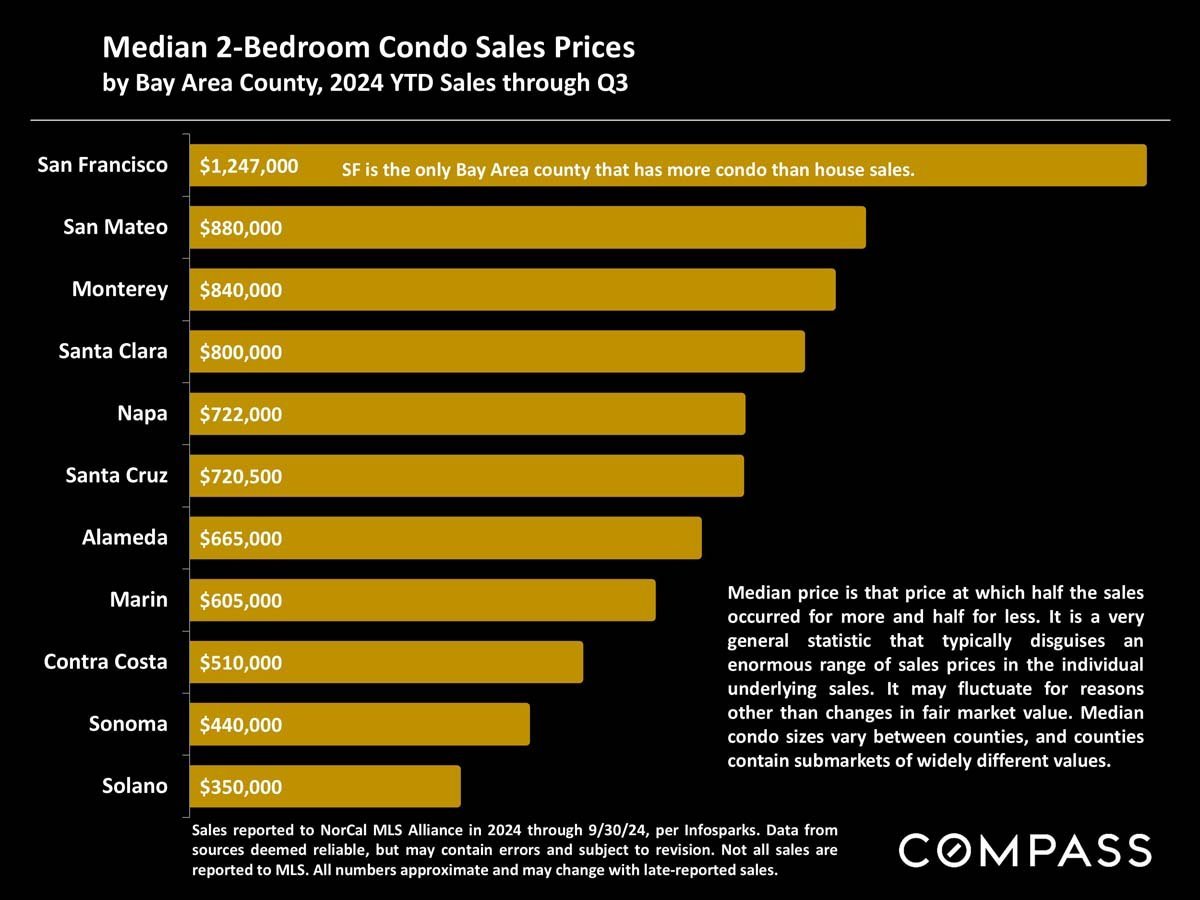
Chart comparing 2024 median two-bedroom condo prices across 11 Bay Area counties; San Francisco leads at $1,247,000.
 
San Francisco Bay Area home sales pie chart by price segment, with 26% under $750,000 and 22% from $1 million to $1.5 million.
 
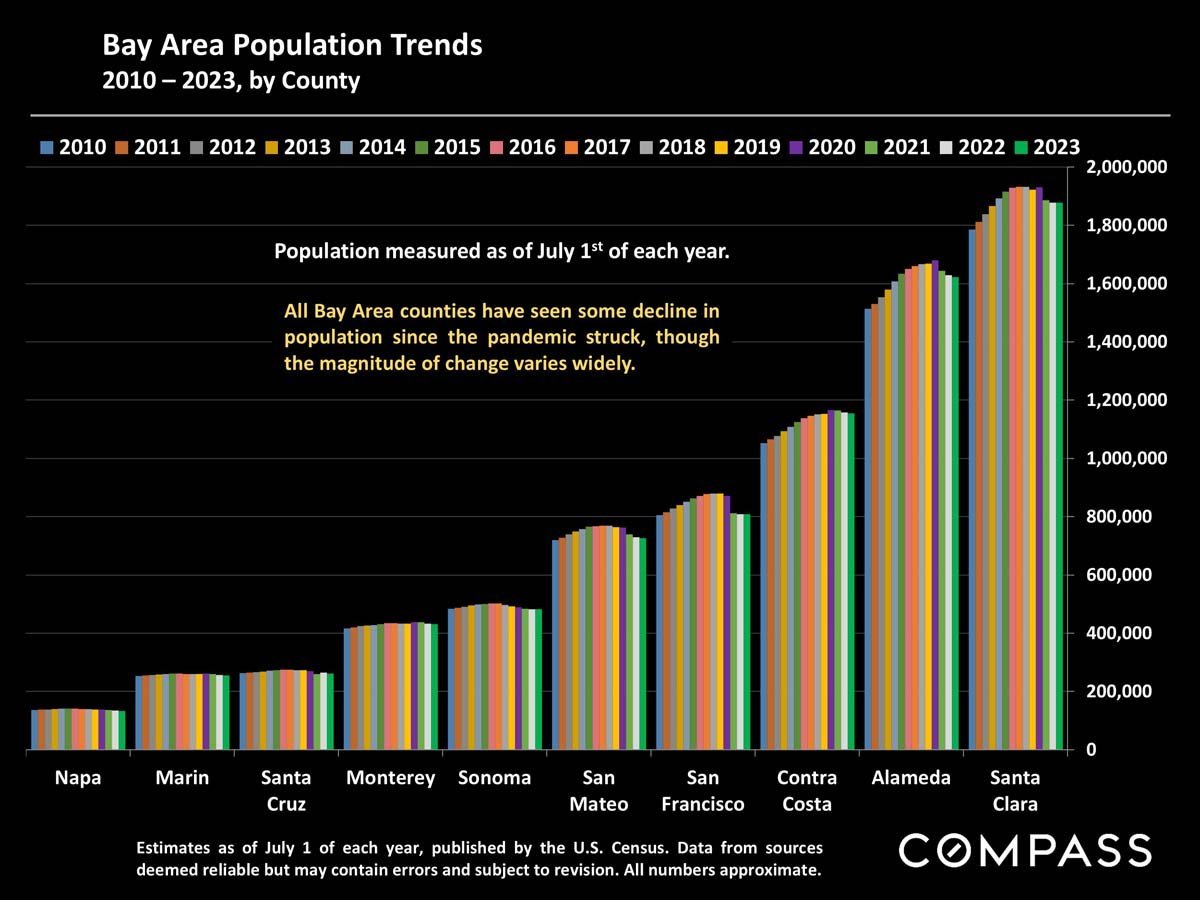
Bar chart comparing Bay Area county populations from 2010 to 2023, with recent declines noted.
 
Pie chart comparing Bay Area county land areas, with Monterey largest and San Francisco smallest.
 
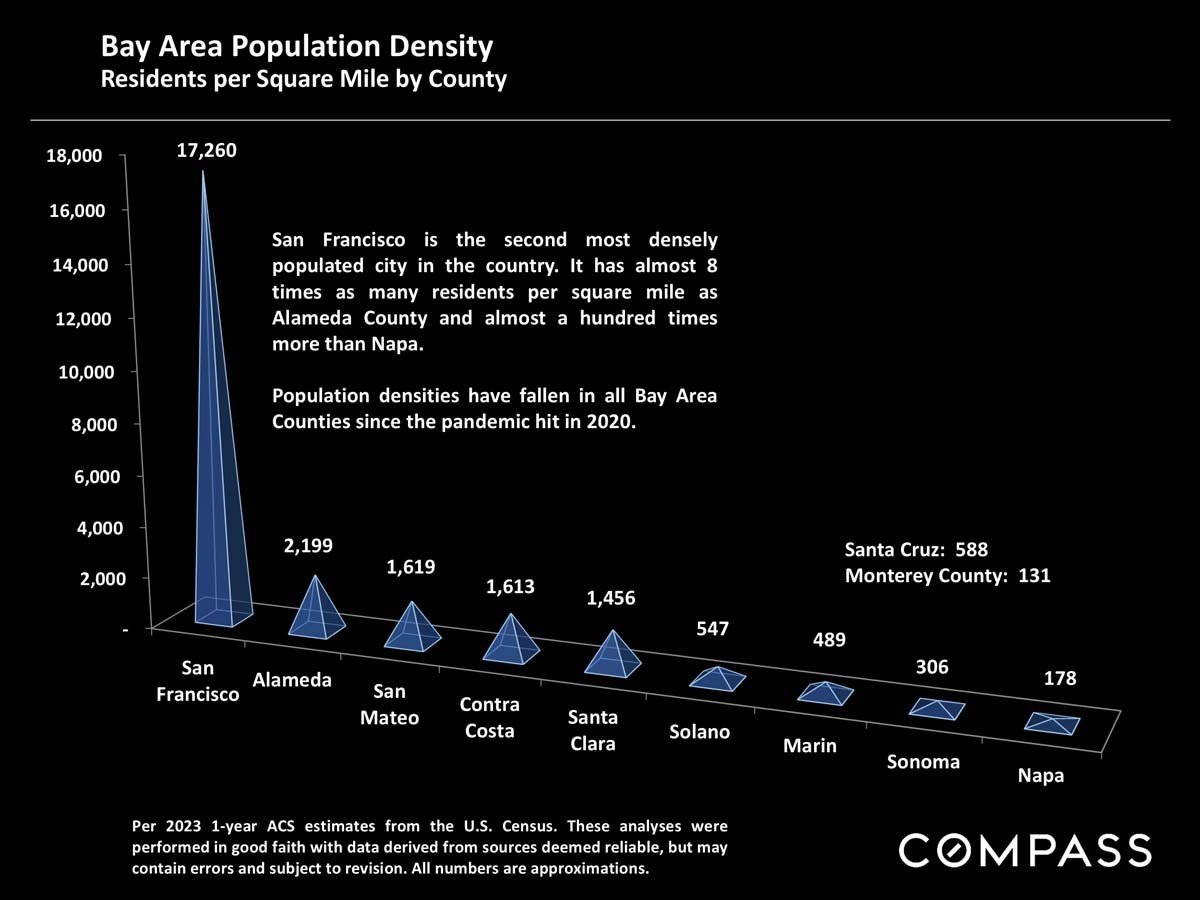
Chart comparing population density across Bay Area counties, with San Francisco highest at 17,260 residents per square mile.
 
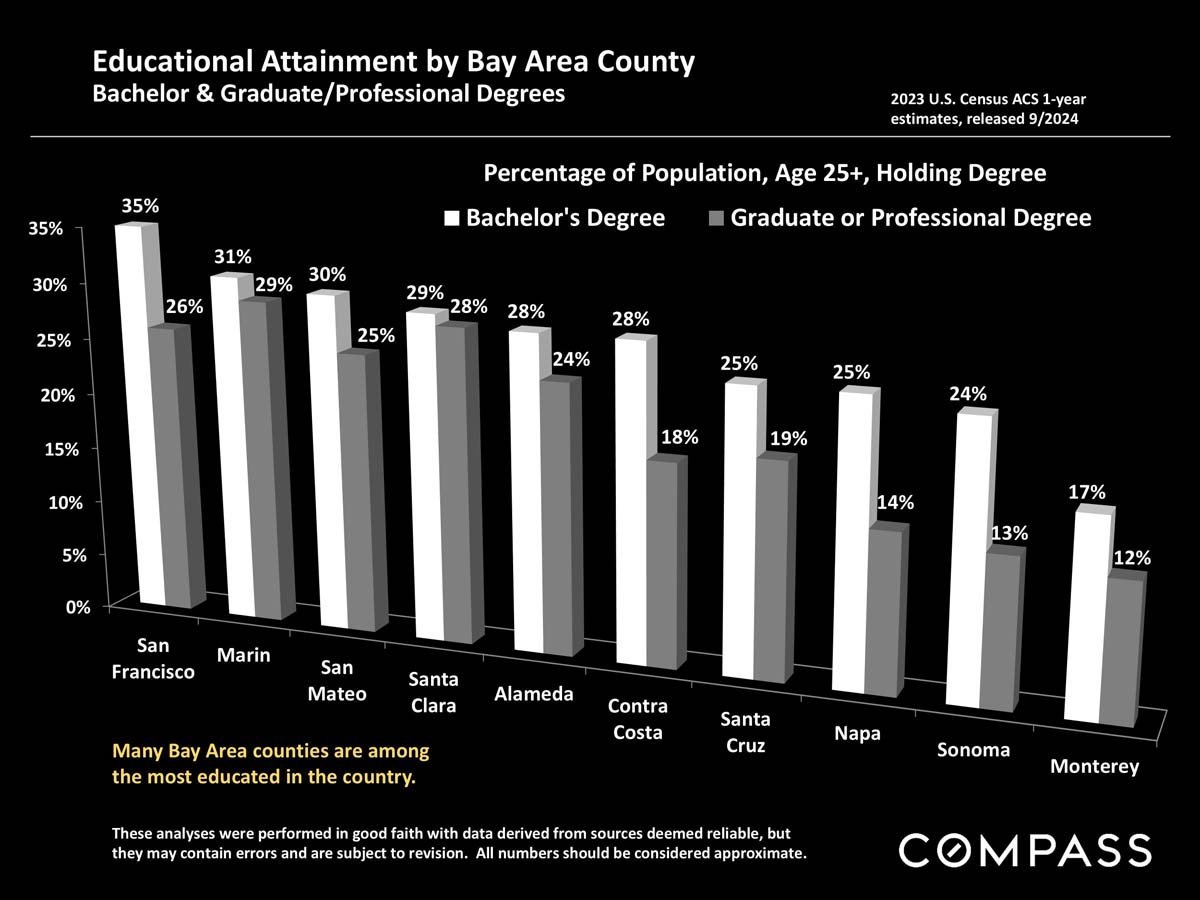
Bar chart comparing bachelor’s and graduate degree attainment across ten Bay Area counties; San Francisco leads, Monterey trails.
 
Chart comparing San Francisco median earnings by education and gender; male earnings are higher in every category.
 
Chart comparing owner- and tenant-occupied housing percentages across 11 Bay Area counties.
 
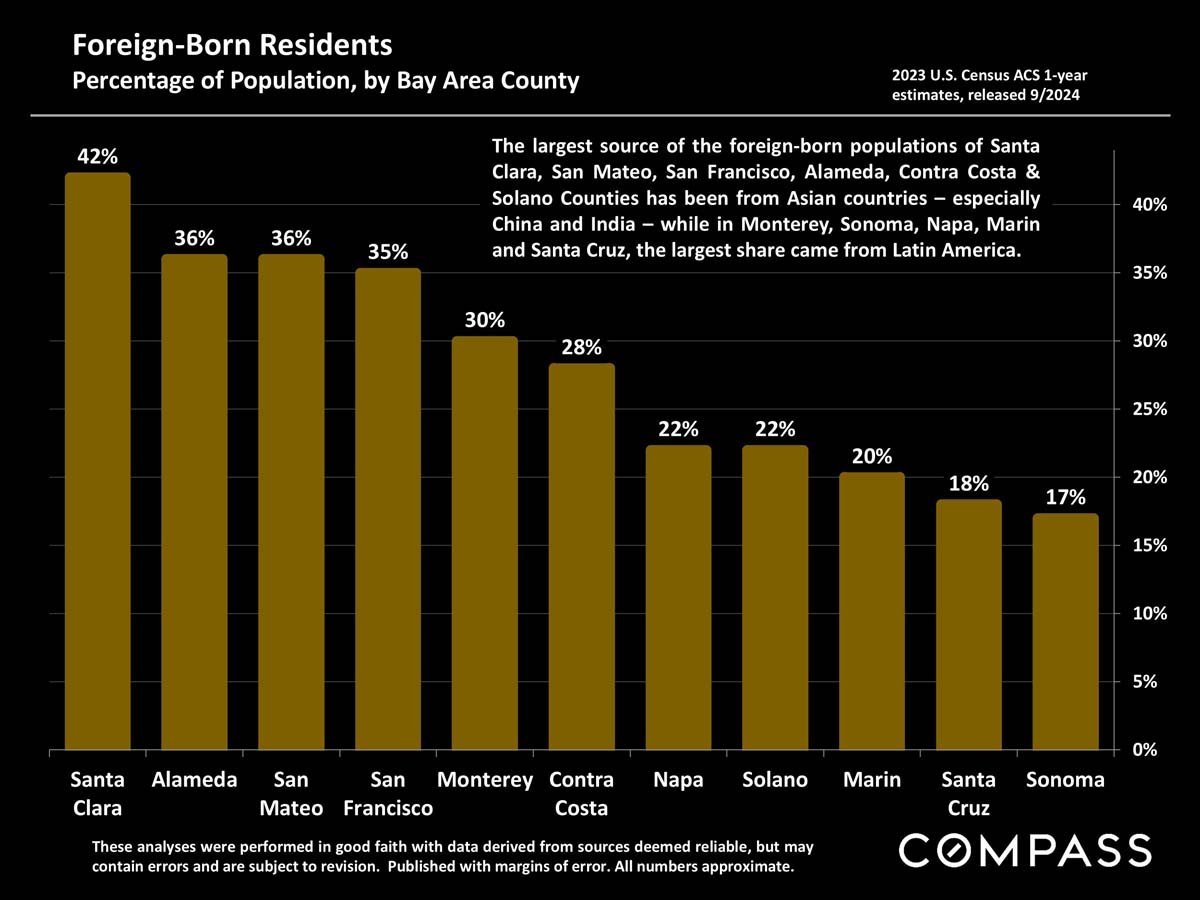
Bar chart of foreign-born residents by Bay Area county; Santa Clara leads at 42%, while Sonoma is lowest at 17%.
 
Infographic comparing languages spoken at home across ten Bay Area counties using 2022 Census estimates.
 
Real estate market statistics definitions and disclaimers, including Compass licensing and legal information.

Work With Jane

Get assistance in determining the current property value, crafting a competitive offer, writing and negotiating a contract, and much more. Contact me today.

Follow Me on Instagram