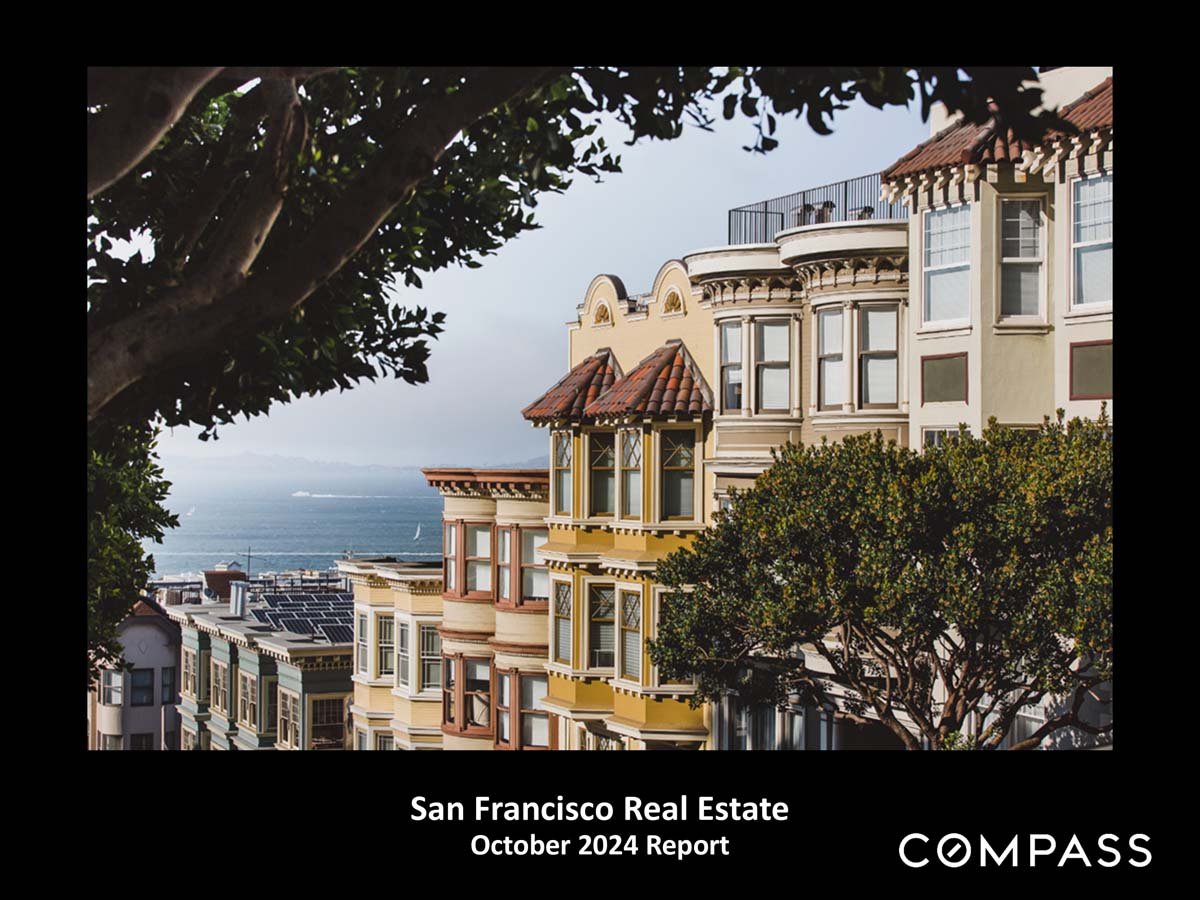
San Francisco Real Estate October 2024 Report

San Francisco Home Prices, Market Conditions & October 2024

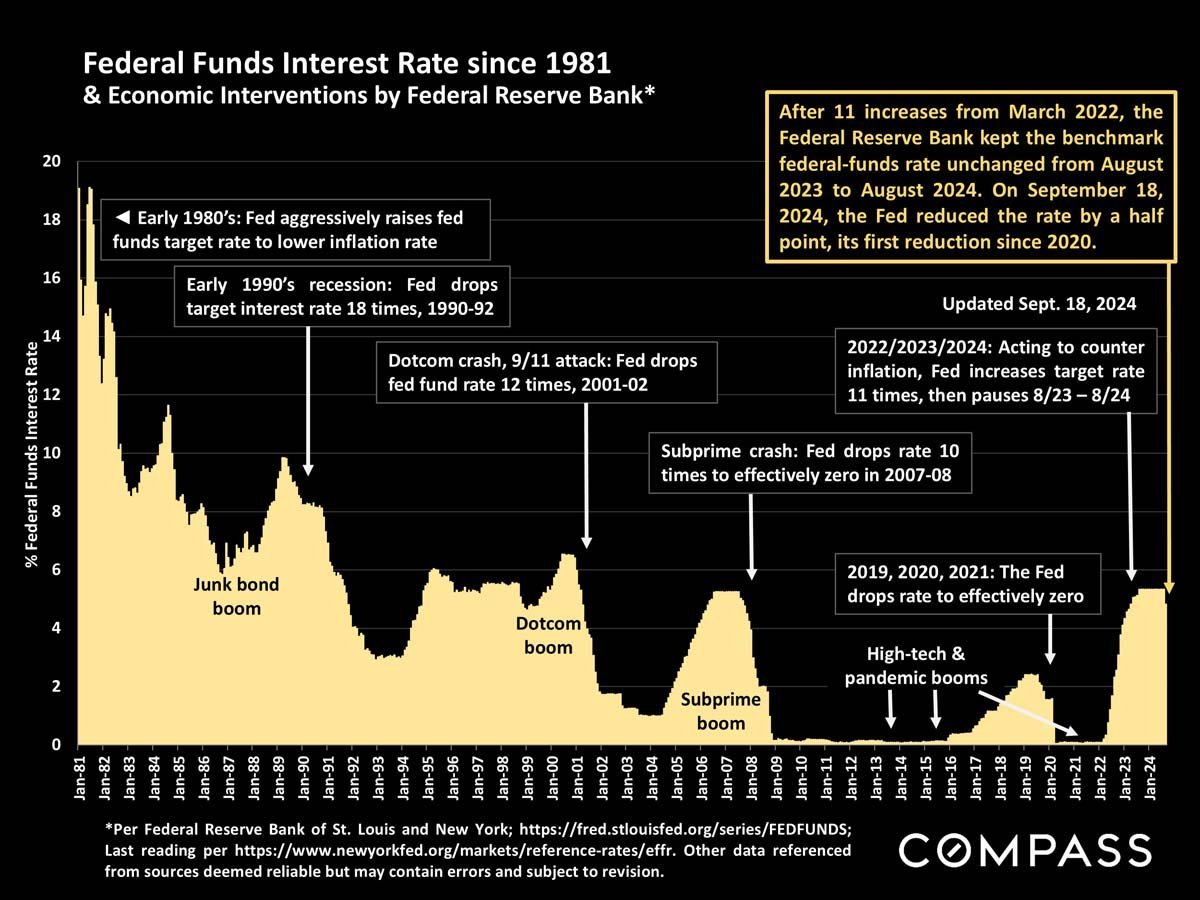
On September 18th, the Federal Reserve Bank dropped its benchmark rate for the first time since 2020, a very positive development for housing markets, and many analysts expect one or more additional cuts before the end of the year.
 
San Francisco Real Estate October 2024 Report
 
October 2024 housing market update covering interest rates, buyer demand, new listings, and seasonal trends.
 
Chart of federal funds interest rates since 1981, annotated with Federal Reserve actions and economic events.
 
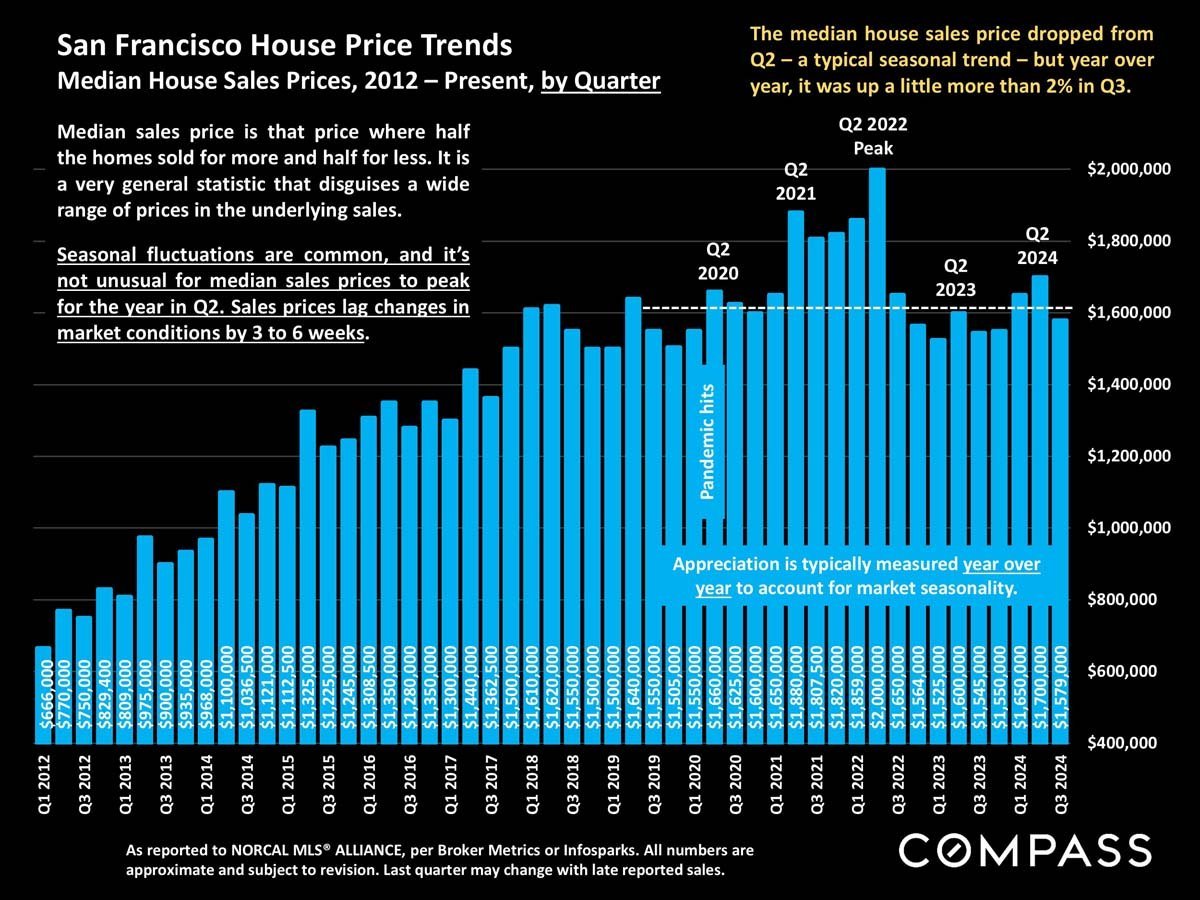
Chart of San Francisco quarterly median house sale prices from 2012 to 2024, peaking at $2 million in Q2 2022.
 
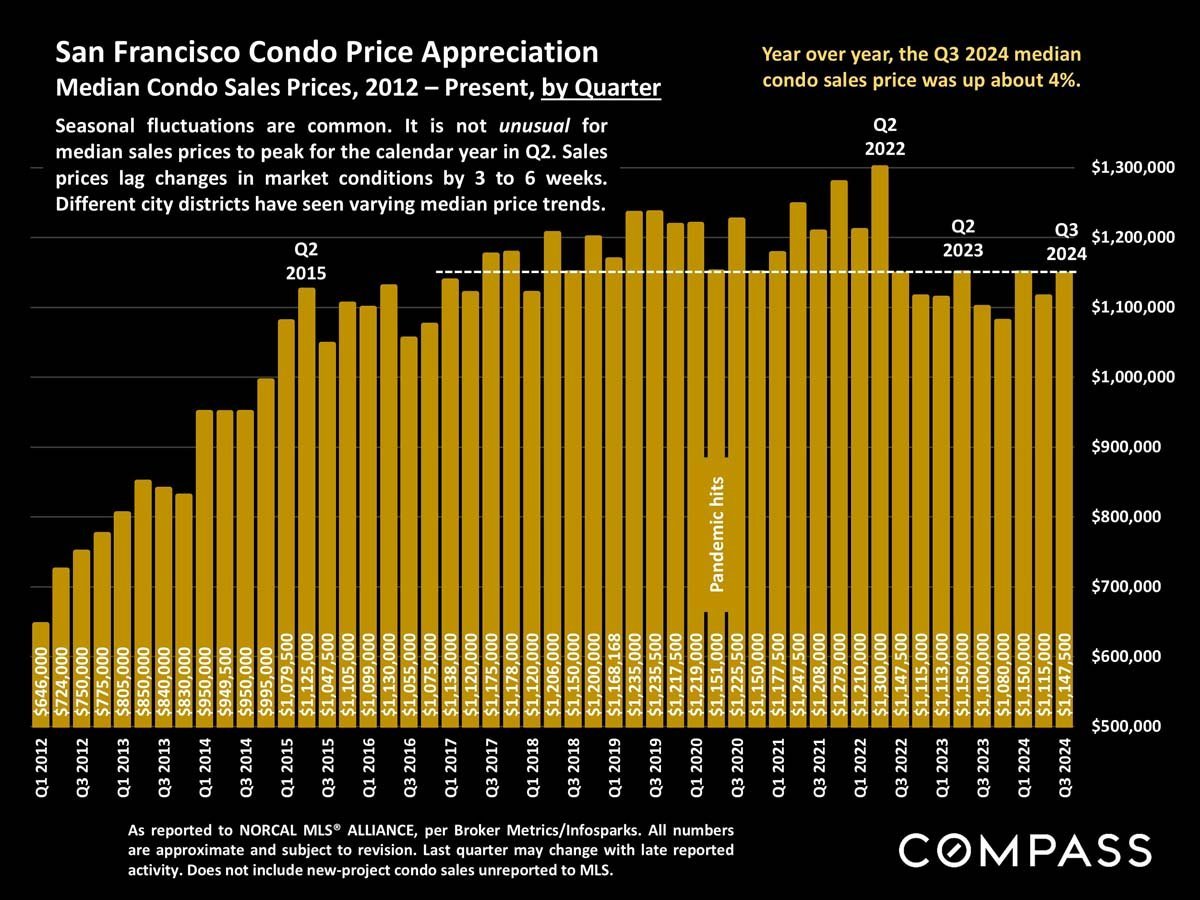
Bar chart of San Francisco median condo sale prices by quarter, 2012–2024, with recent prices near $1.15 million.
 
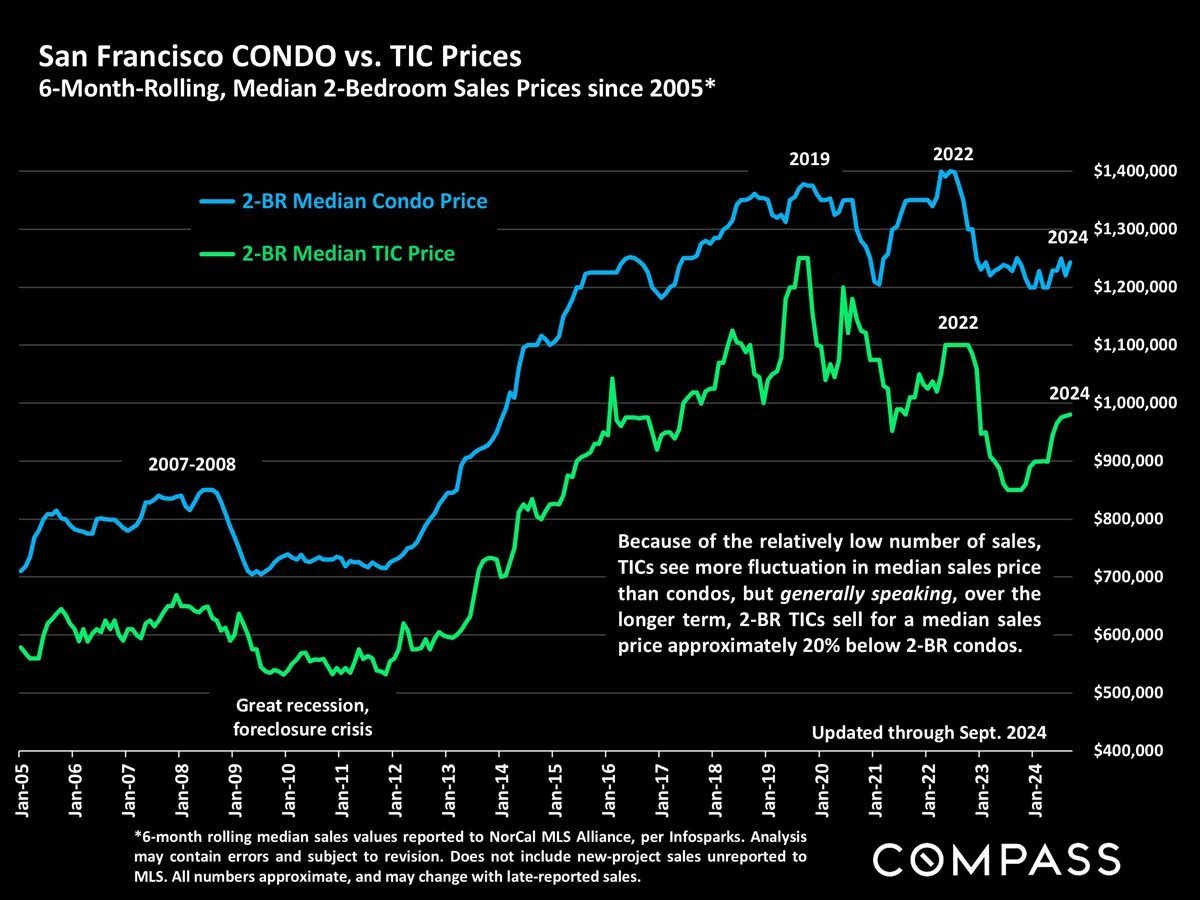
Chart comparing San Francisco two-bedroom condo and TIC median prices from 2005 to September 2024; TICs generally sell for less.
 
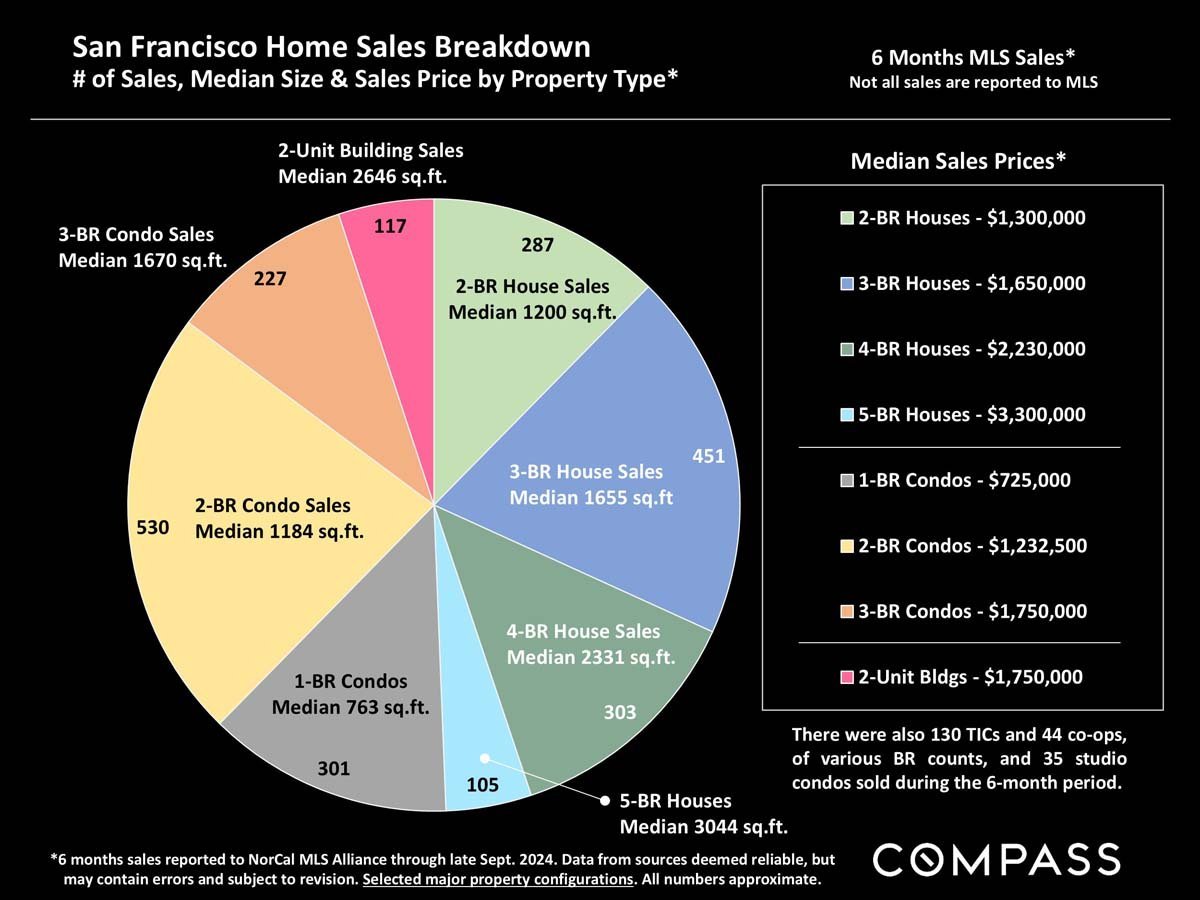
San Francisco six-month home sales chart compares sales counts, median sizes, and prices by property type.
 
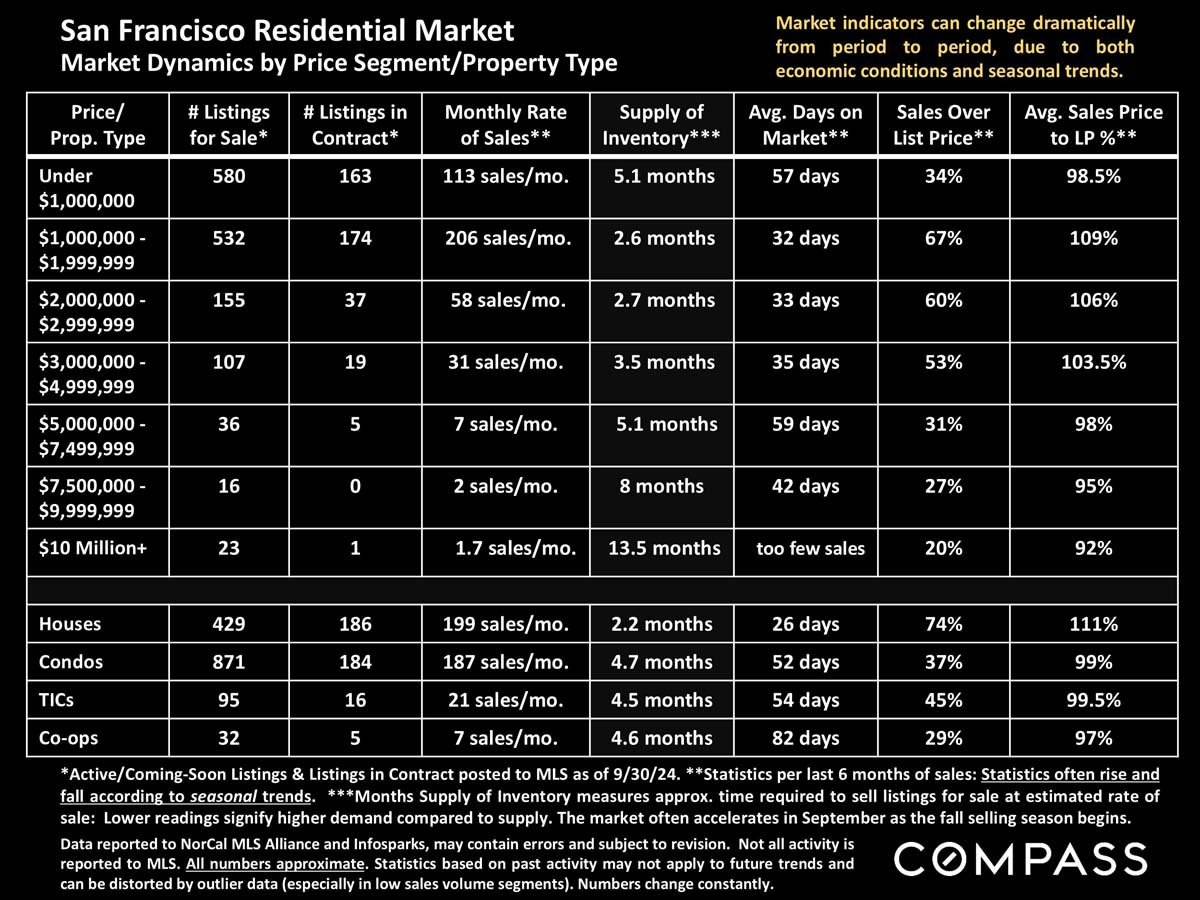
San Francisco residential market infographic comparing sales and inventory by price segment and property type.
 
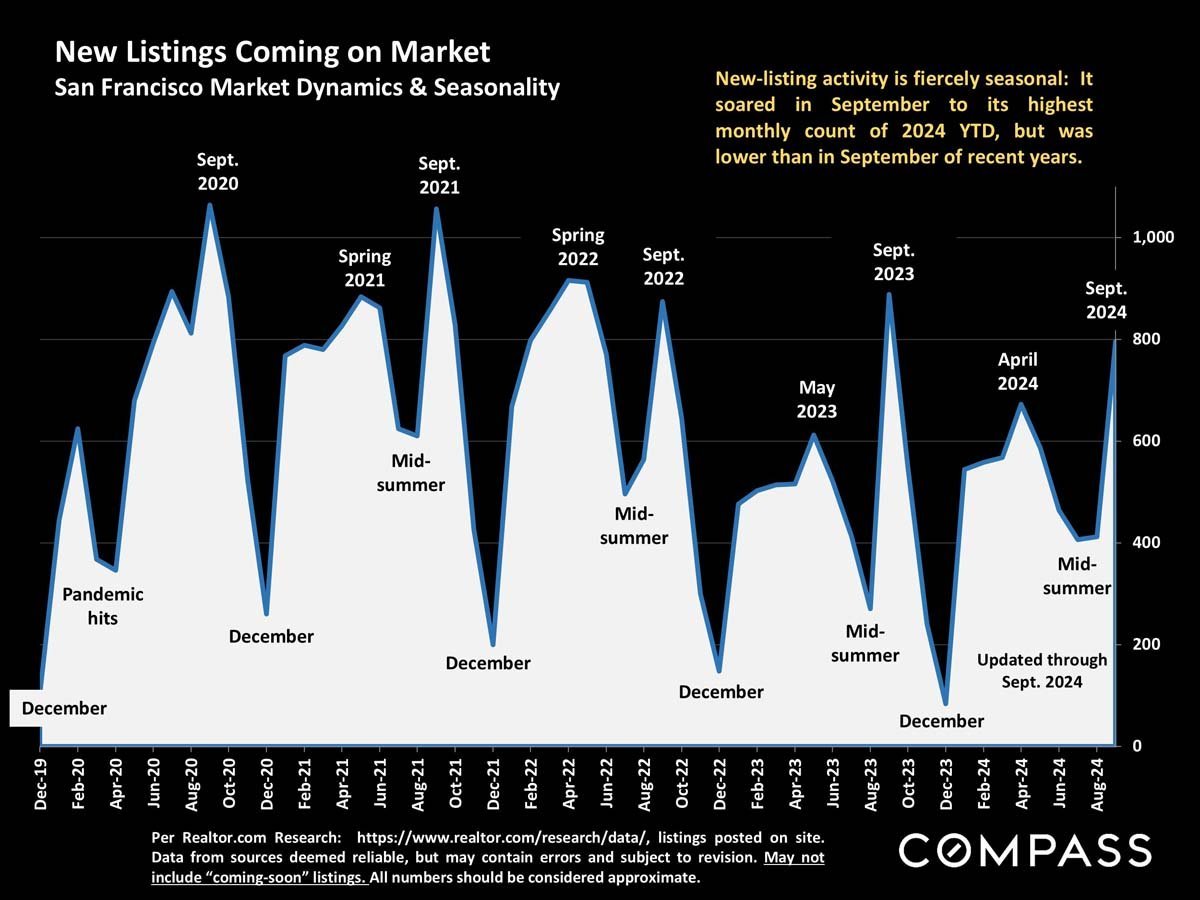
Chart of seasonal San Francisco new-listing activity from December 2019 through September 2024.
 
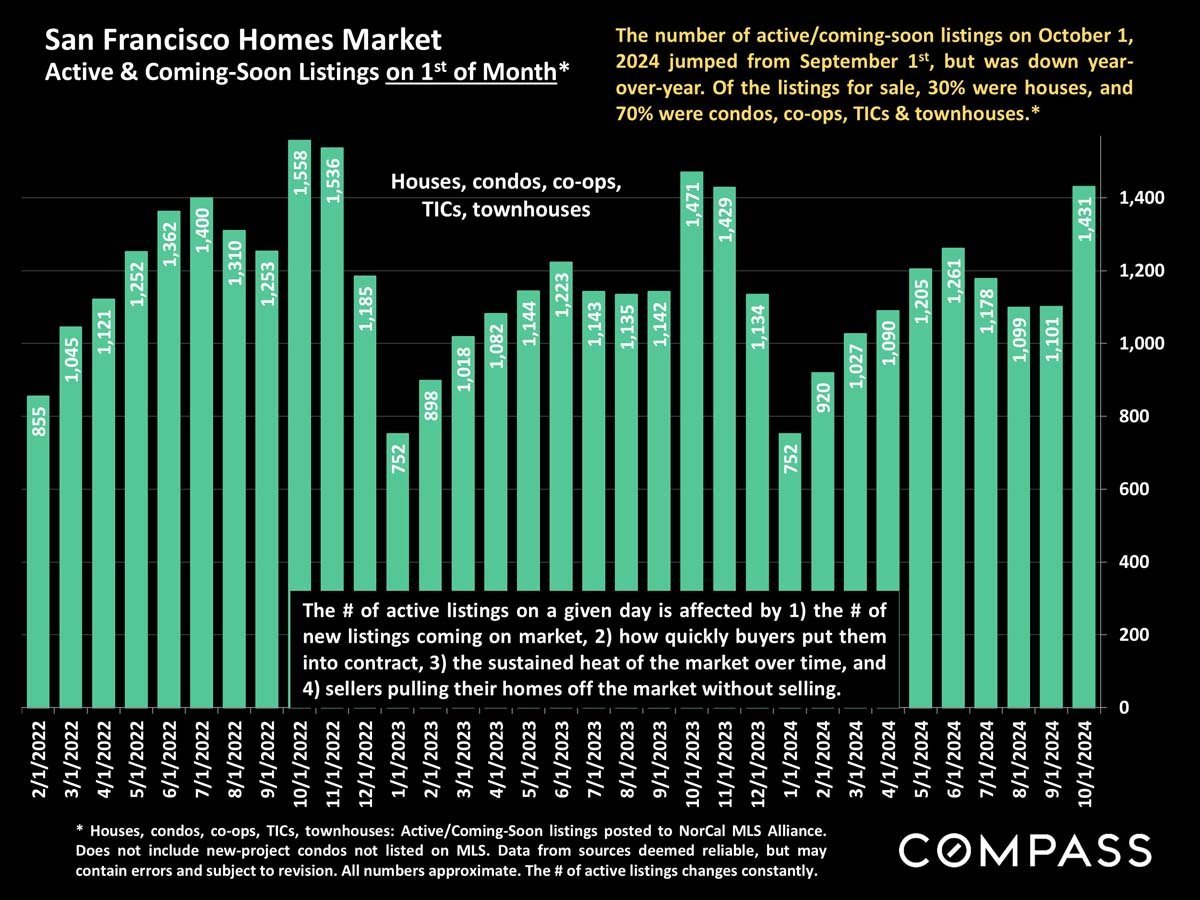
Bar chart of San Francisco active and coming-soon home listings, February 2022 to October 2024.
 
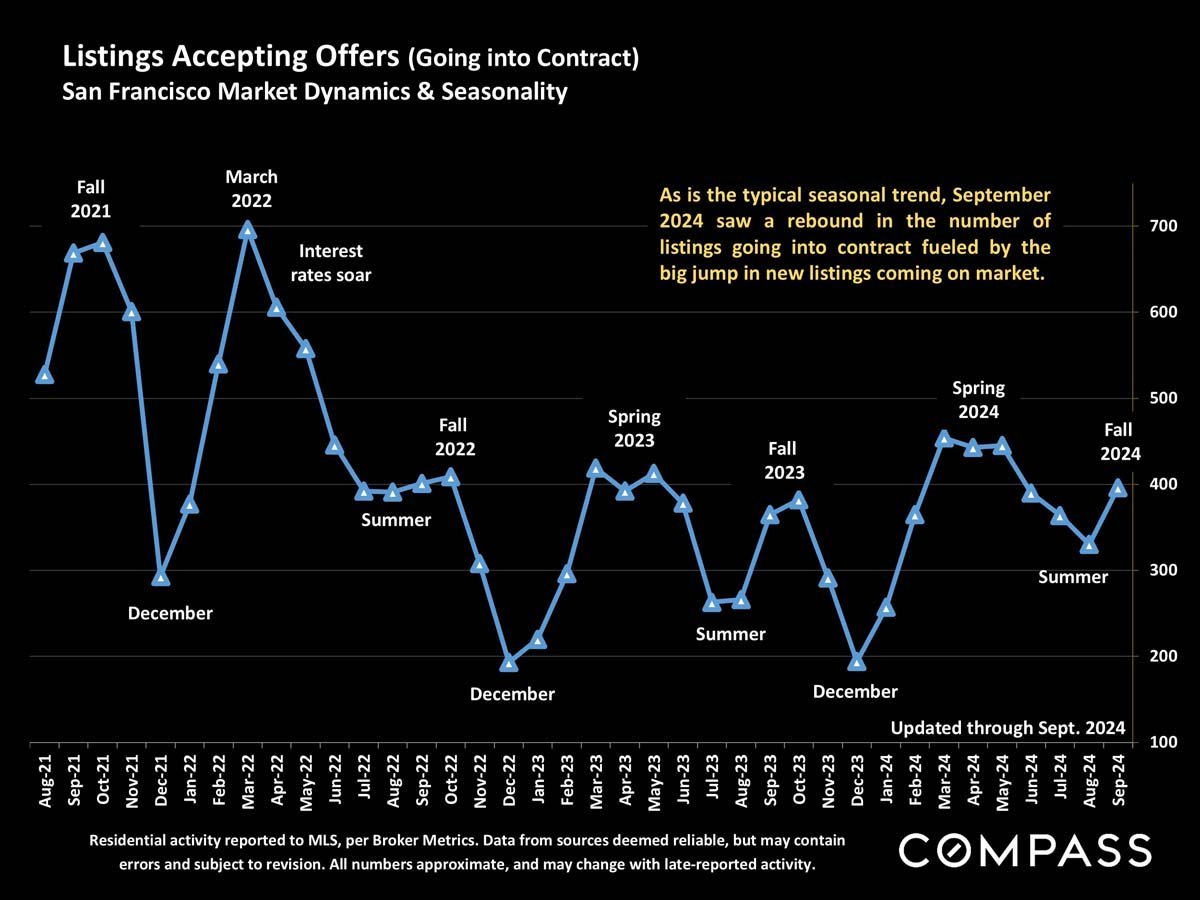
San Francisco listings accepting offers, charted monthly from August 2021 to September 2024.
 
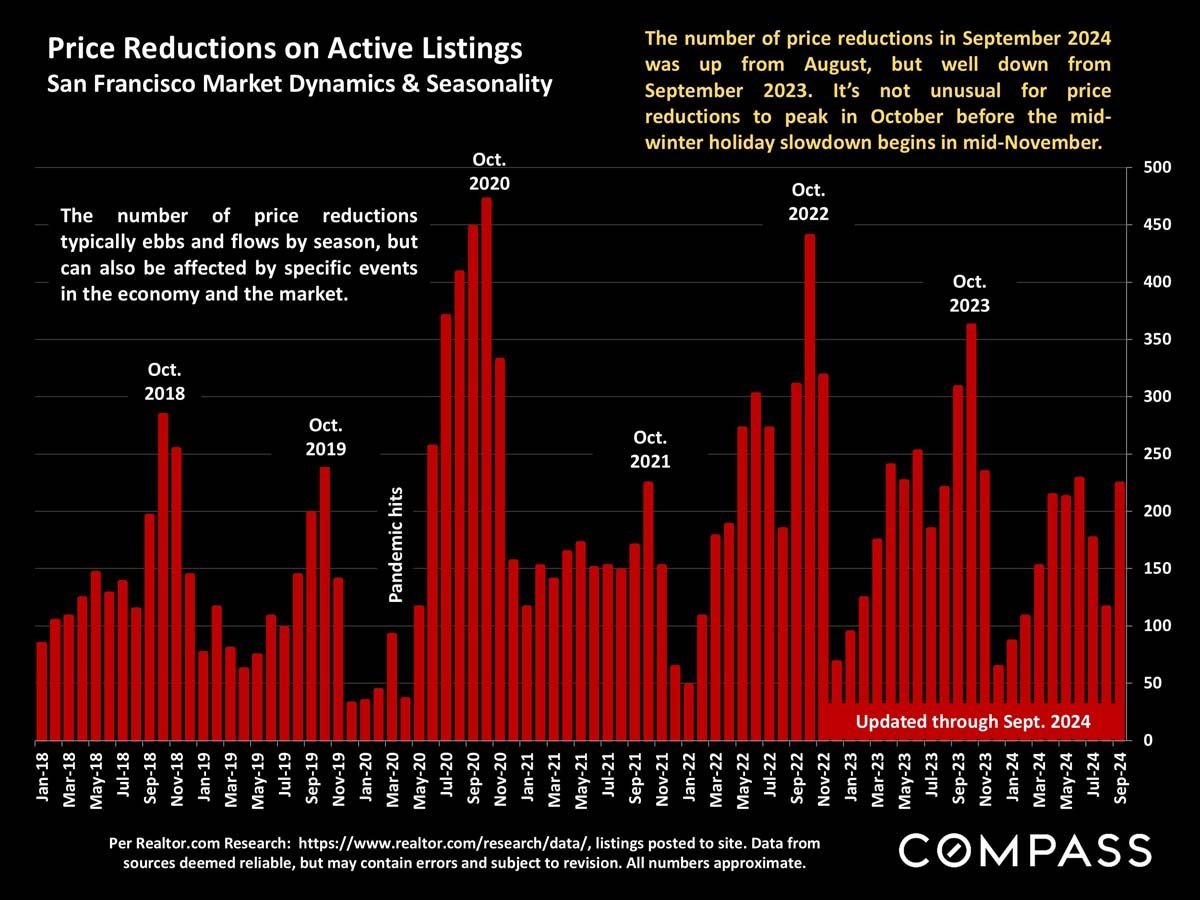
Chart of San Francisco active-listing price reductions from 2018 to September 2024, with recurring October peaks.
 
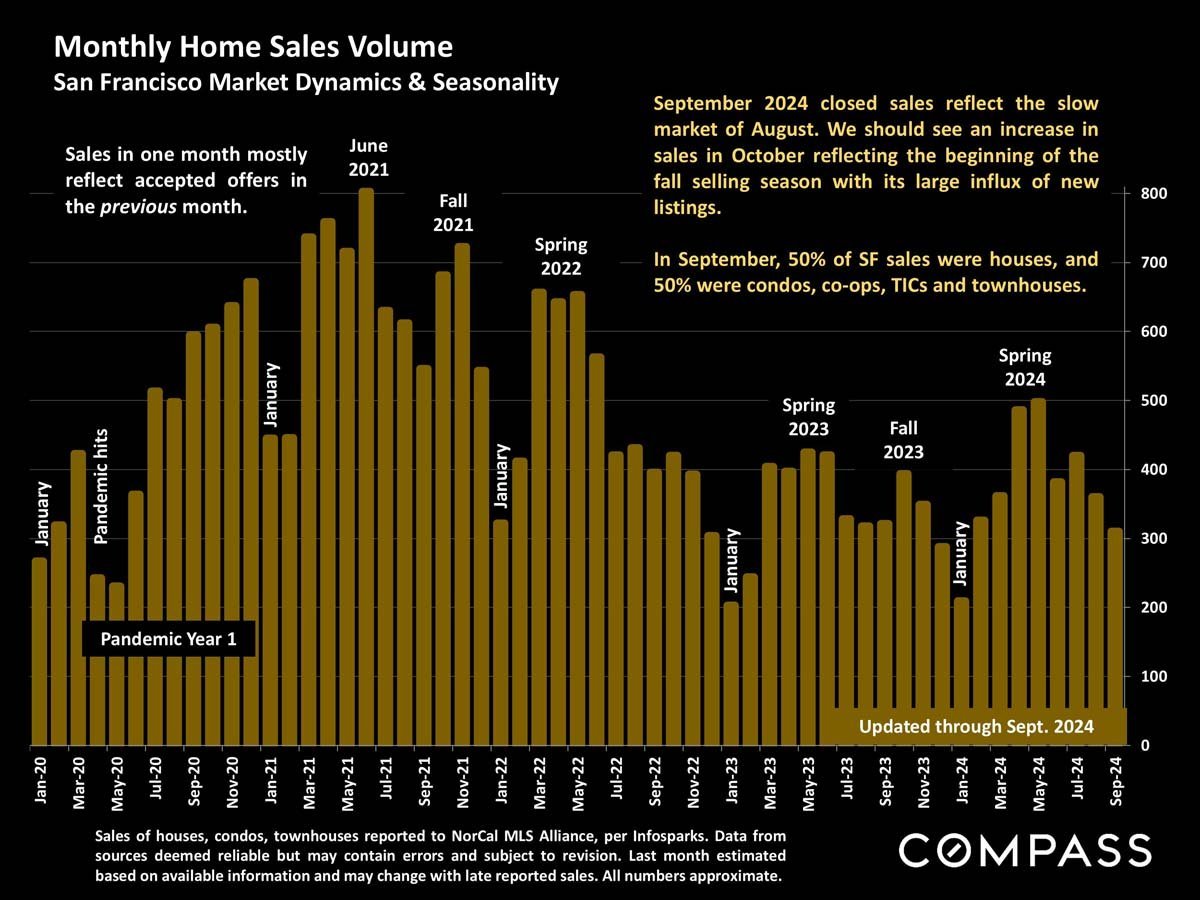
Chart of San Francisco monthly home sales, January 2020–September 2024, with seasonal annotations and September 2024 market notes.
 
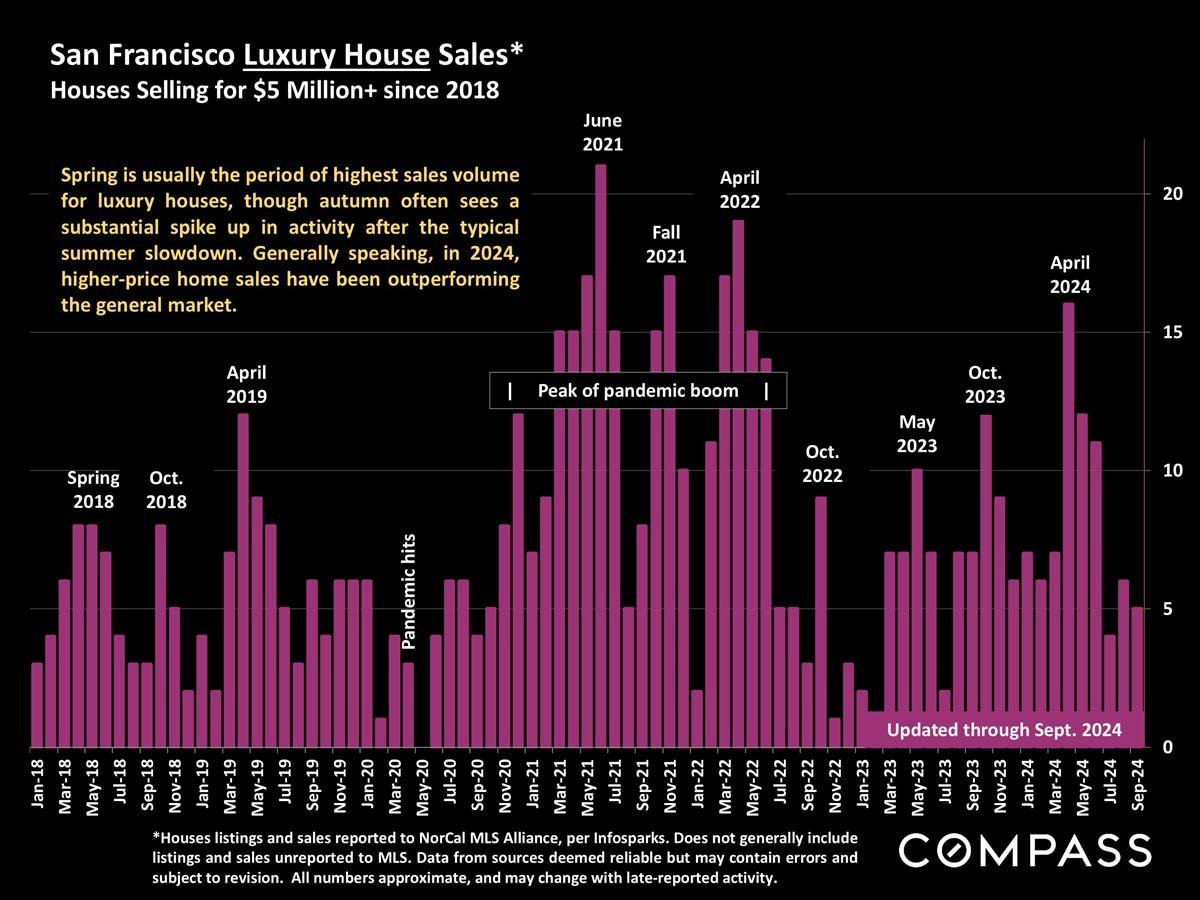
Chart of San Francisco $5 million-plus house sales since 2018, with monthly bars and pandemic-era market annotations.
 
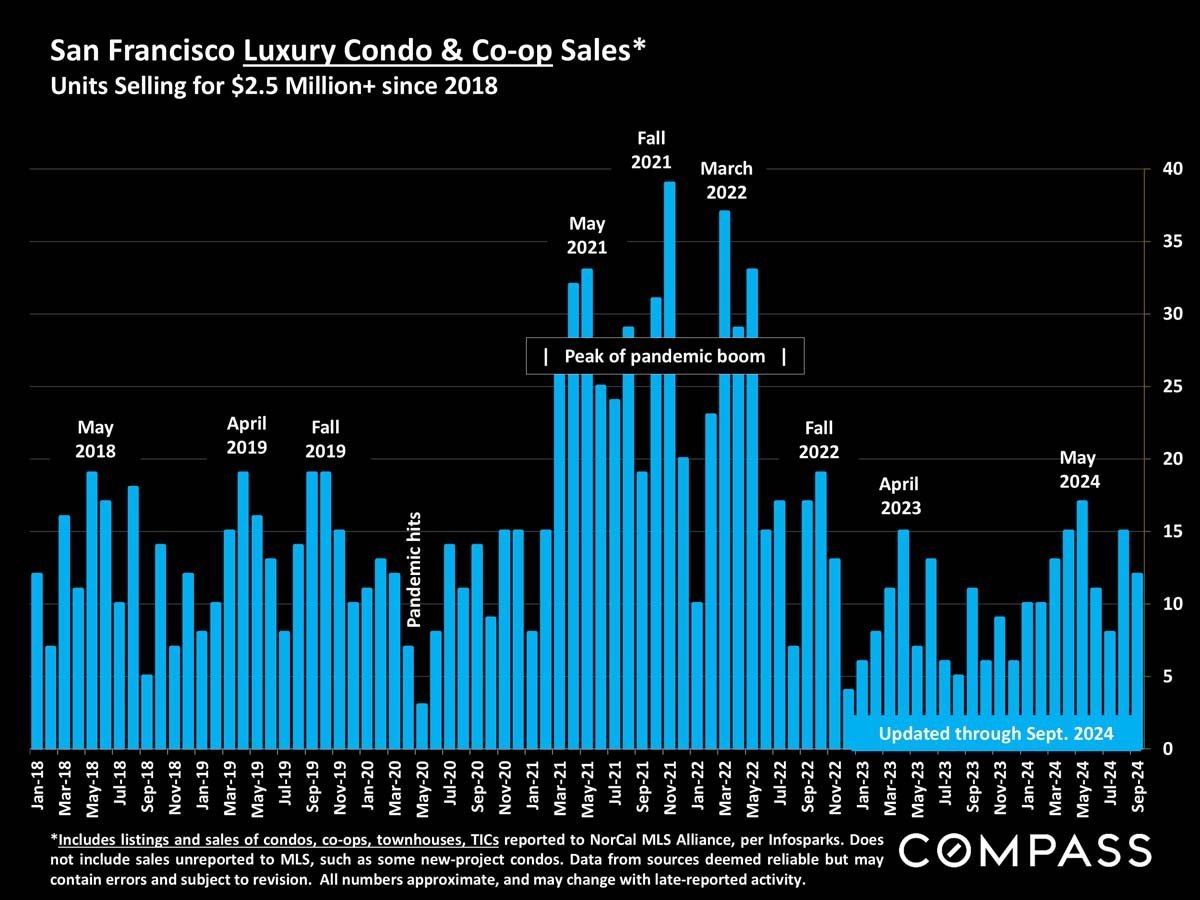
Chart of San Francisco luxury condo and co-op sales over $2.5 million, with monthly totals from 2018 to September 2024.
 
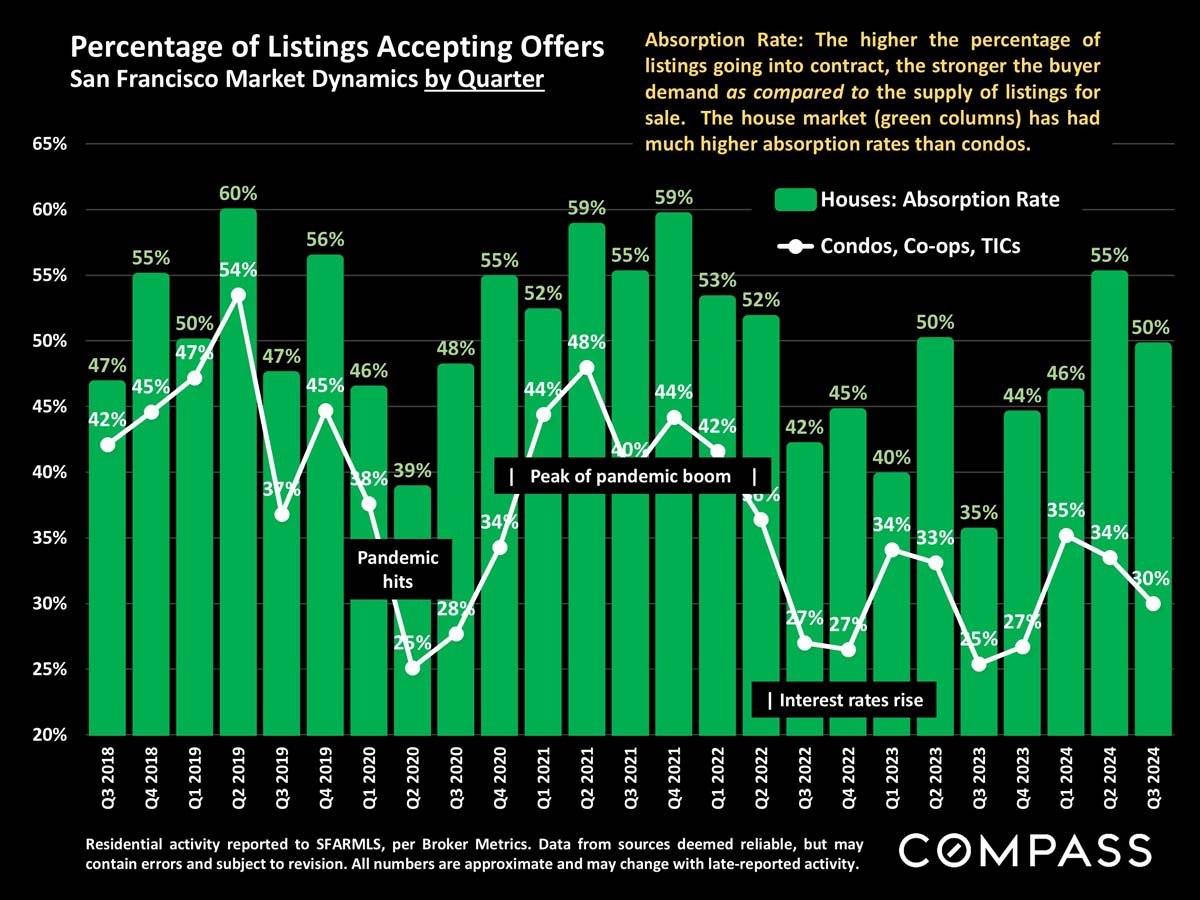
Chart comparing San Francisco quarterly listing absorption rates for houses and condos, co-ops, and TICs, 2018–2024.
 
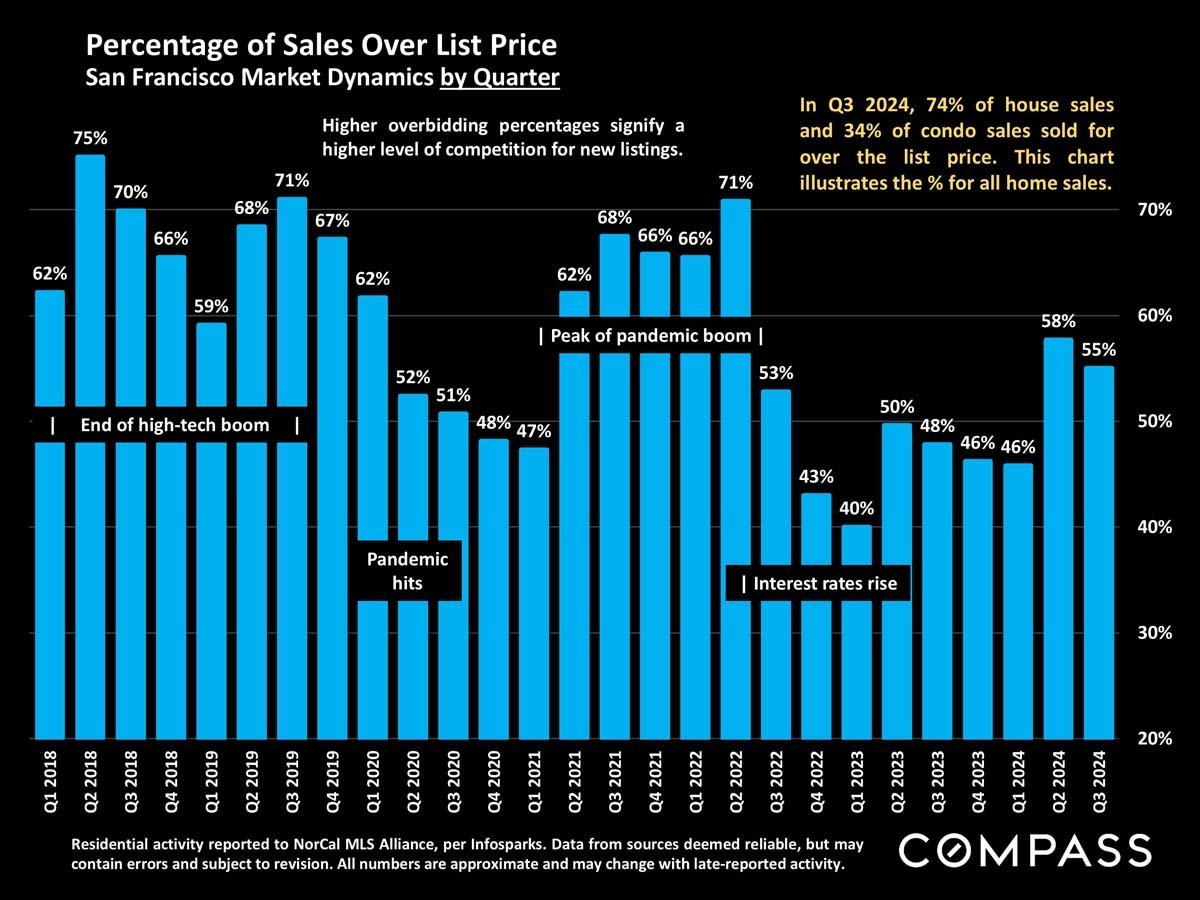
Chart of San Francisco home sales over list price by quarter, 2018–2024, with peaks and market-period annotations.
 
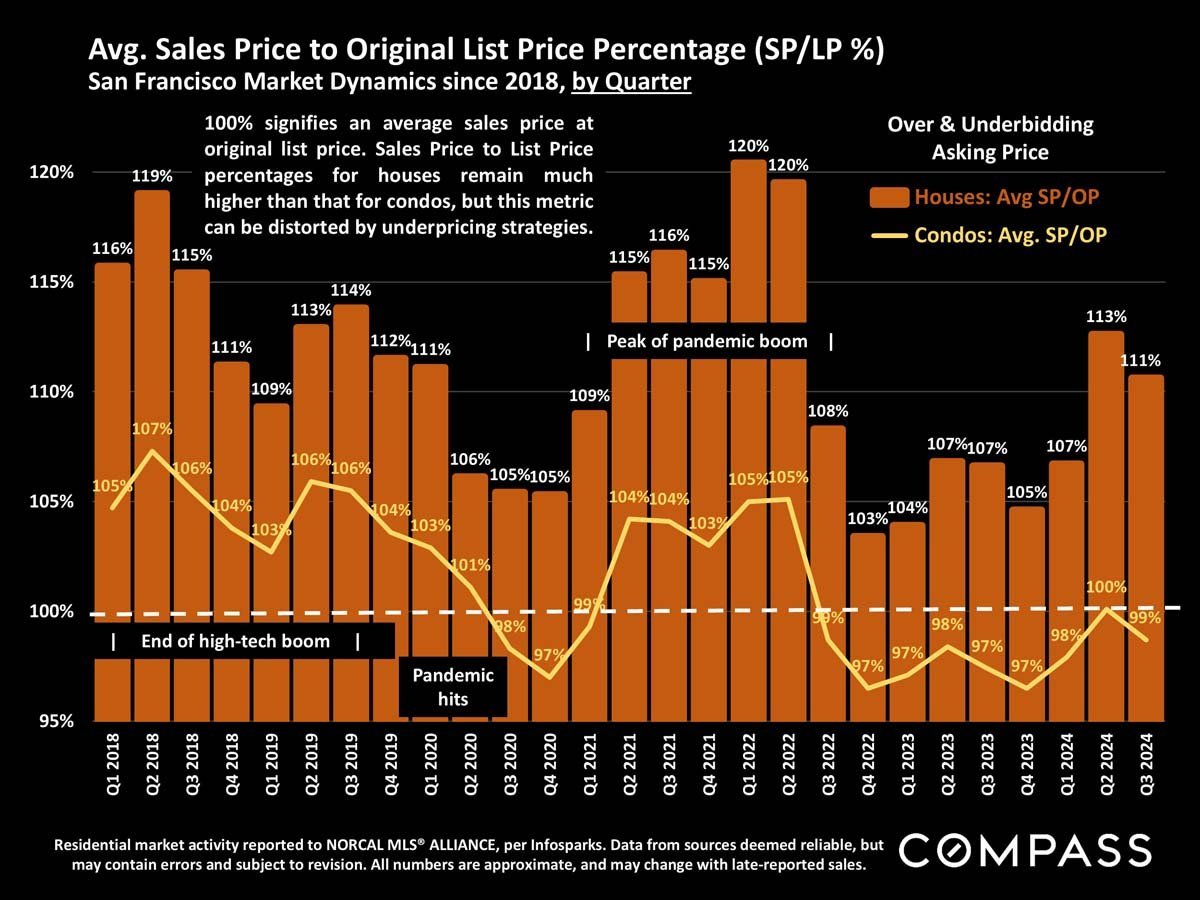
Chart comparing San Francisco house and condo sale prices to original list prices by quarter, 2018–2024.
 
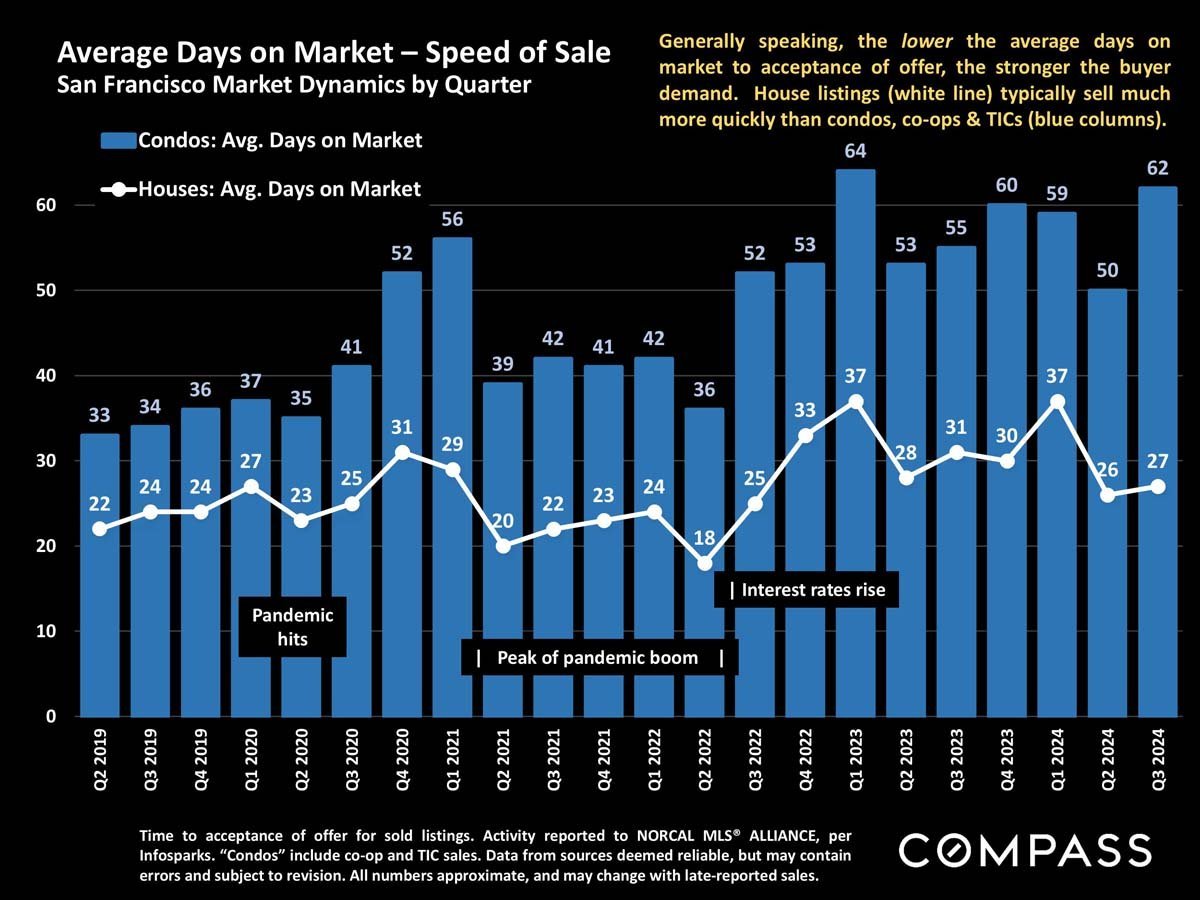
San Francisco quarterly days-on-market chart, comparing condos and houses from 2019 to 2024.
 
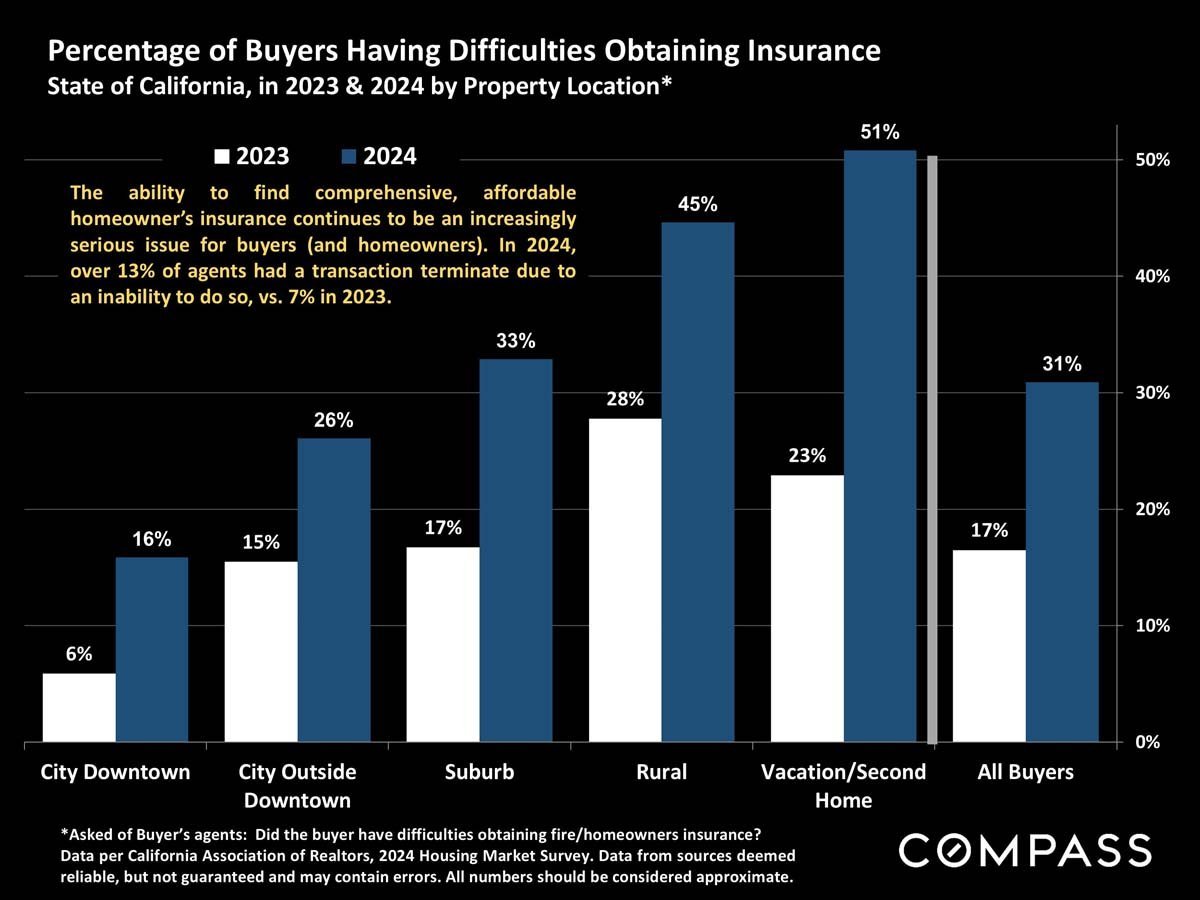
Chart shows California buyers’ insurance difficulties rising from 2023 to 2024 across all property locations, highest for vacation homes.
 
Market-statistics definitions, limitations, photo-use notice, and Compass legal disclaimer.

Work With Jane

Get assistance in determining the current property value, crafting a competitive offer, writing and negotiating a contract, and much more. Contact me today.
Follow Me on Instagram