San Francisco Real Estate April 2024 report cover featuring a flower garden.

San Francisco Home Prices, Market Conditions & Trends April 2024

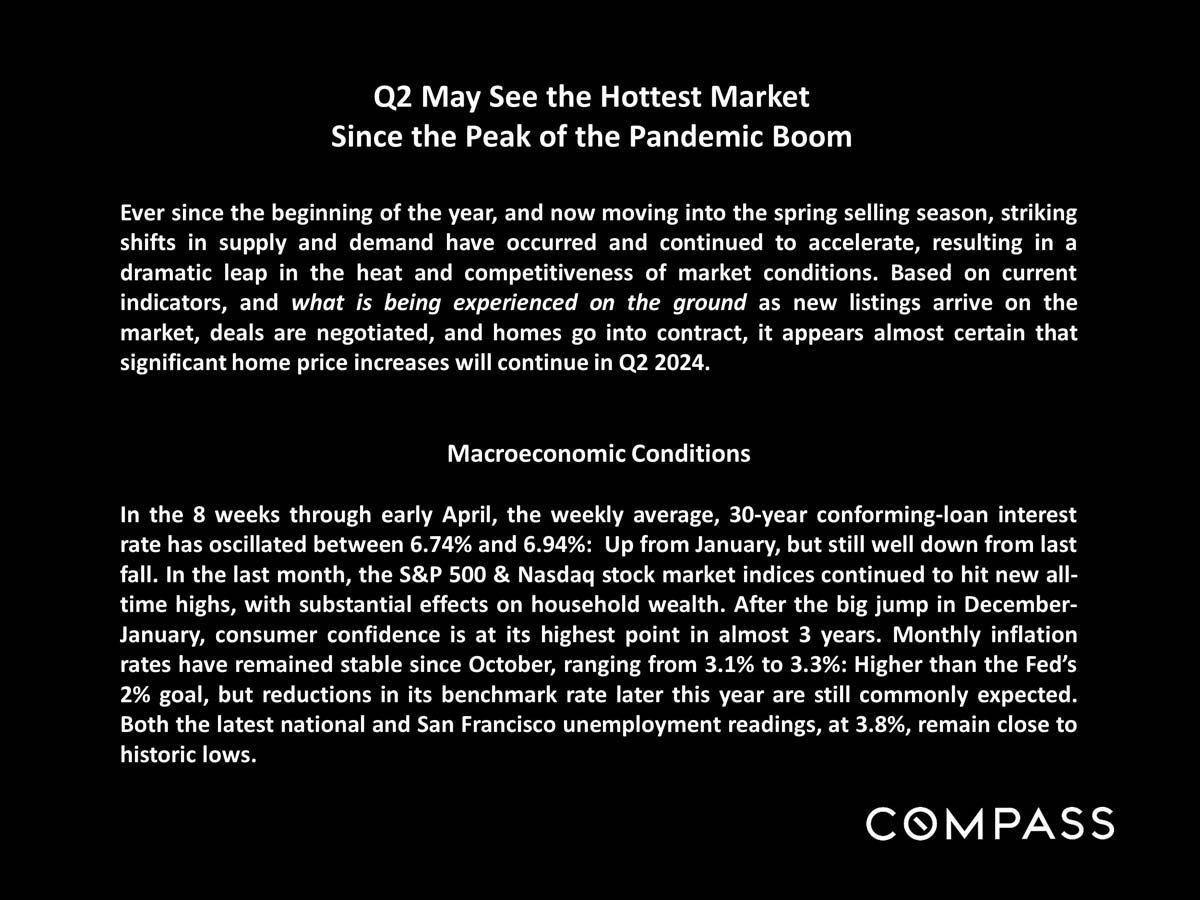
Based on current indicators, and what is being experienced on the ground as new listings arrive on the market, deals are negotiated, and homes go into contract, it appears almost certain that significant home price increases will continue in Q2 2024.
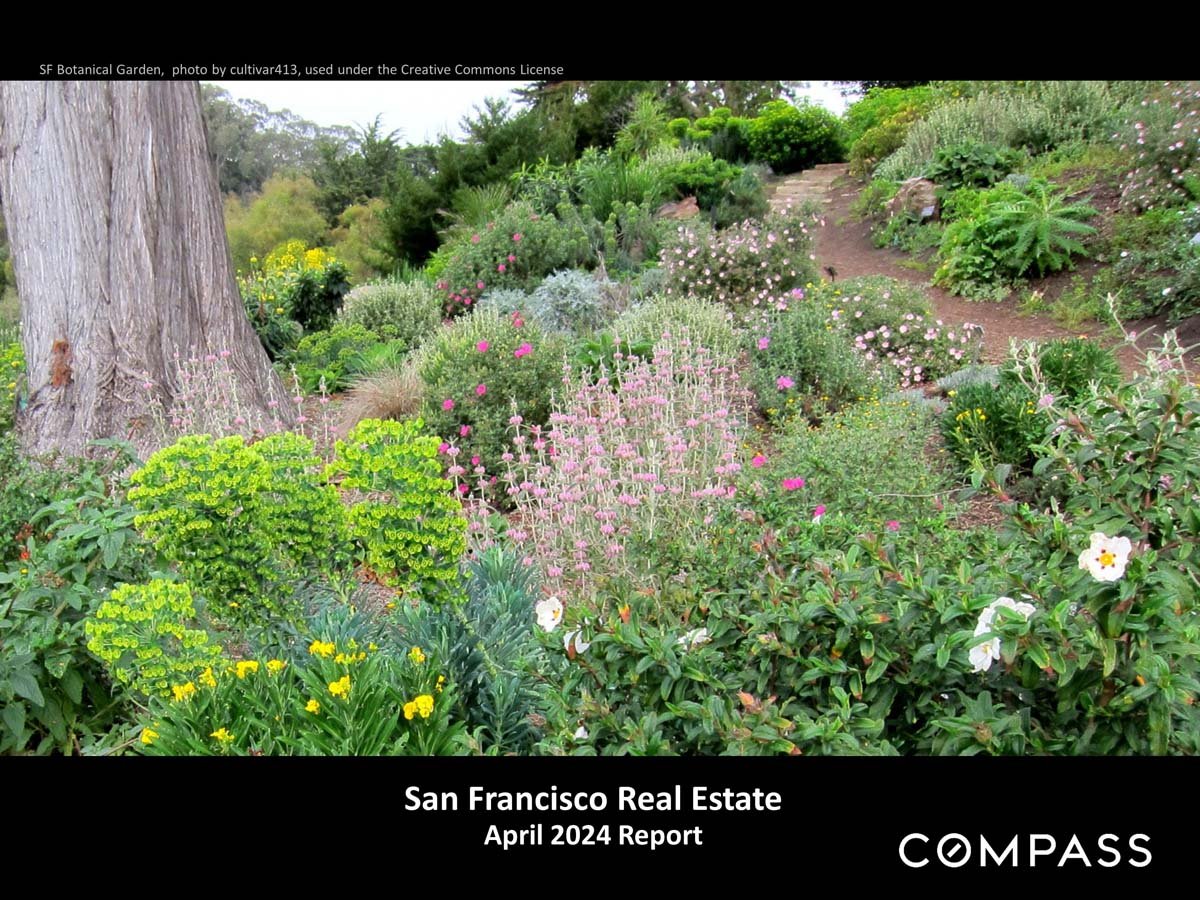
 
San Francisco Real Estate April 2024 report cover featuring a flower garden.
 
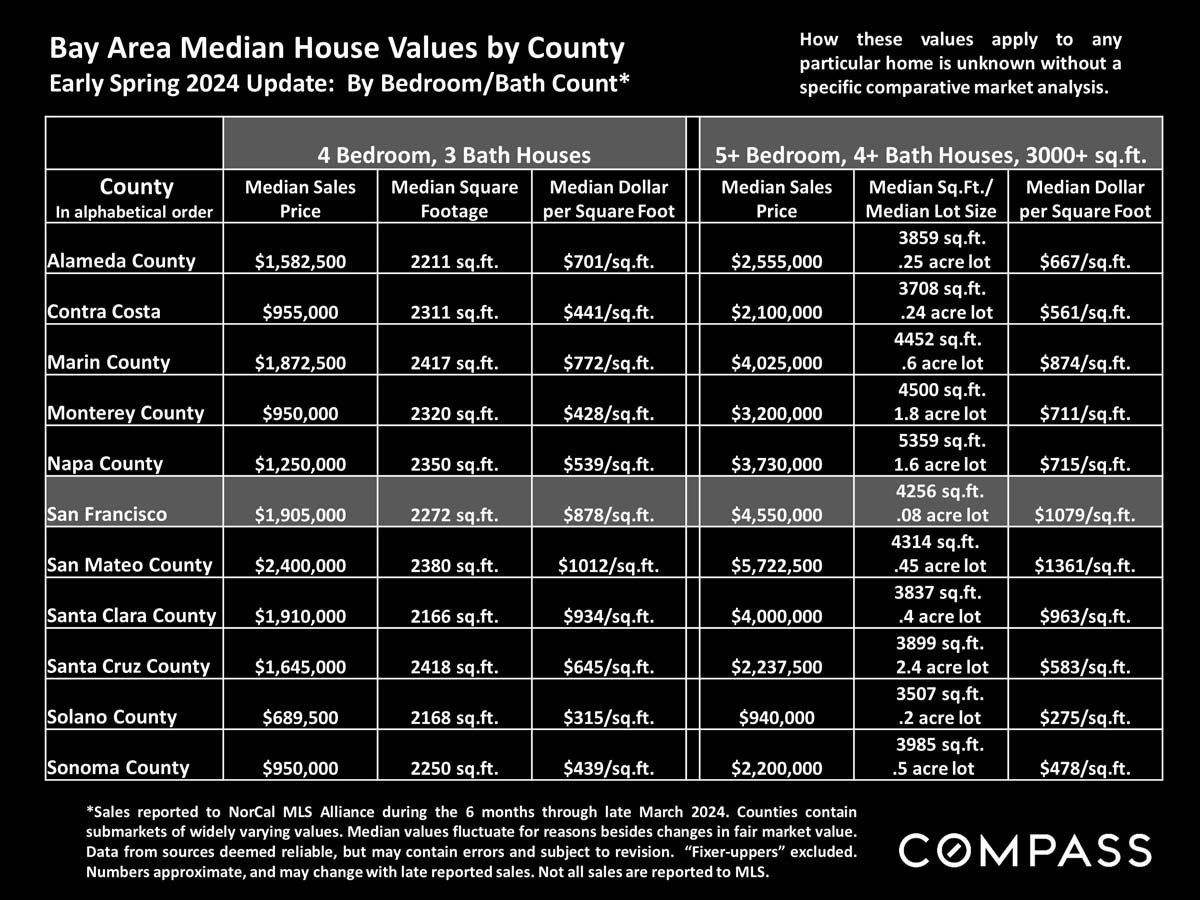
2024 Bay Area county home-value table comparing prices, sizes, and price per square foot.
 
San Francisco market update forecasting Q2 2024 home price increases, with a summary of macroeconomic conditions.
 
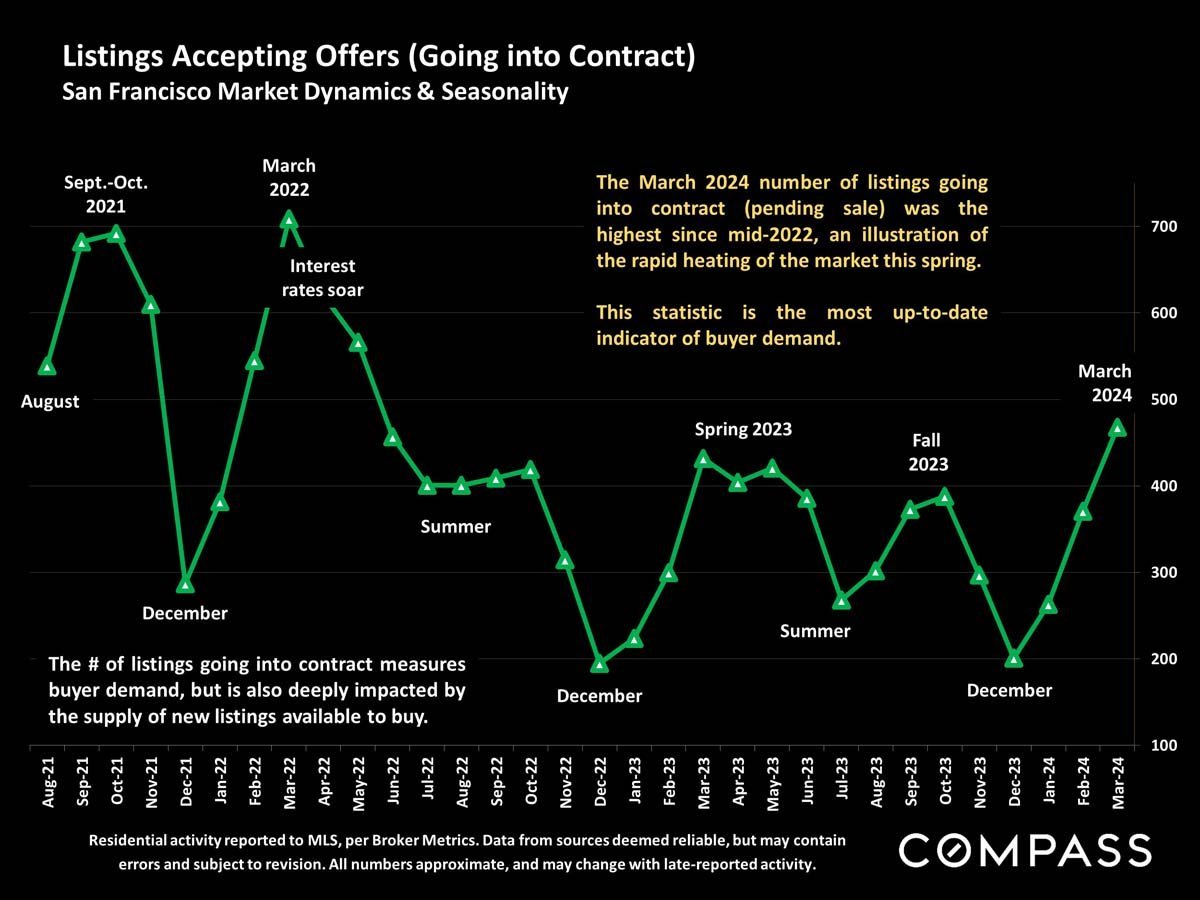
Chart of San Francisco listings going into contract, showing a sharp rise to the highest level since mid-2022 in March 2024.
 
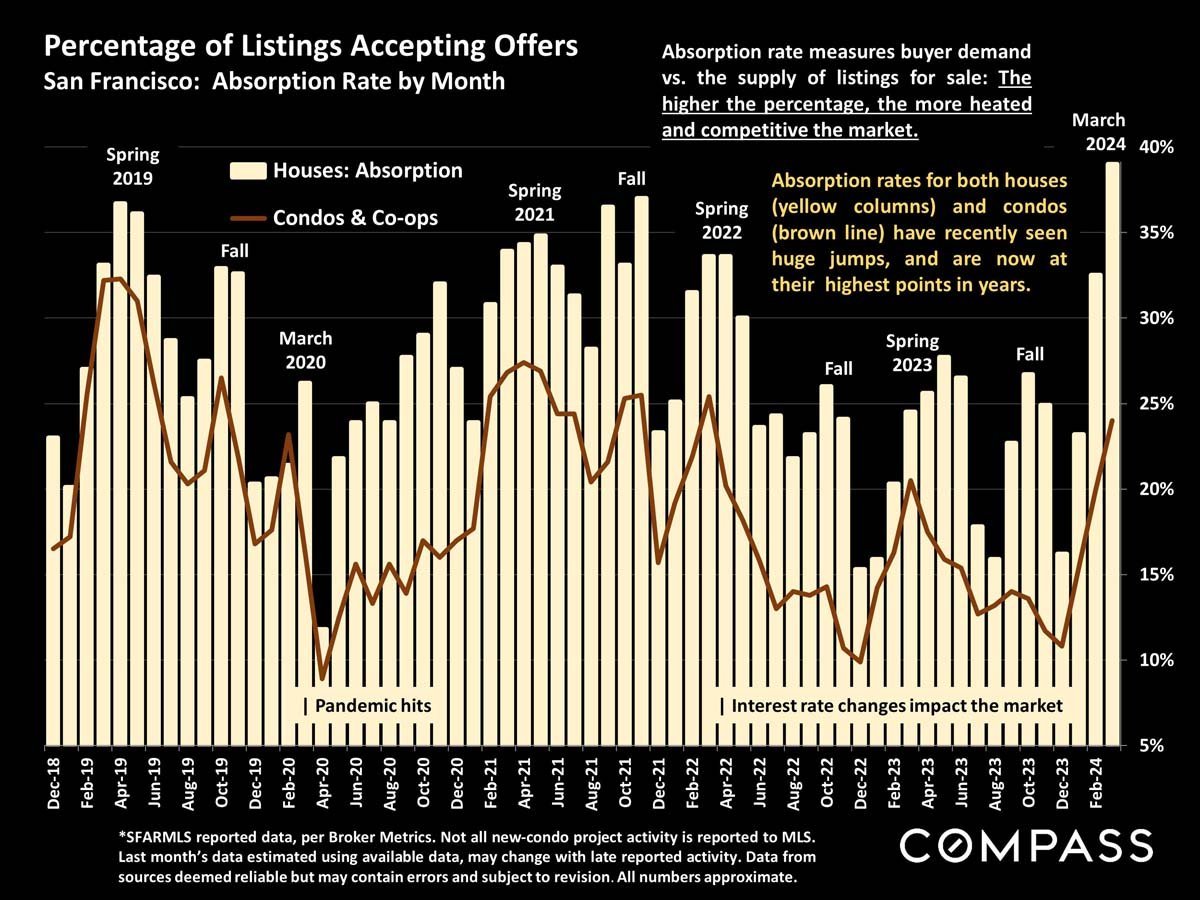
Chart comparing monthly San Francisco house and condo absorption rates from December 2018 through March 2024.
 
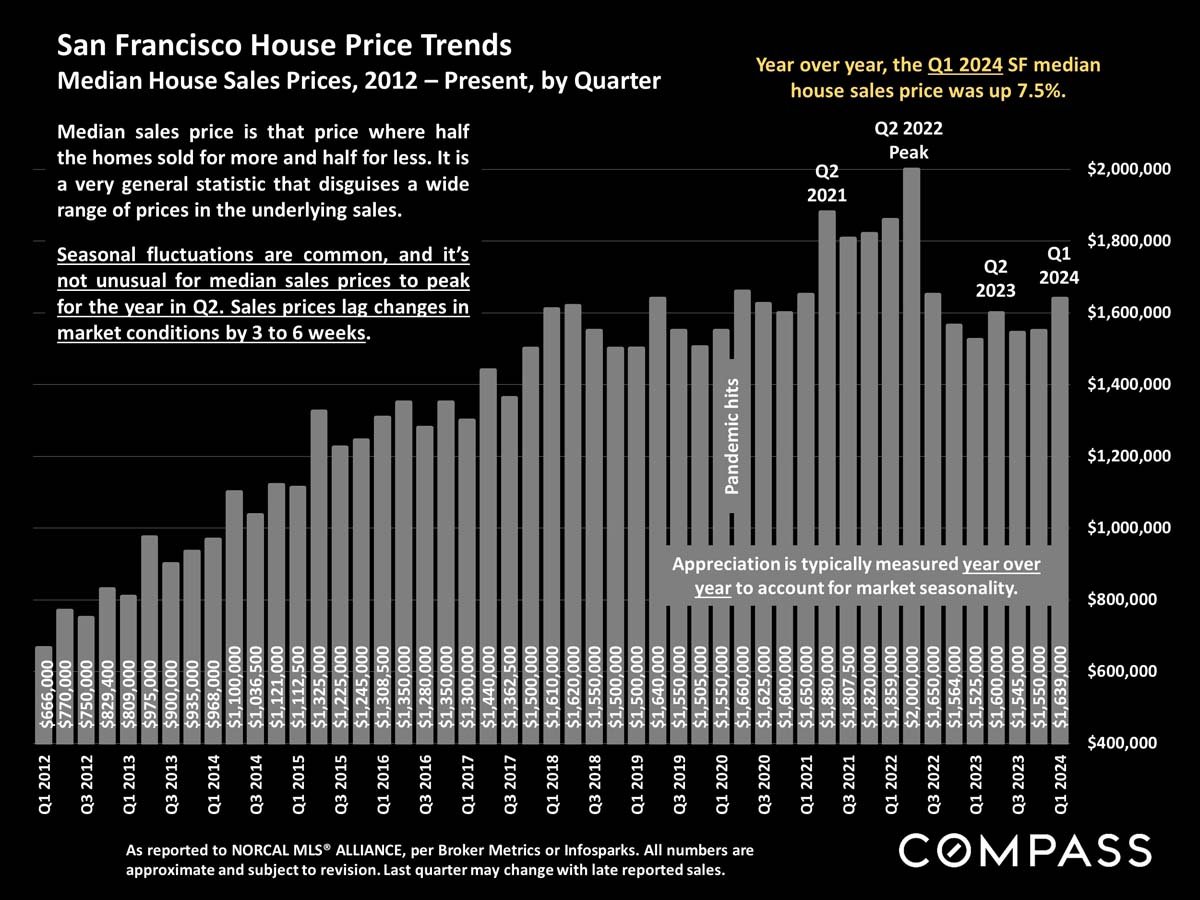
Bar chart of San Francisco median house prices by quarter from 2012 through Q1 2024.
 
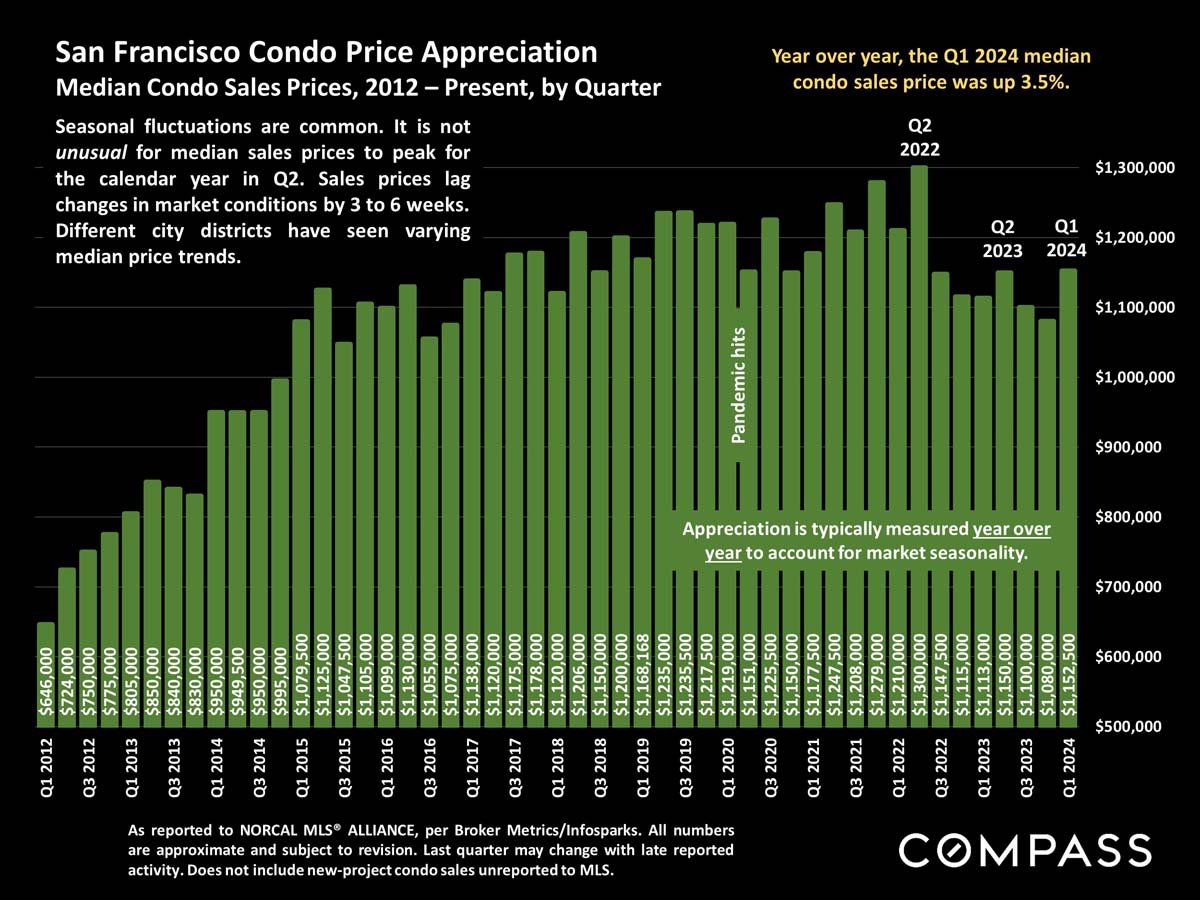
Chart of San Francisco condo prices by quarter, 2012–2024, showing a Q1 2024 median of $1,152,500.
 
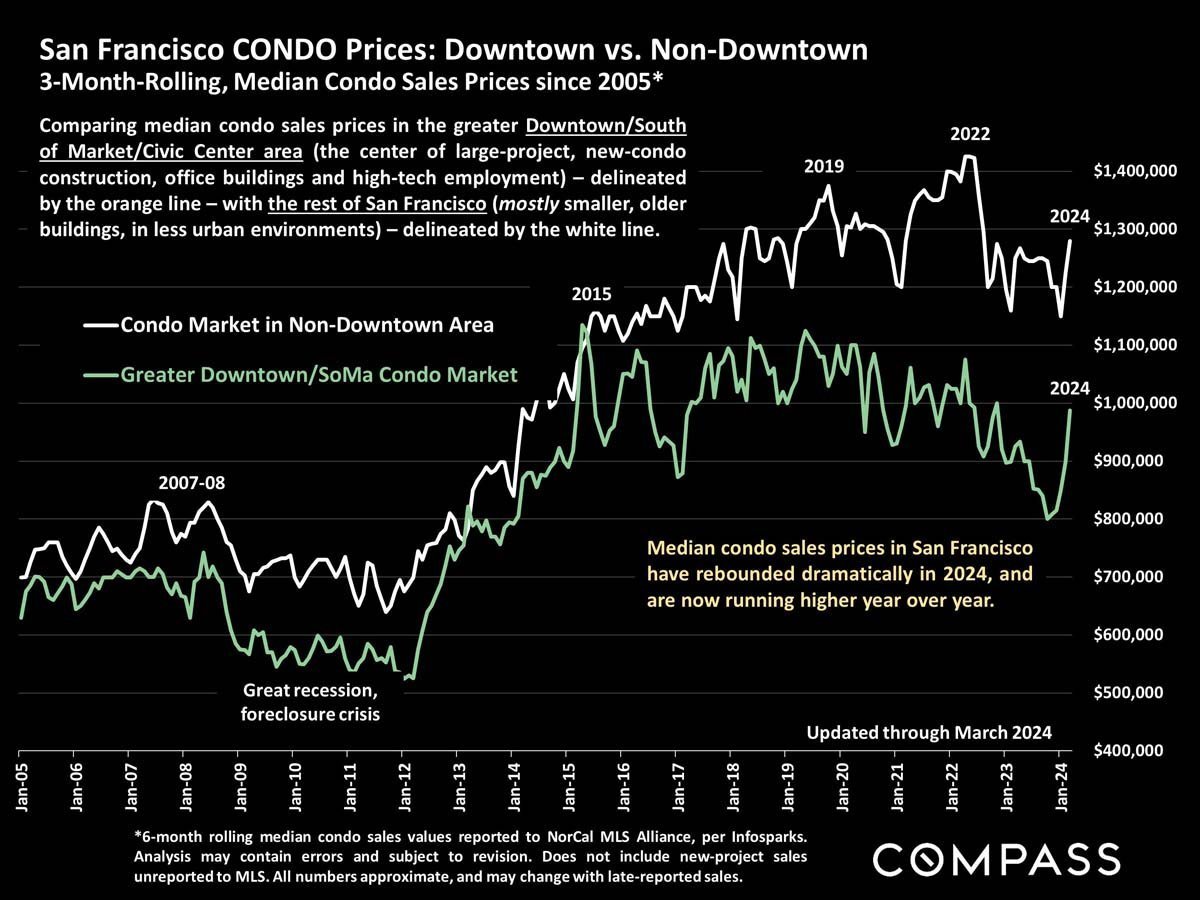
Chart comparing San Francisco downtown and non-downtown median condo prices from 2005 to 2024.
 
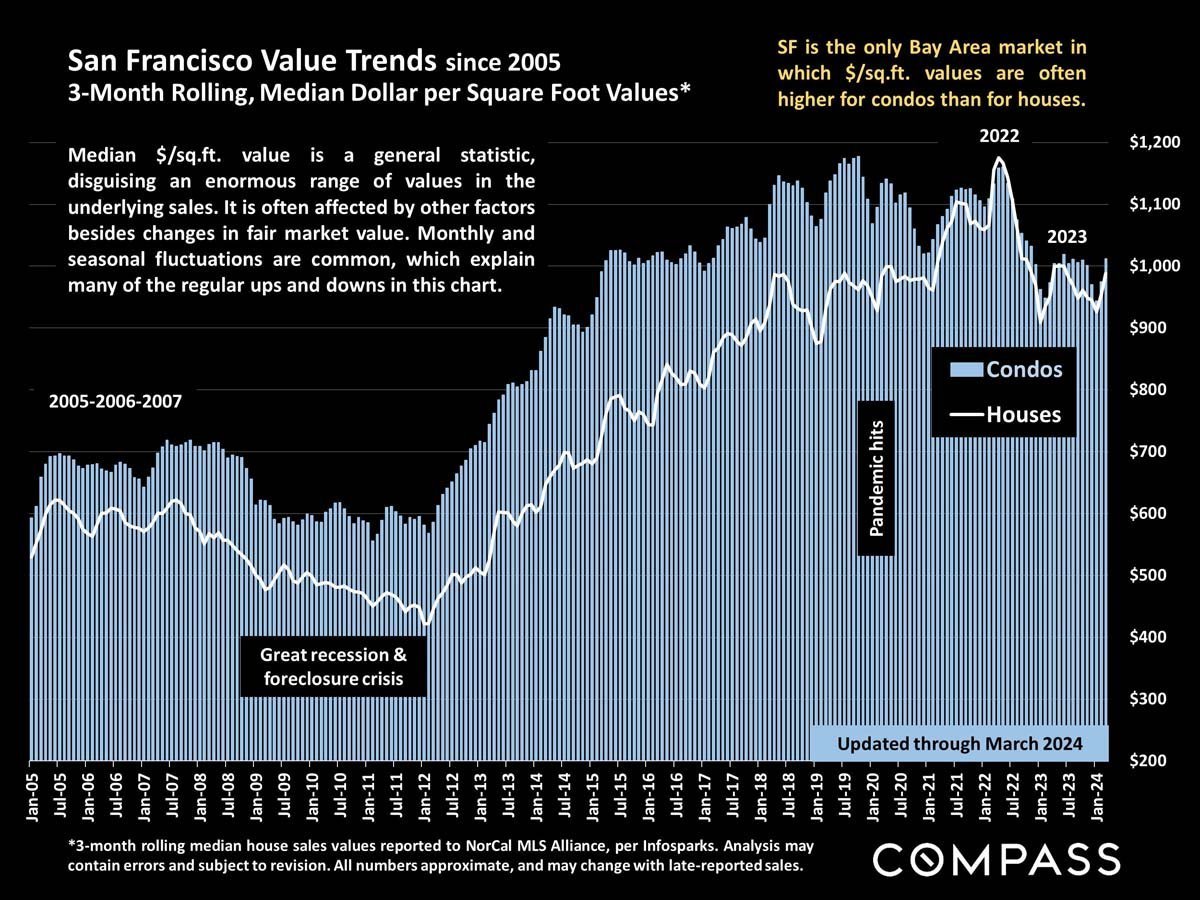
San Francisco condo and house price-per-square-foot trends, 2005–March 2024.
 
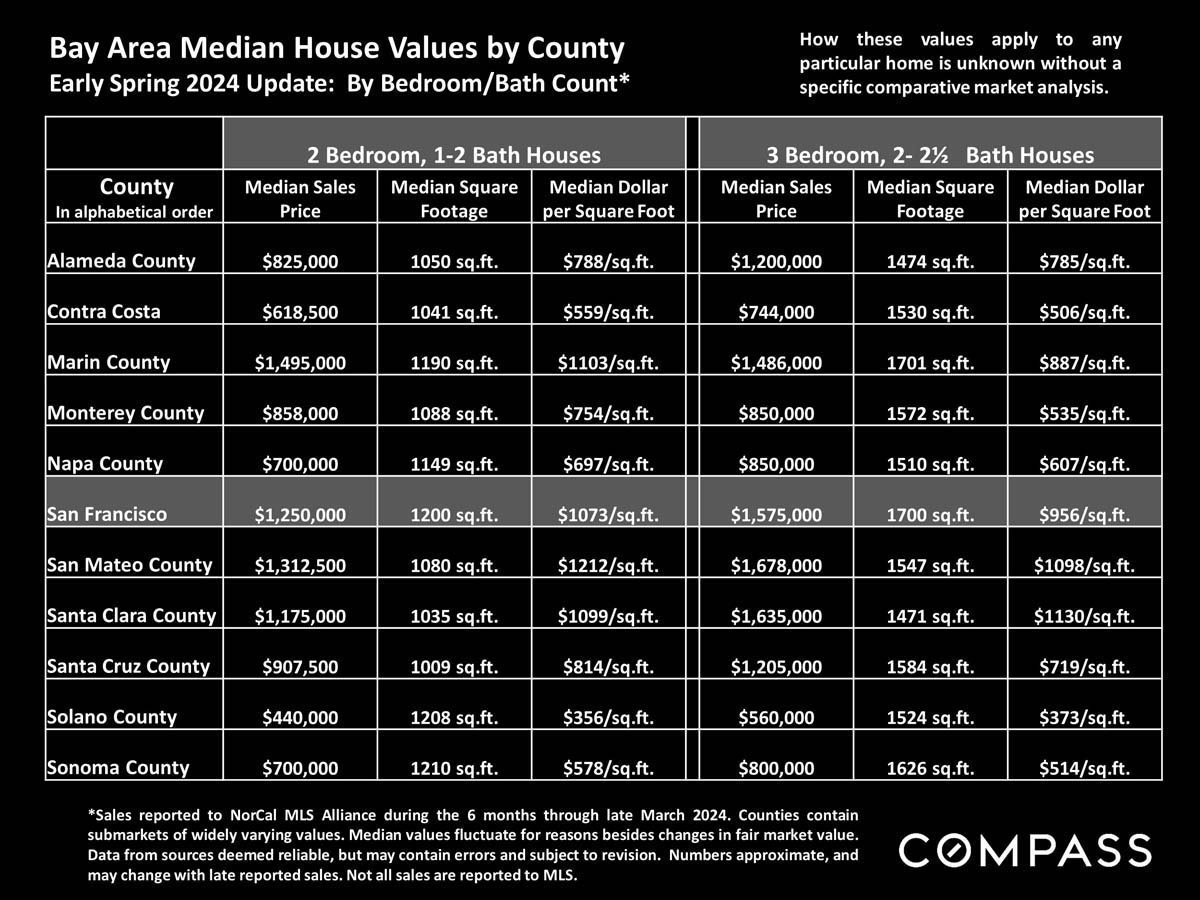
Bay Area county home-value table for early spring 2024, comparing prices, square footage, and price per square foot by bedroom count.
 
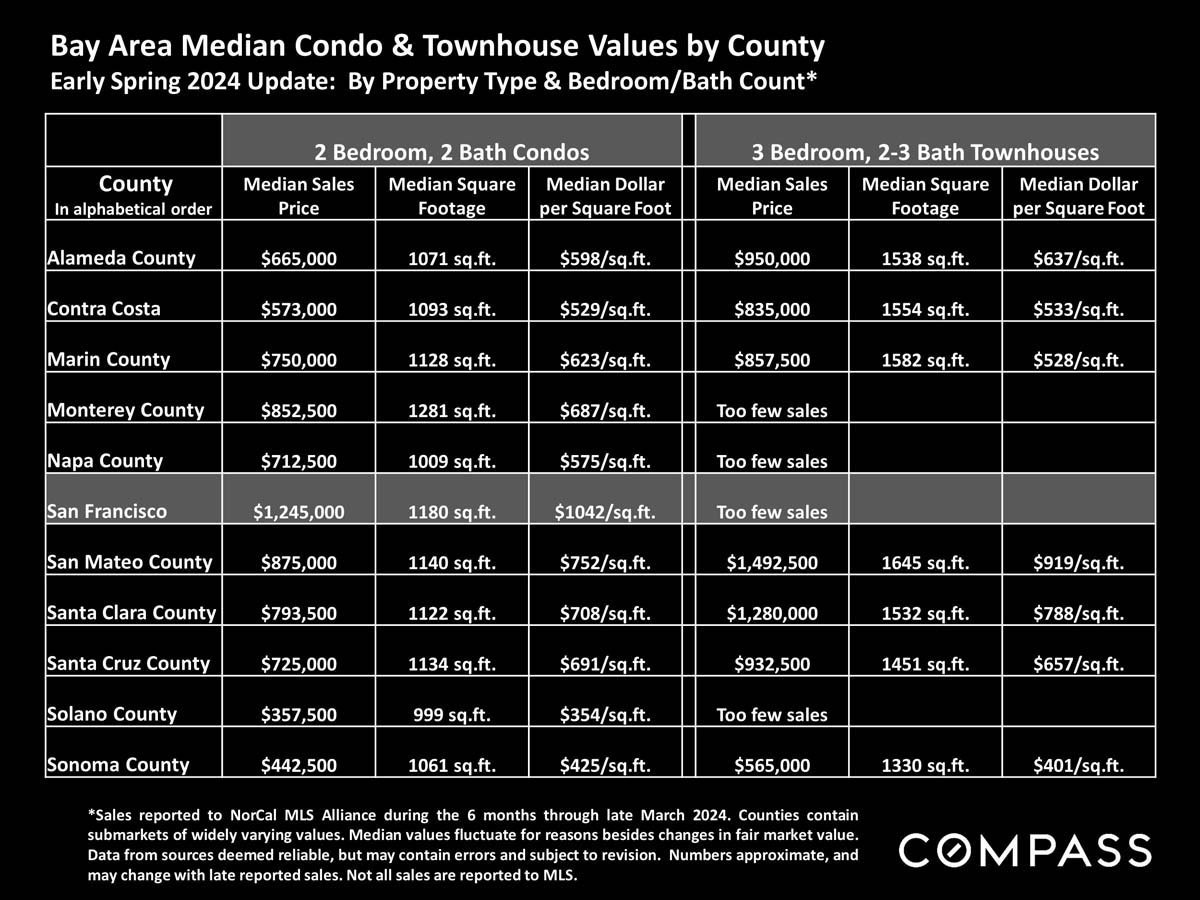
Bay Area county table comparing median condo and townhouse prices, square footage, and price per square foot in early spring 2024.
 
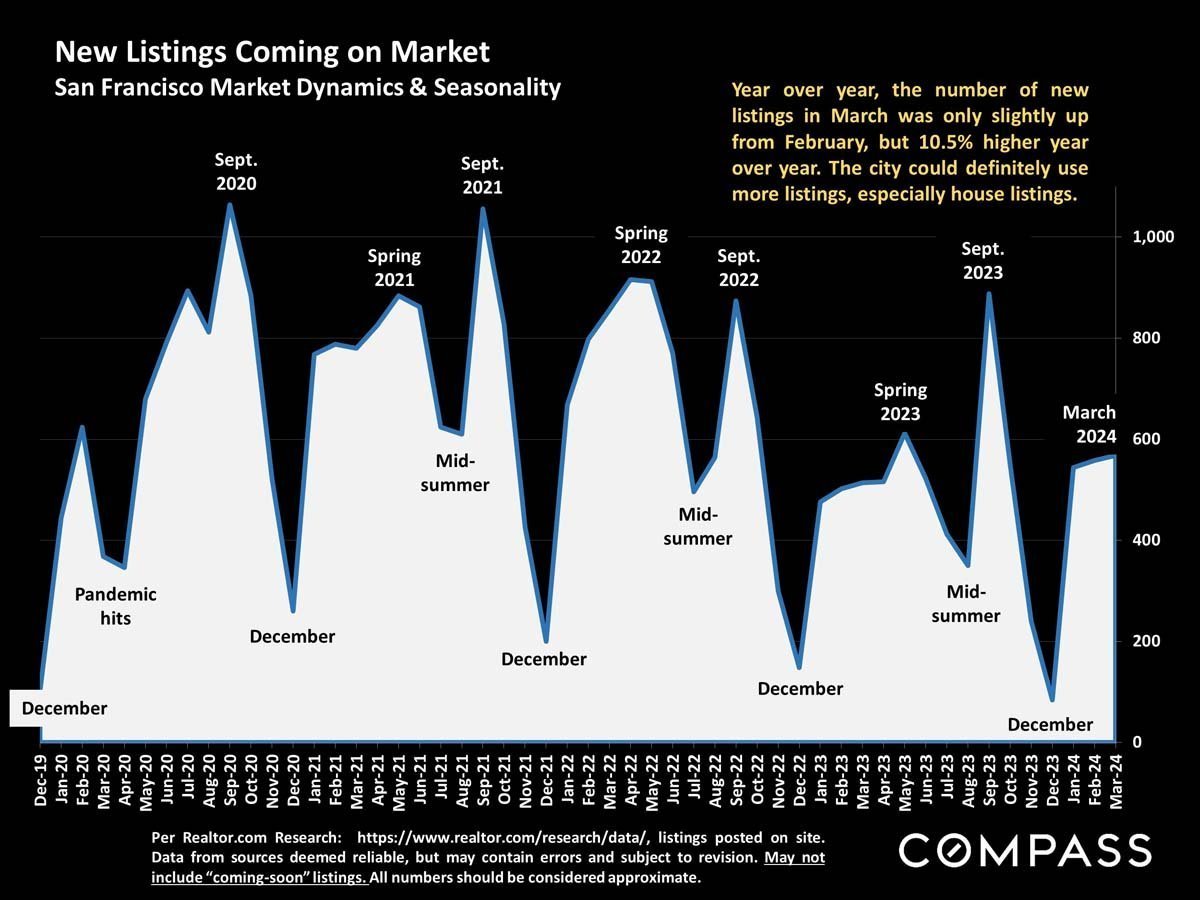
San Francisco monthly new listings chart, showing seasonal peaks and a March 2024 year-over-year increase of 10.5%.
 
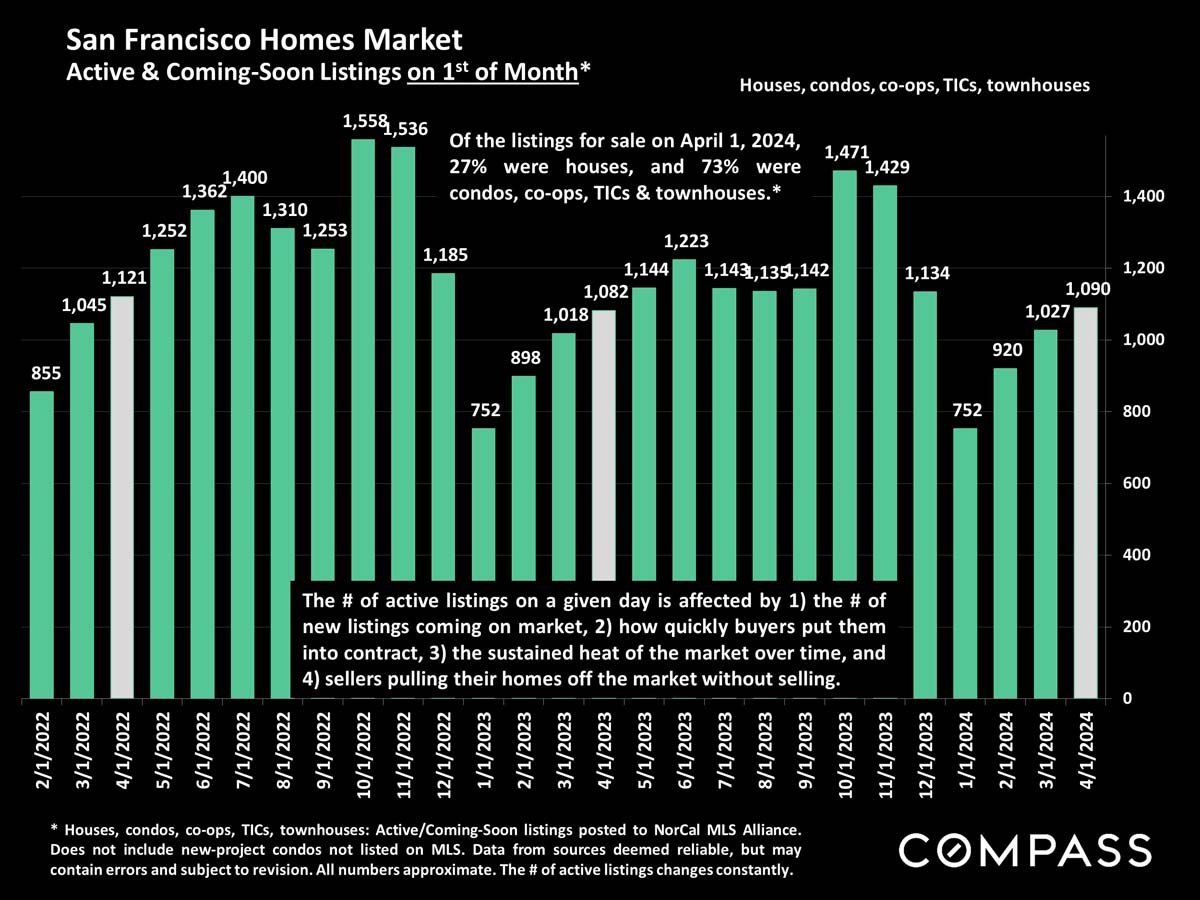
Bar chart of San Francisco active and coming-soon listings from February 2022 through April 2024.
 
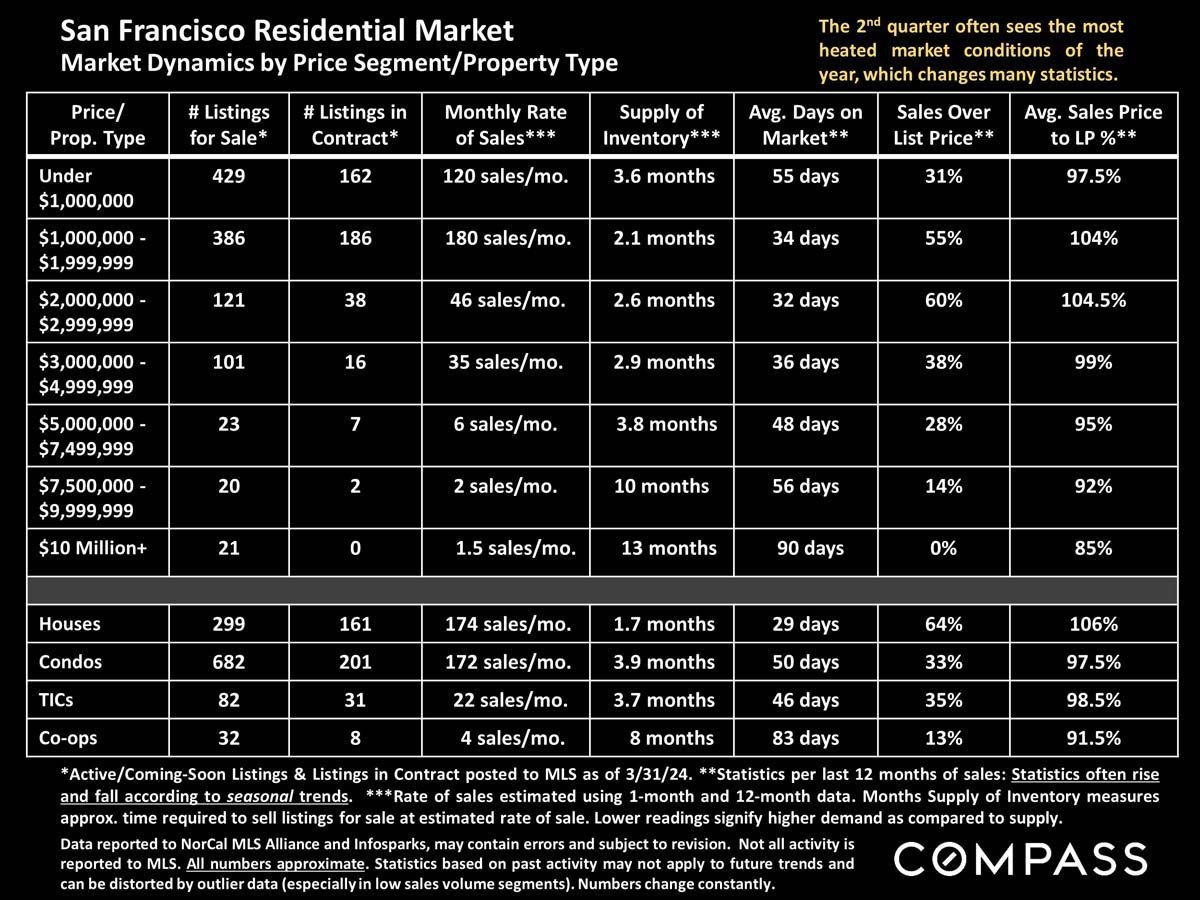
San Francisco residential market infographic comparing prices, listings, sales, inventory, and property types.
 
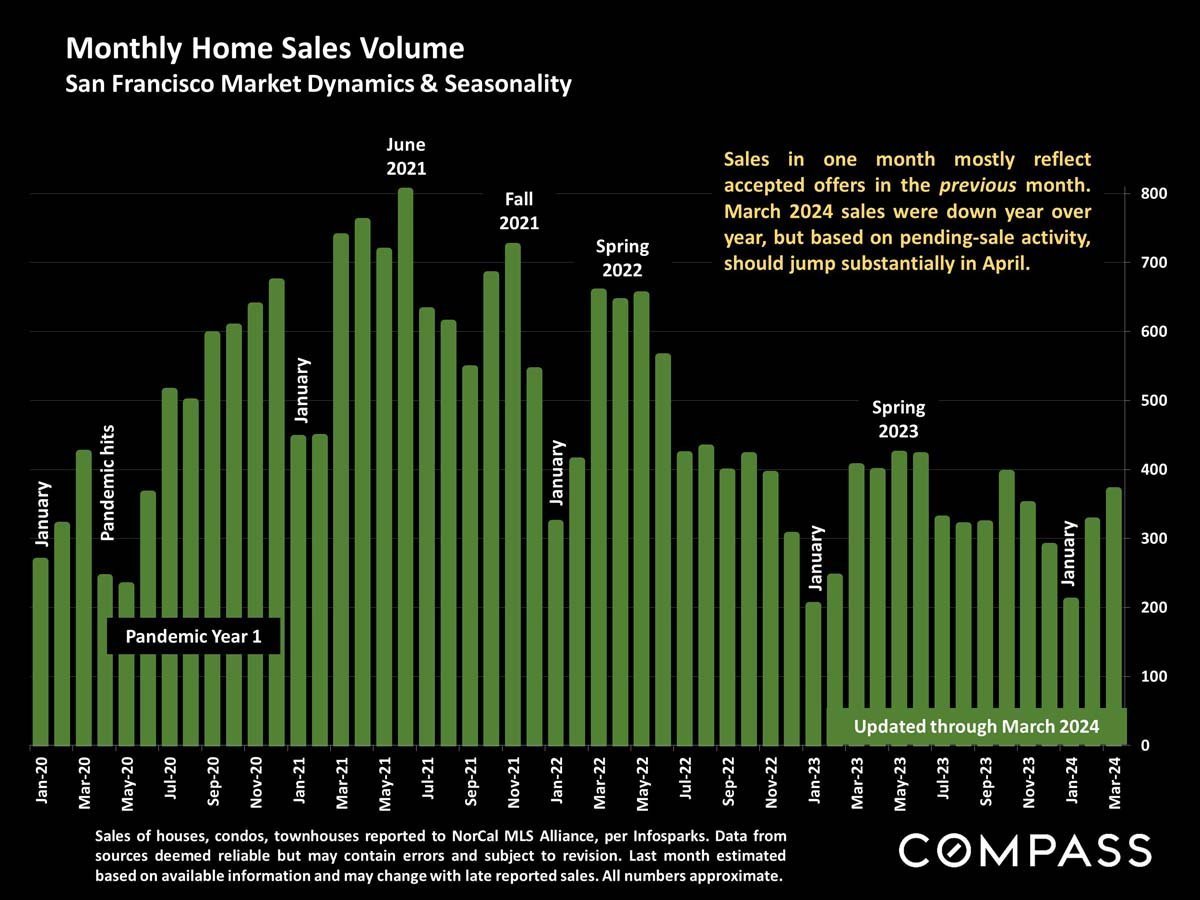
Chart of San Francisco monthly home sales from January 2020 to March 2024, with pandemic and seasonal annotations.
 
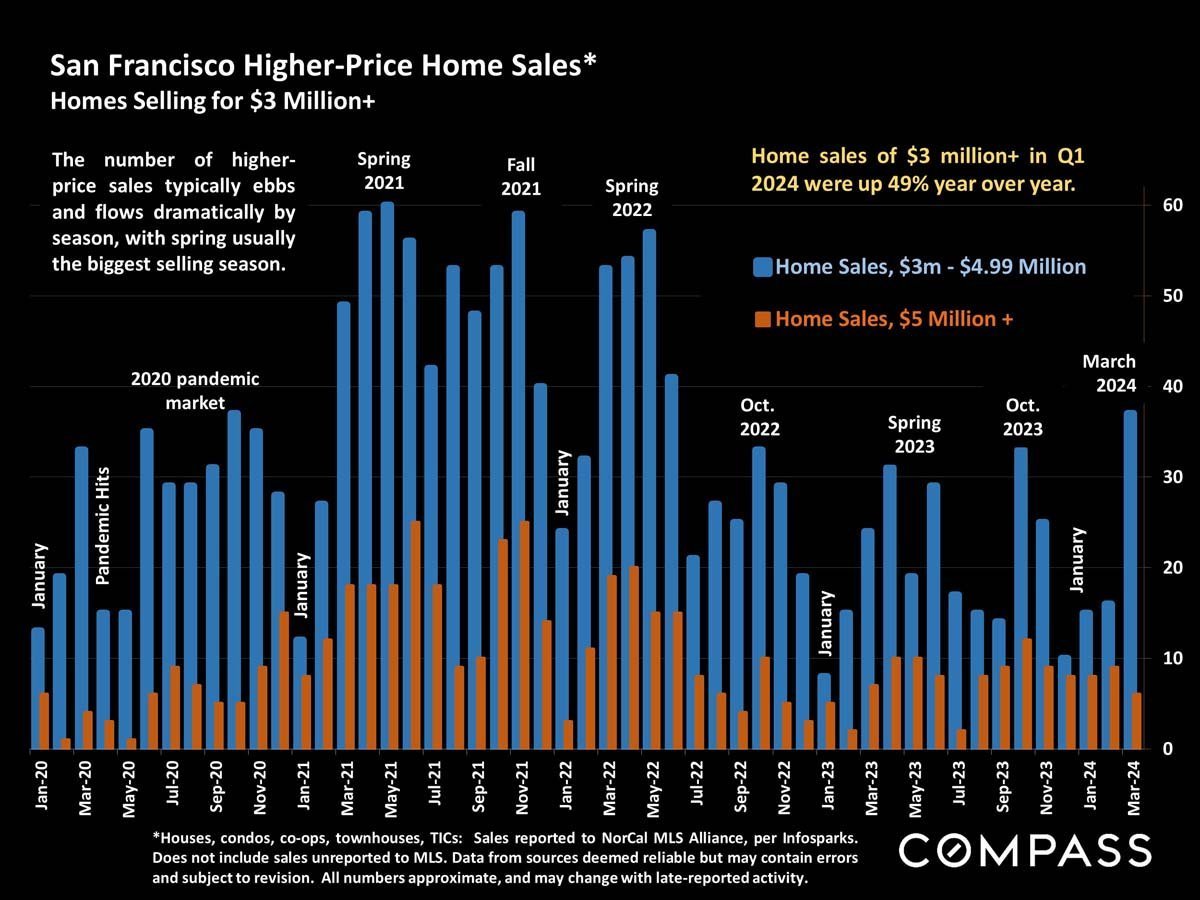
Chart of San Francisco home sales above $3 million, January 2020 to March 2024.
 
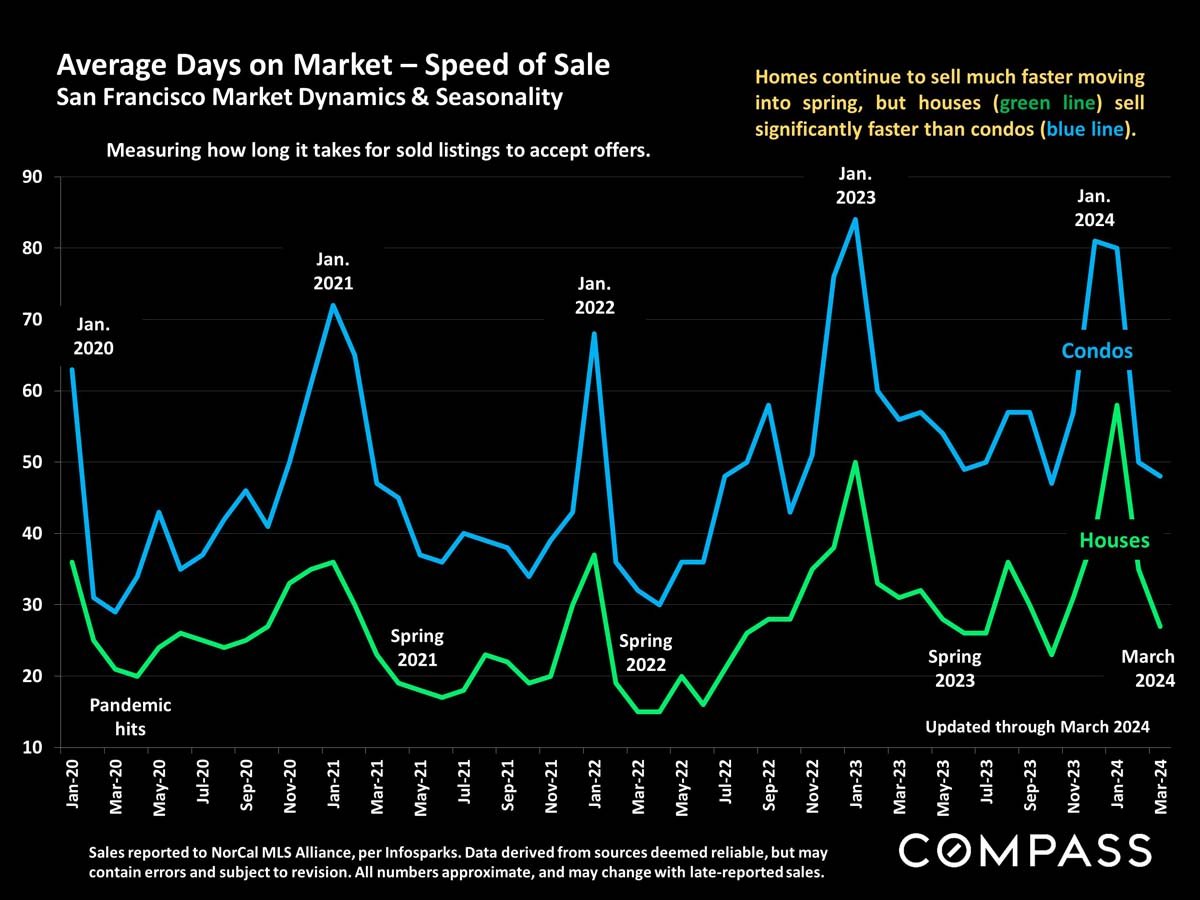
Line chart comparing days on market for San Francisco condos and houses from January 2020 to March 2024.
 
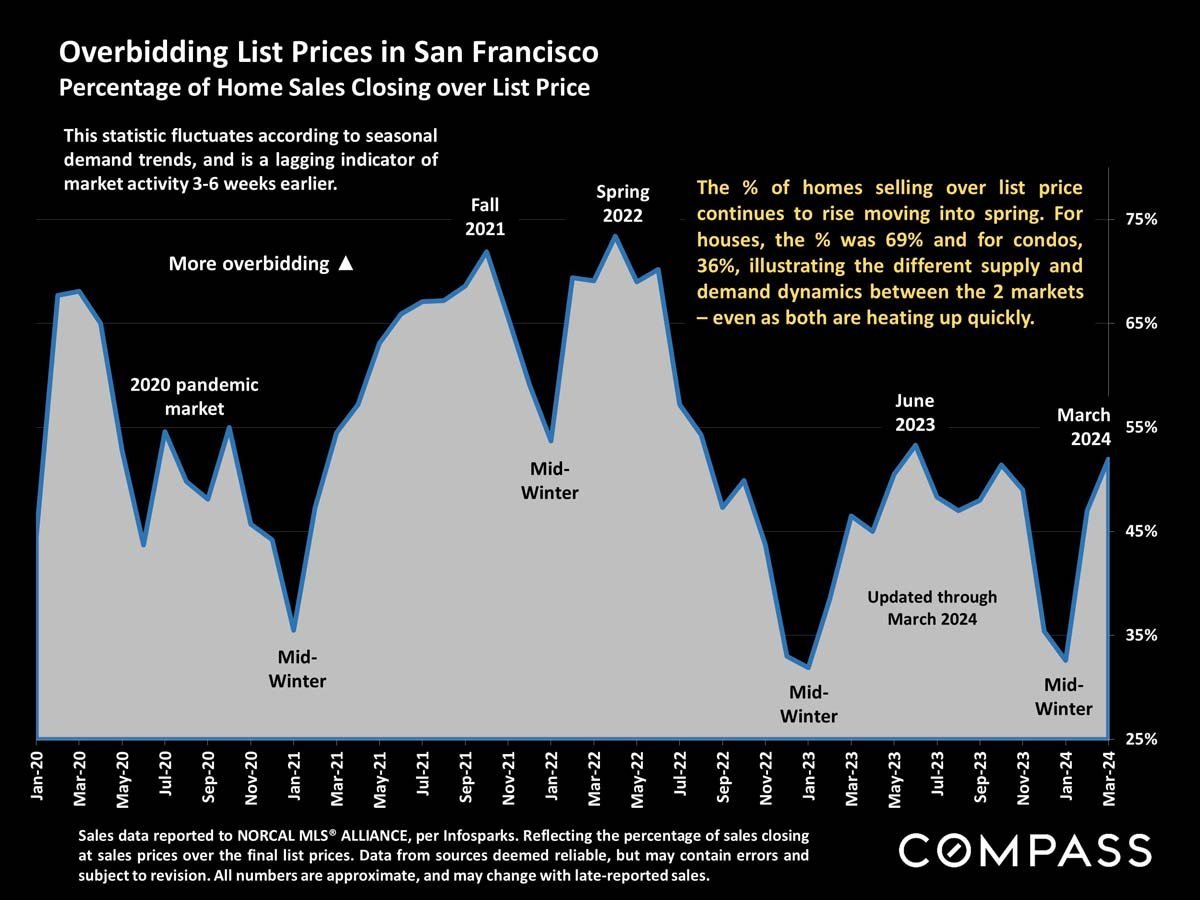
Chart of San Francisco home sales closing over list price, fluctuating from 2020 to March 2024.
 
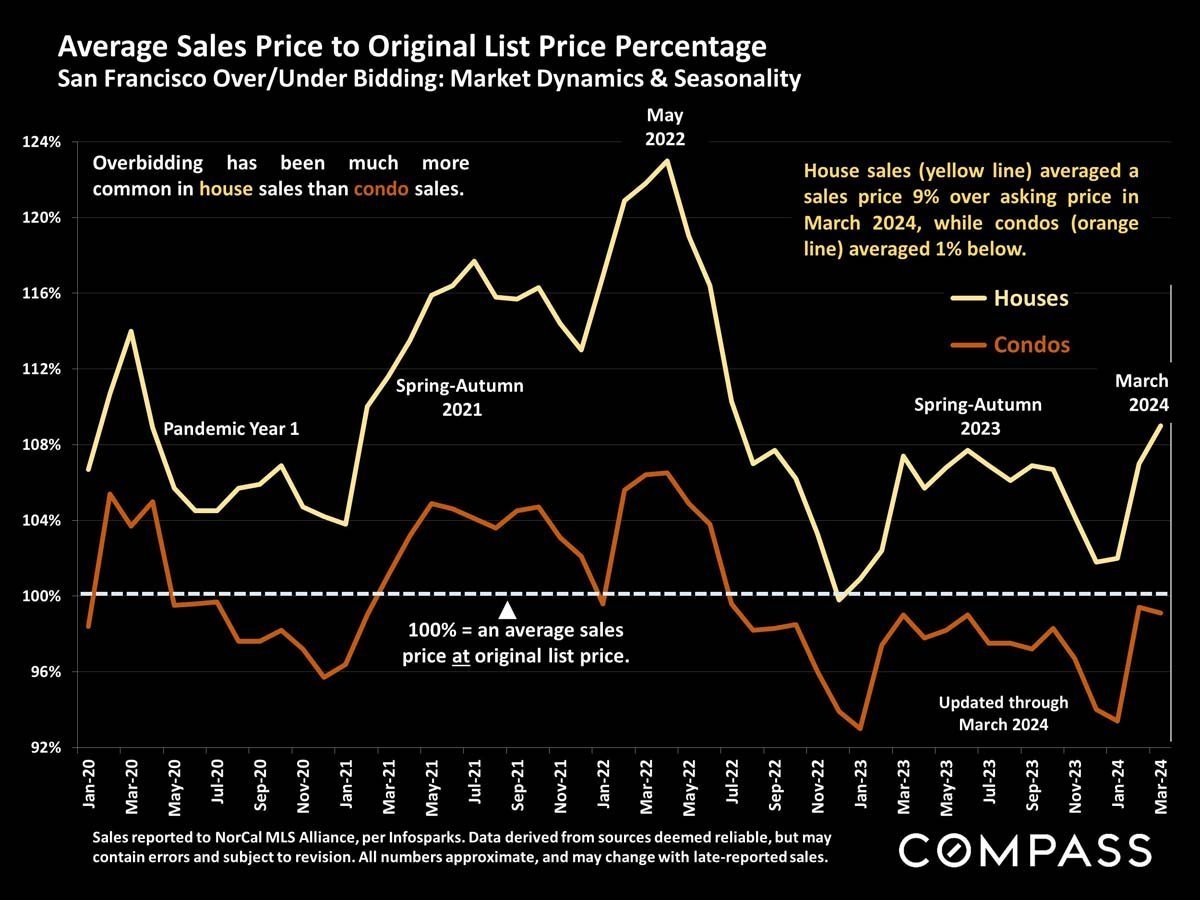
Chart comparing San Francisco house and condo sale prices to original list prices, January 2020–March 2024.
 
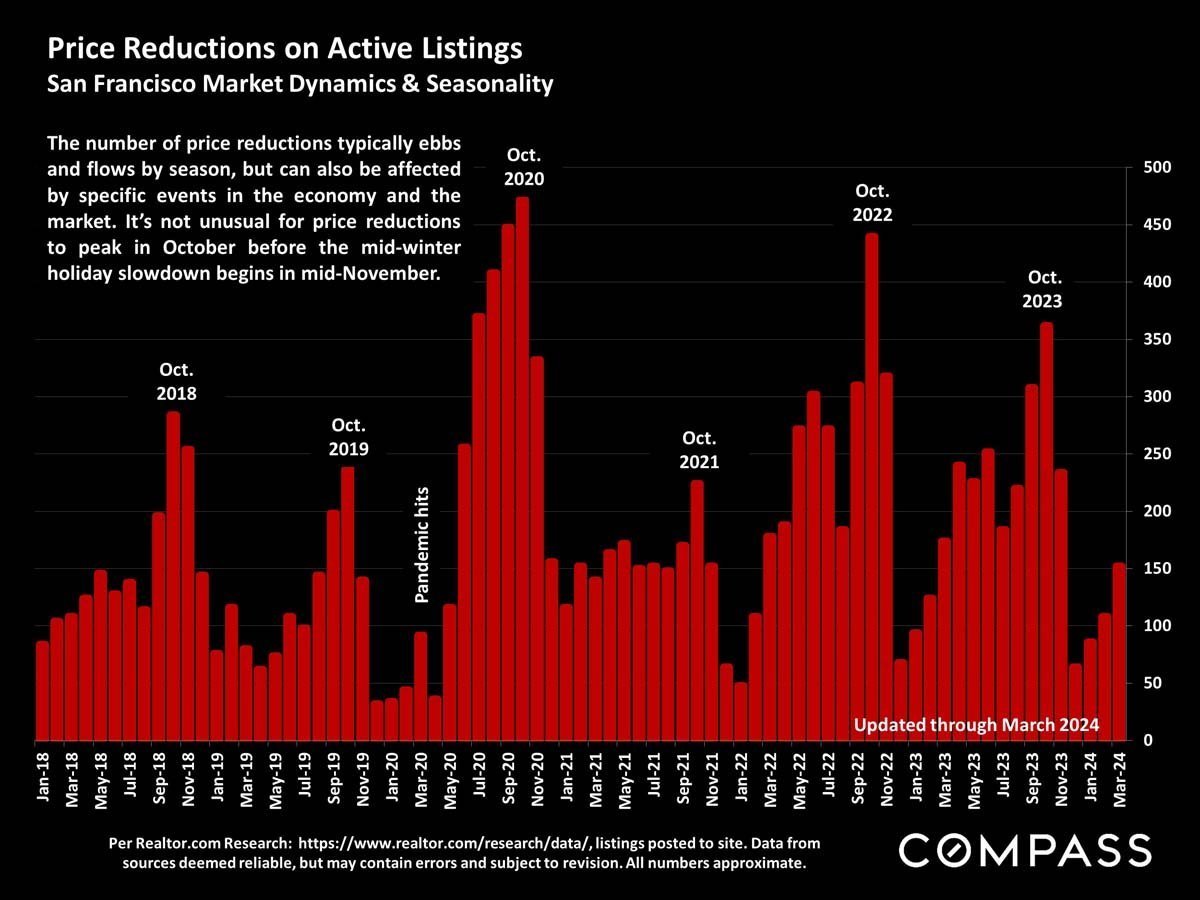
San Francisco active-listing price reductions by month, with prominent October peaks from 2018 through 2023.

Work With Jane

Get assistance in determining the current property value, crafting a competitive offer, writing and negotiating a contract, and much more. Contact me today.

Follow Me on Instagram