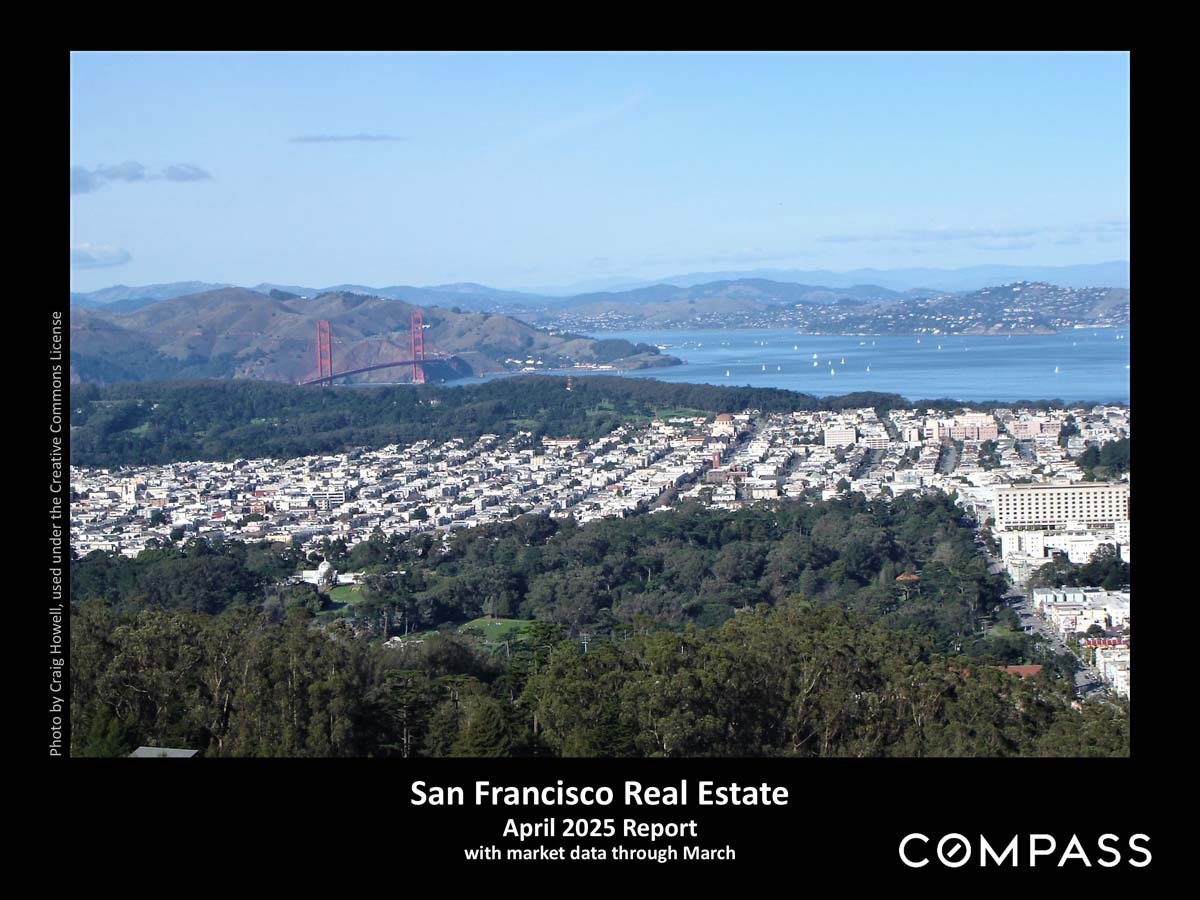
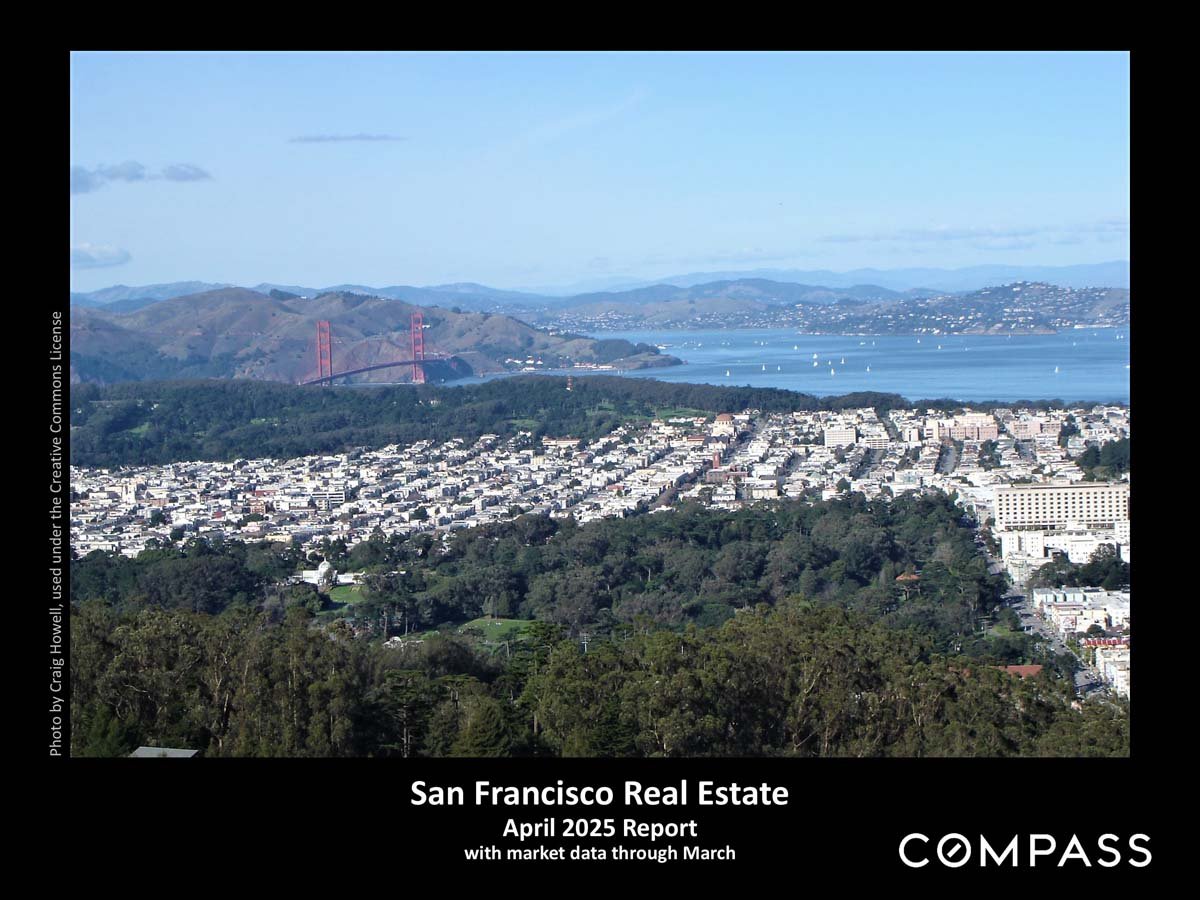
San Francisco real estate market report cover for April 2025, with a panoramic view of the city and Golden Gate Bridge.

San Francisco Home Prices, Market Conditions & Trends April 2025

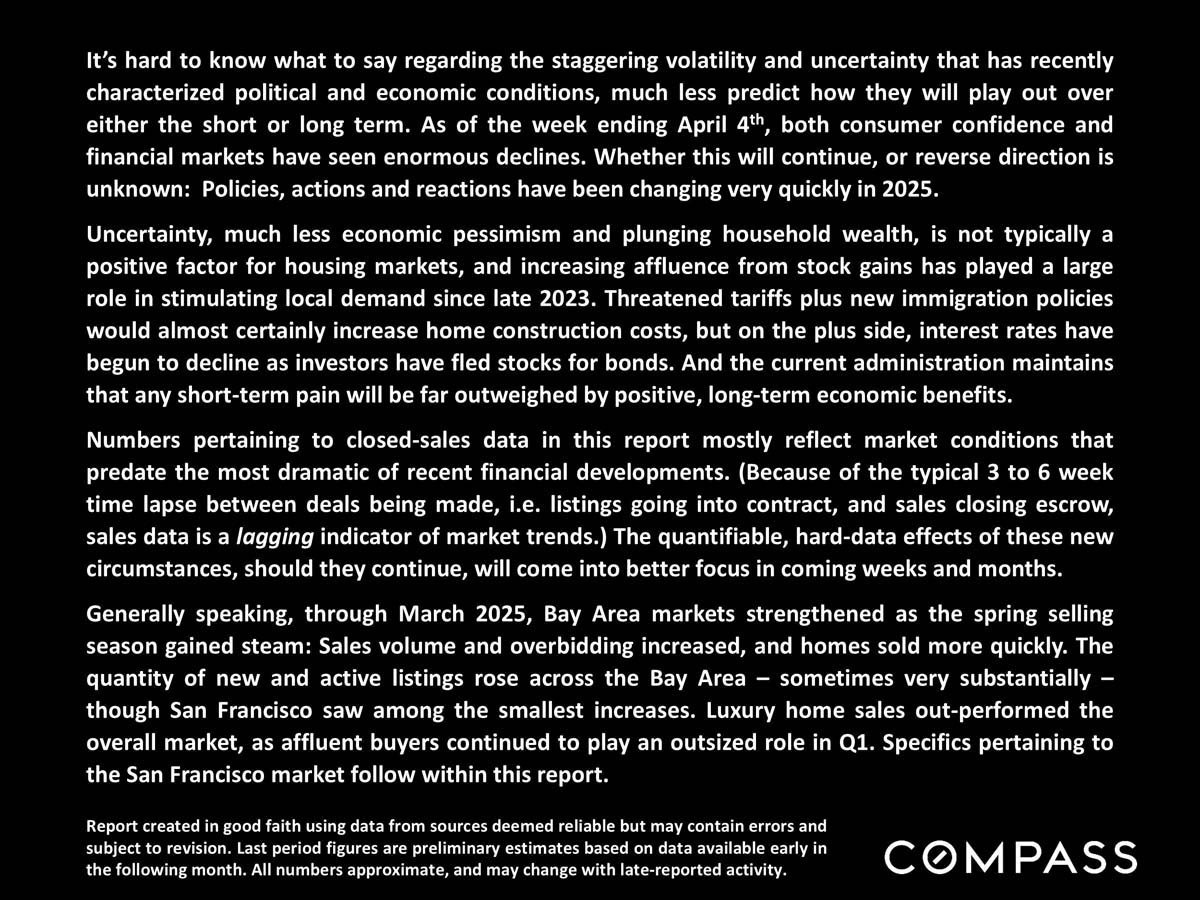
It’s hard to know what to say regarding the staggering volatility and uncertainty that has recently characterized political and economic conditions, much less predict how they will play out over either the short or long term.
 
San Francisco Real Estate April 2025 report cover with a panoramic view of the city and Golden Gate Bridge.
 
April 2025 commentary on economic uncertainty and Bay Area housing market trends, with the Compass logo.
 
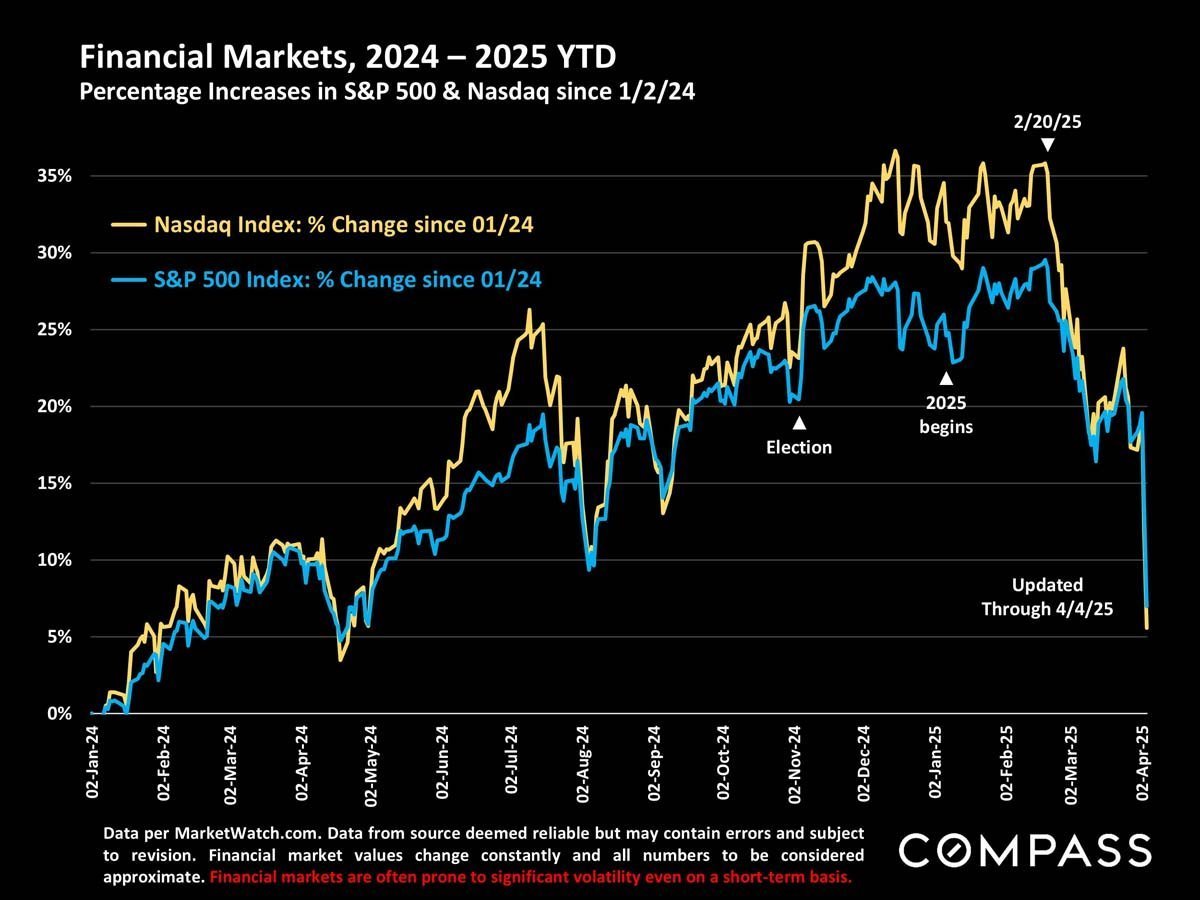
Line chart comparing Nasdaq and S&P 500 percentage changes from January 2024 through April 4, 2025.
 
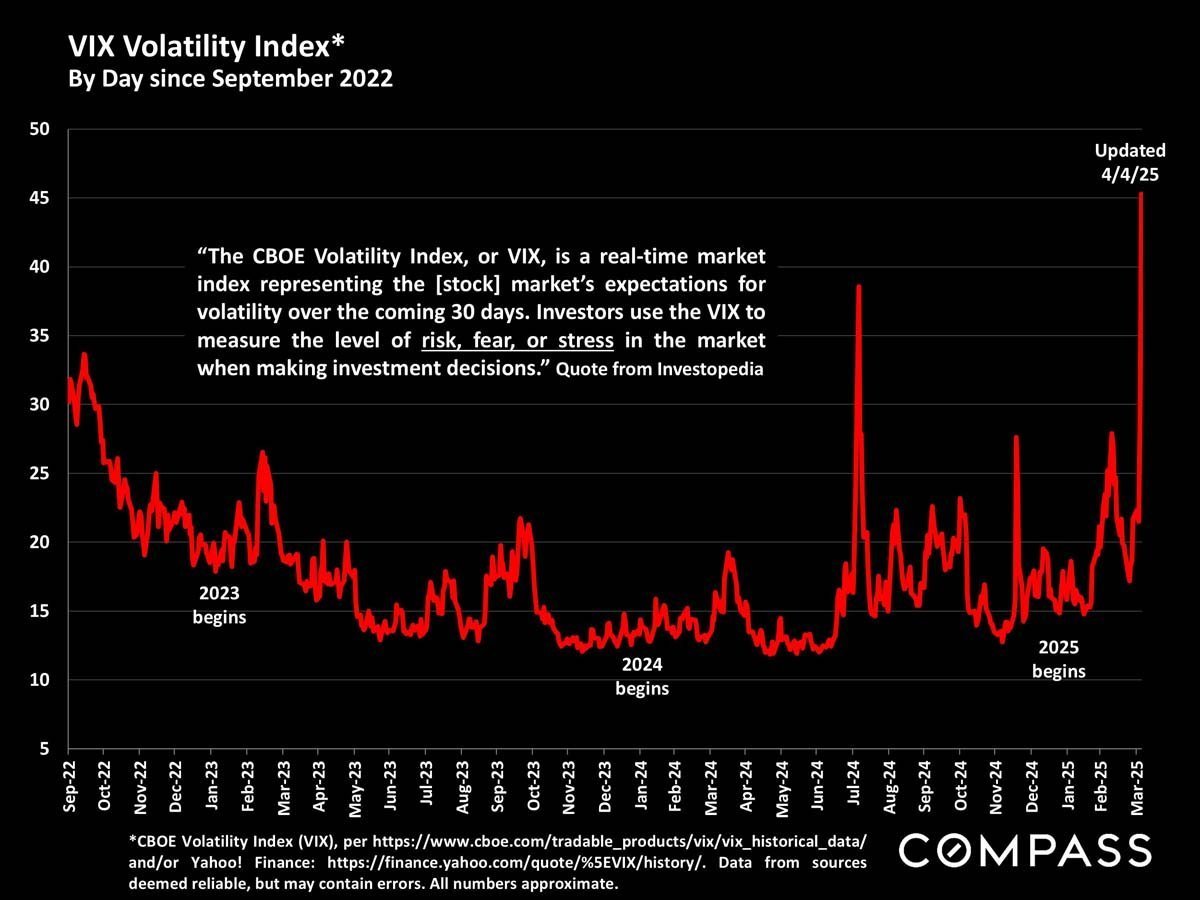
VIX volatility chart from September 2022 to April 2025, with a sharp spike above 45 in April 2025.
 
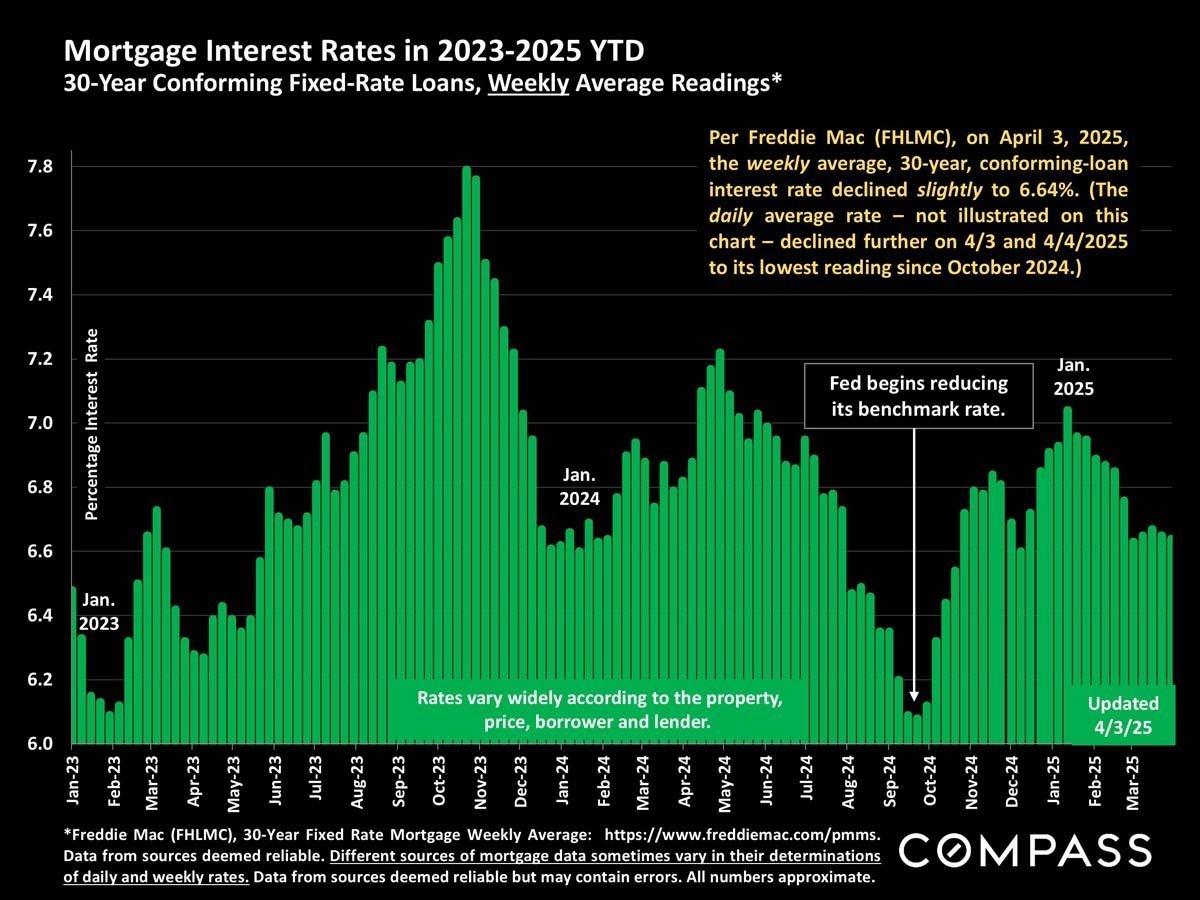
Chart of weekly 30-year mortgage rates, peaking near 7.8% in late 2023 and ending at 6.64% in April 2025.
 
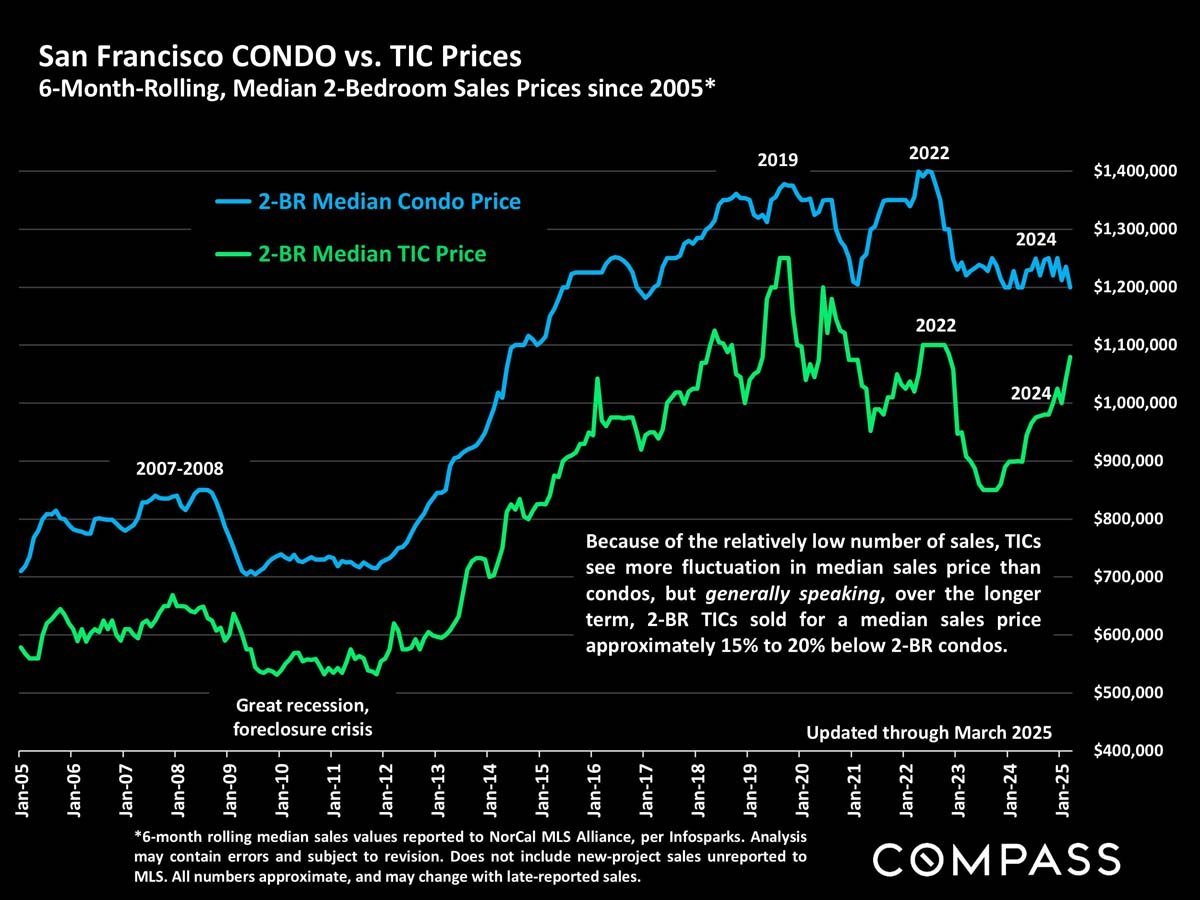
Chart comparing San Francisco two-bedroom condo and TIC prices from 2005 to 2025, with condo prices generally higher.
 
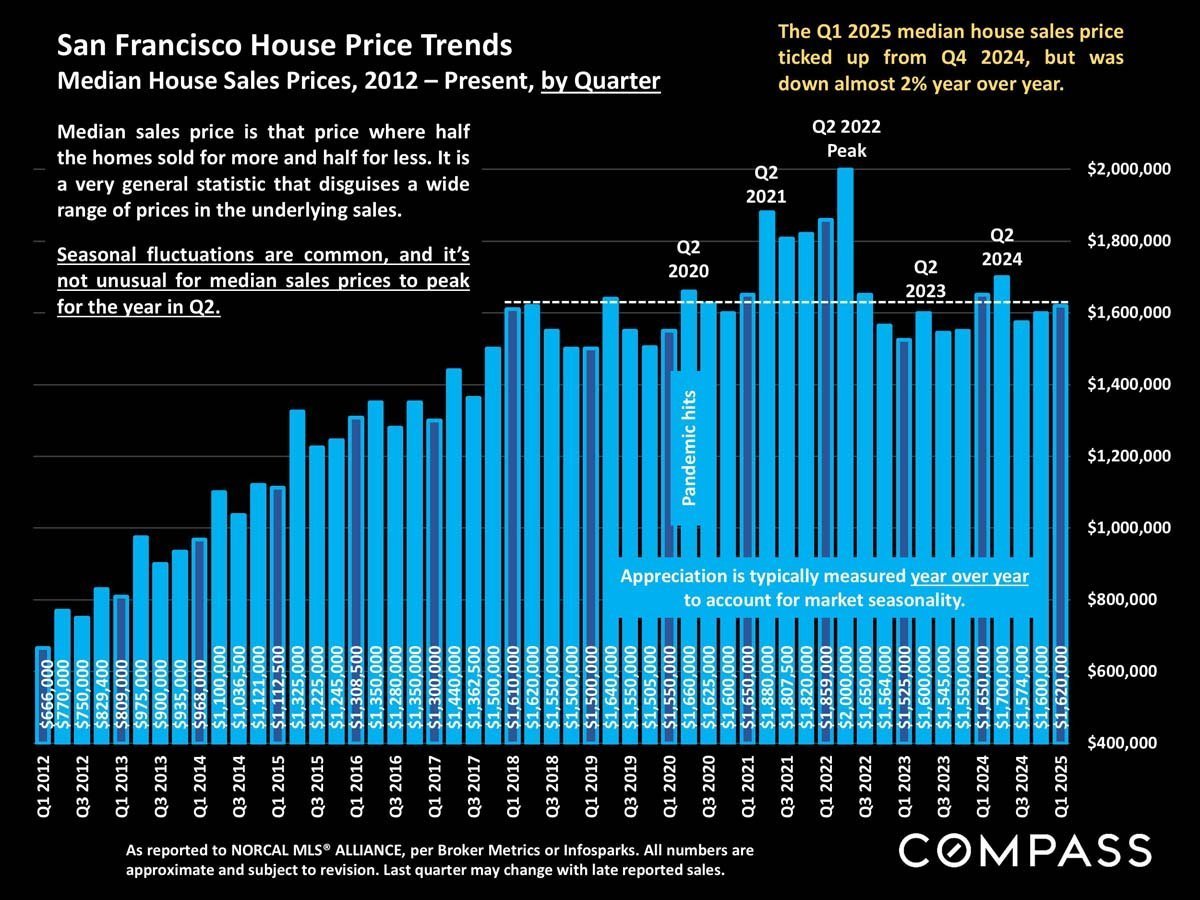
San Francisco quarterly median home prices, 2012–2025, peaking at $2 million in Q2 2022.
 
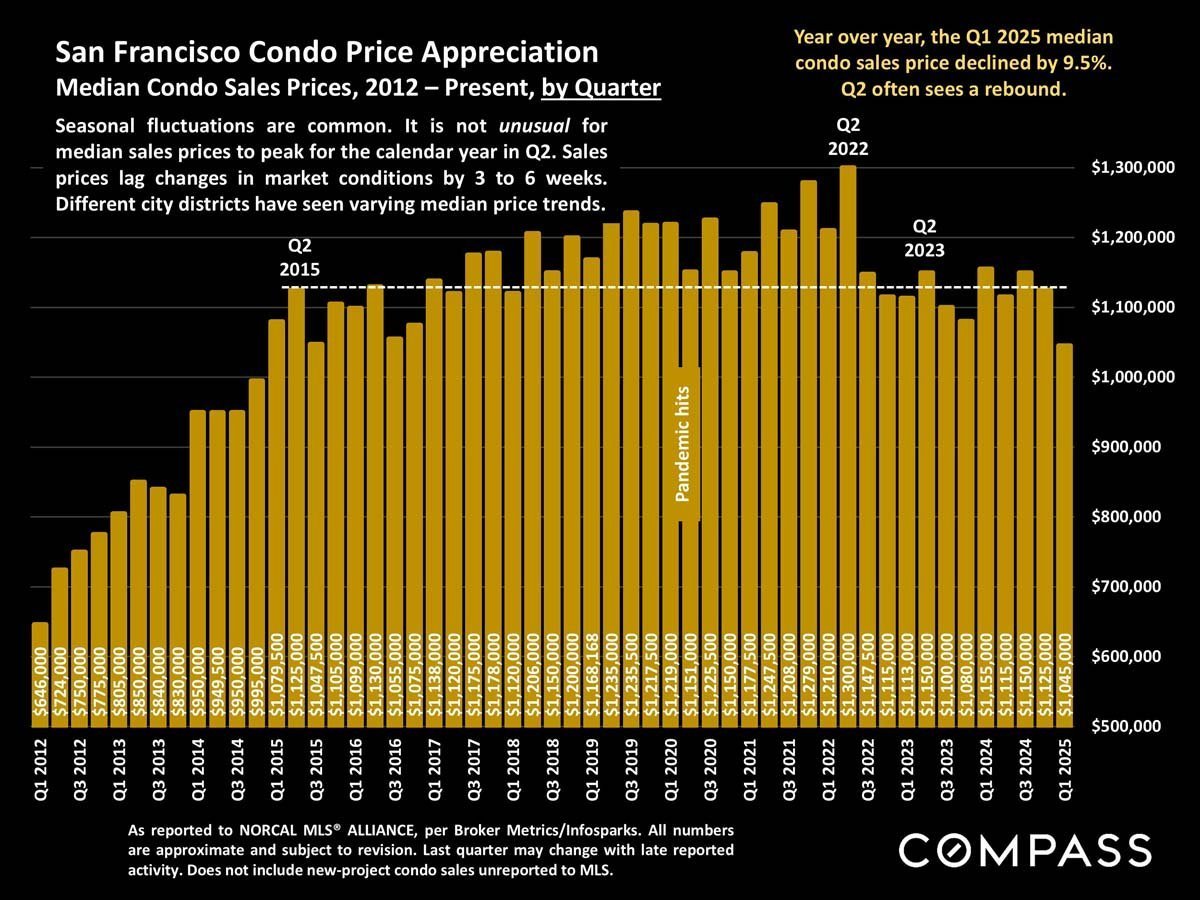
Chart of San Francisco condo prices by quarter, showing a Q1 2025 median price decline of 9.5% year over year.
 
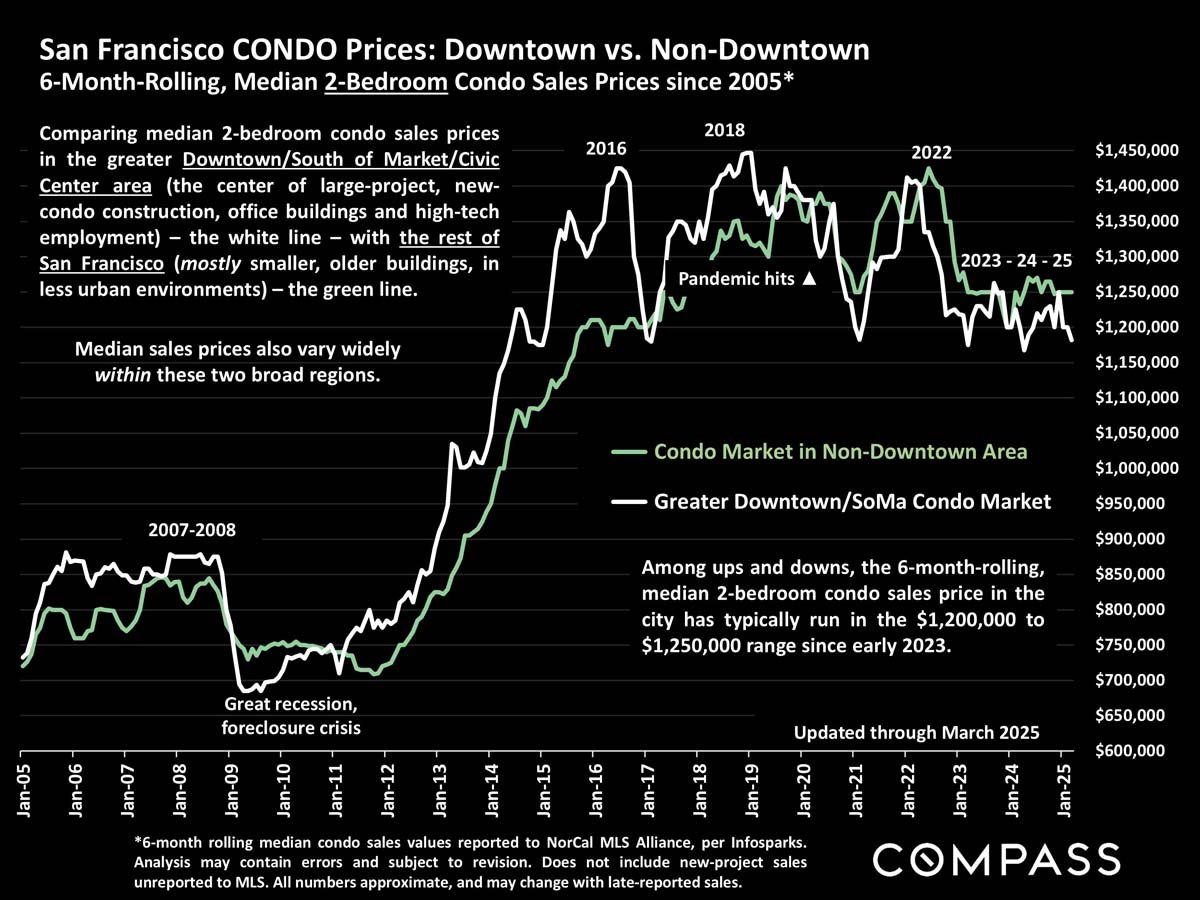
Chart comparing San Francisco two-bedroom condo prices downtown and elsewhere from 2005 to 2025.
 
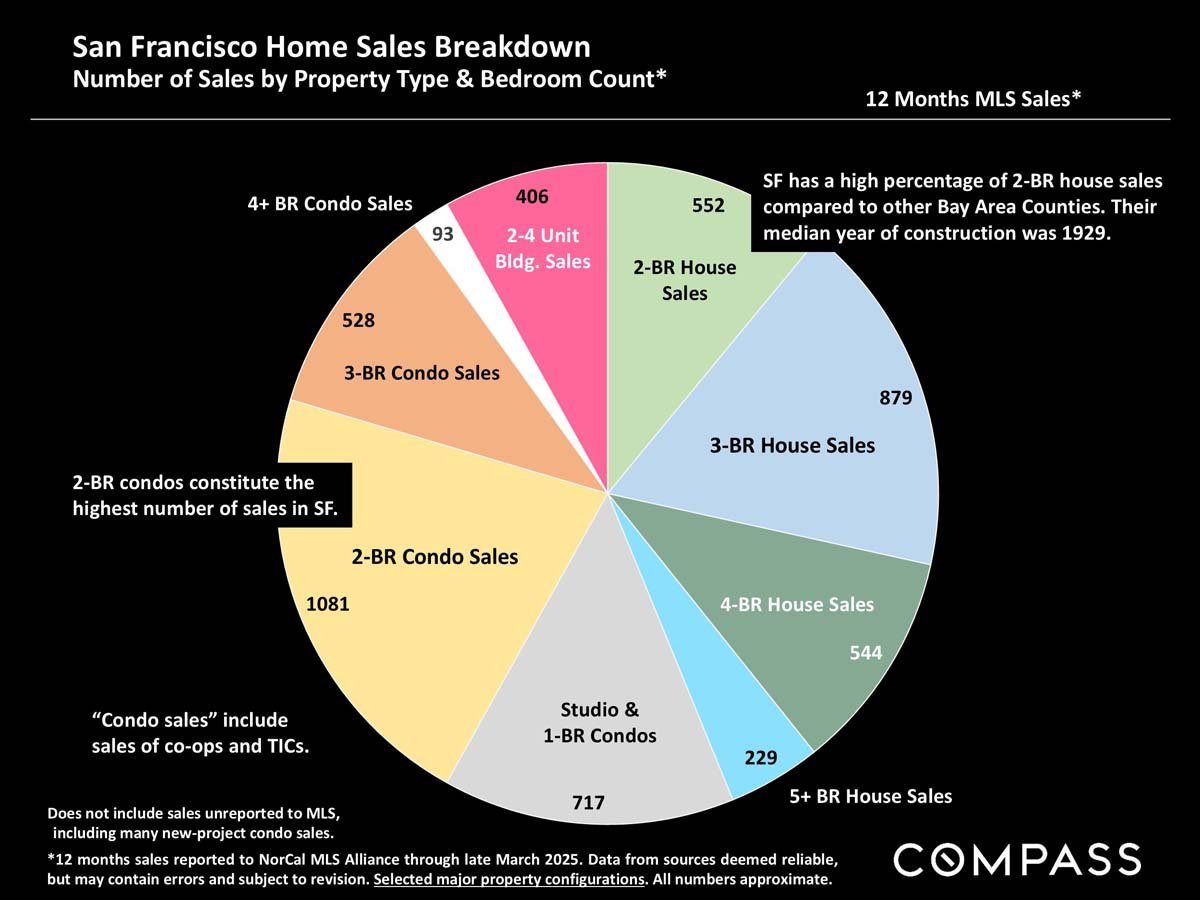
San Francisco home sales breakdown by property type and bedroom count; 2-bedroom condos lead with 1,081 sales.
 
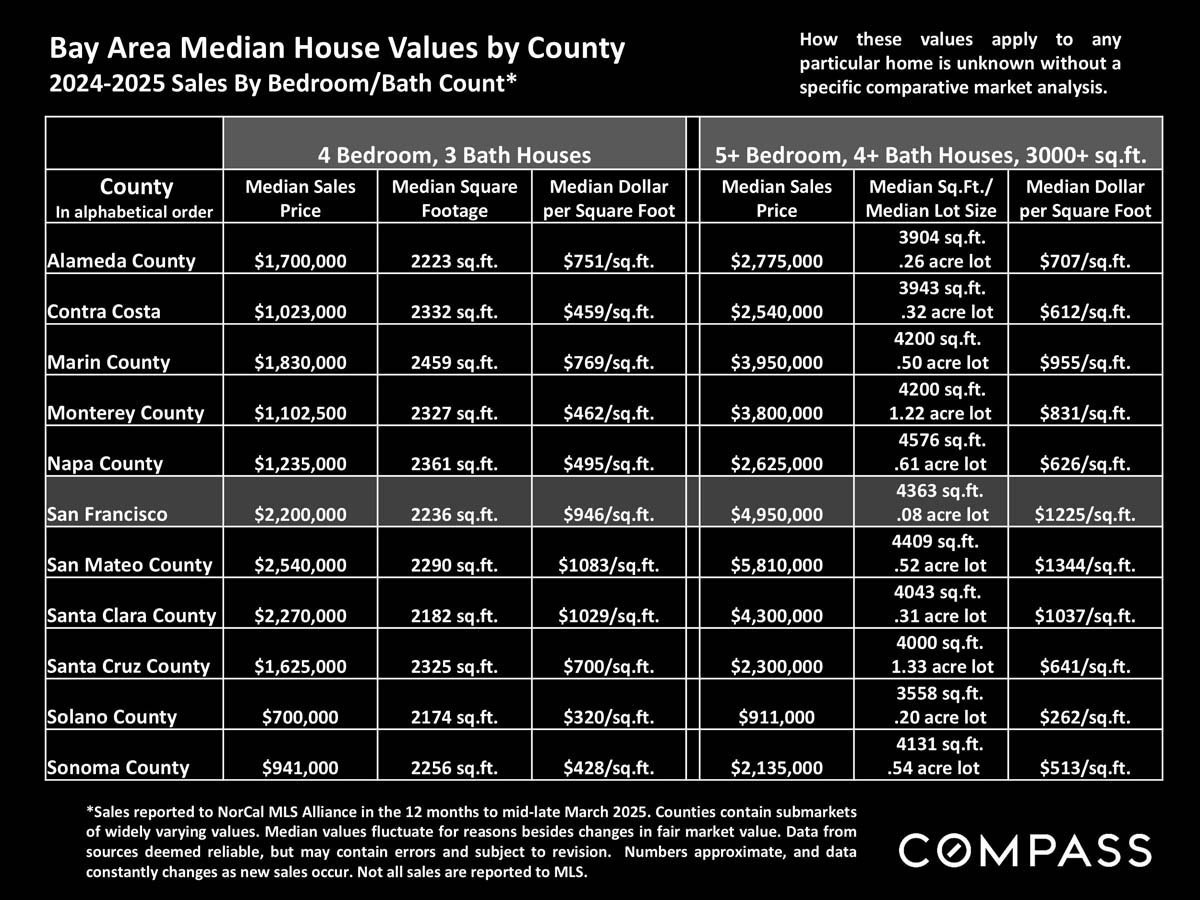
Bay Area median house values by county, comparing sales by bedroom and bath count for 2024–2025.
 
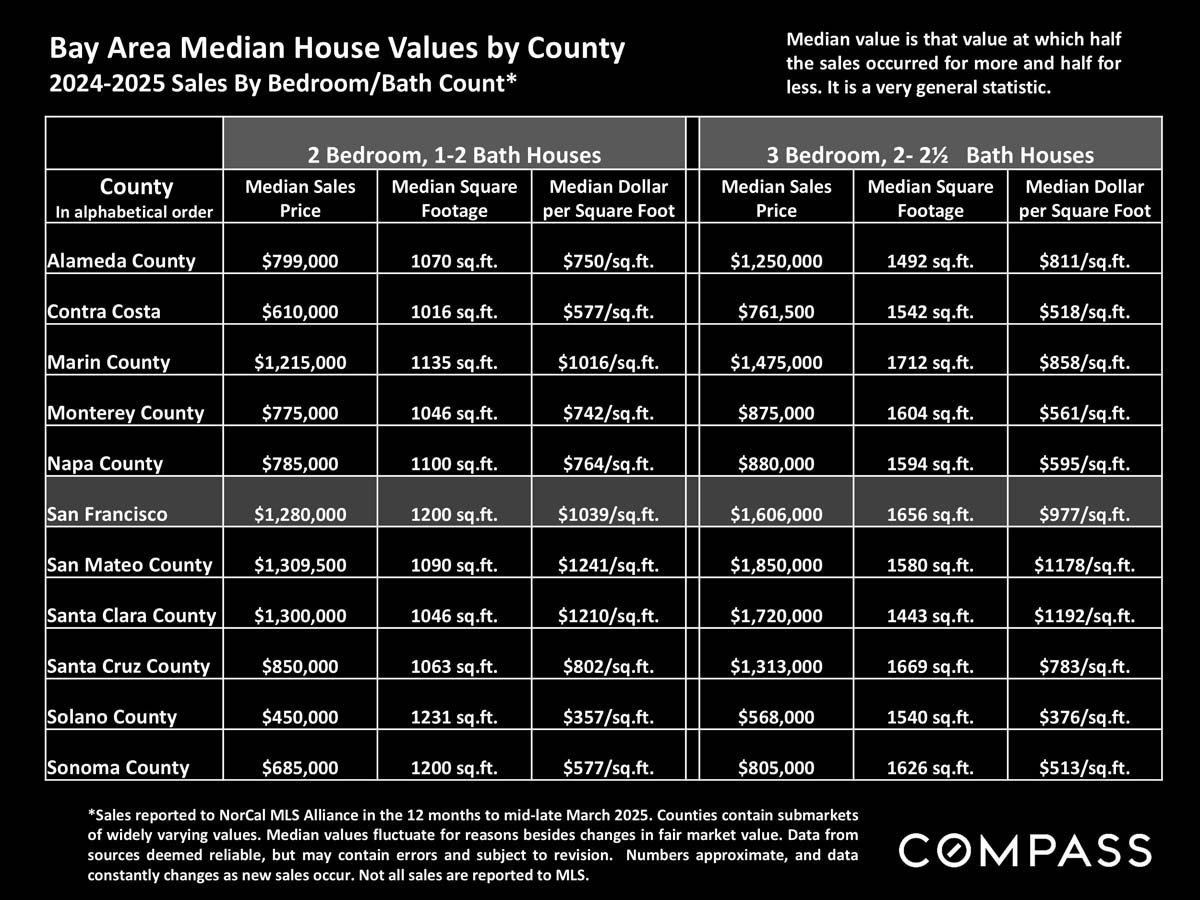
Bay Area county home-value table comparing median prices, square footage, and price per square foot by bedroom count.
 
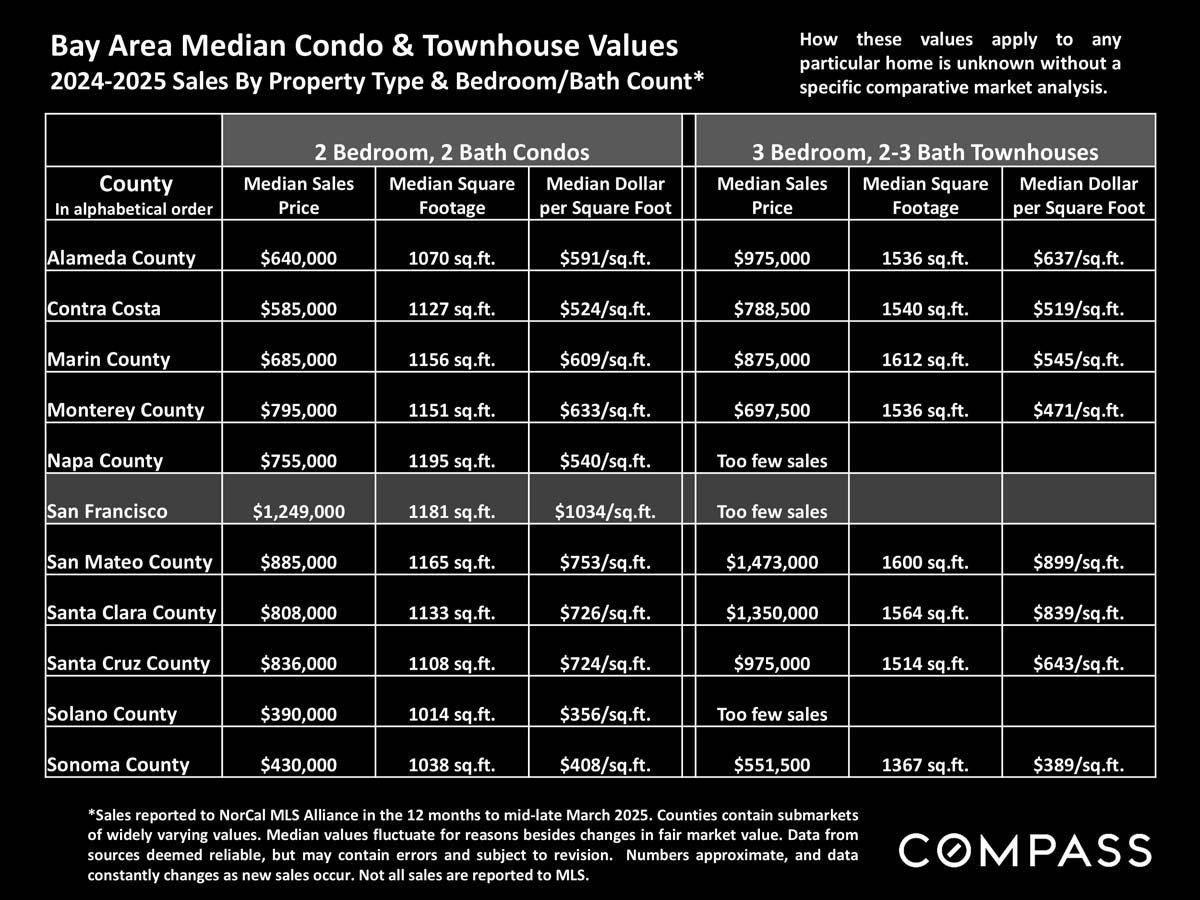
Bay Area condo and townhouse median prices, sizes, and price per square foot by county, 2024–2025.
 
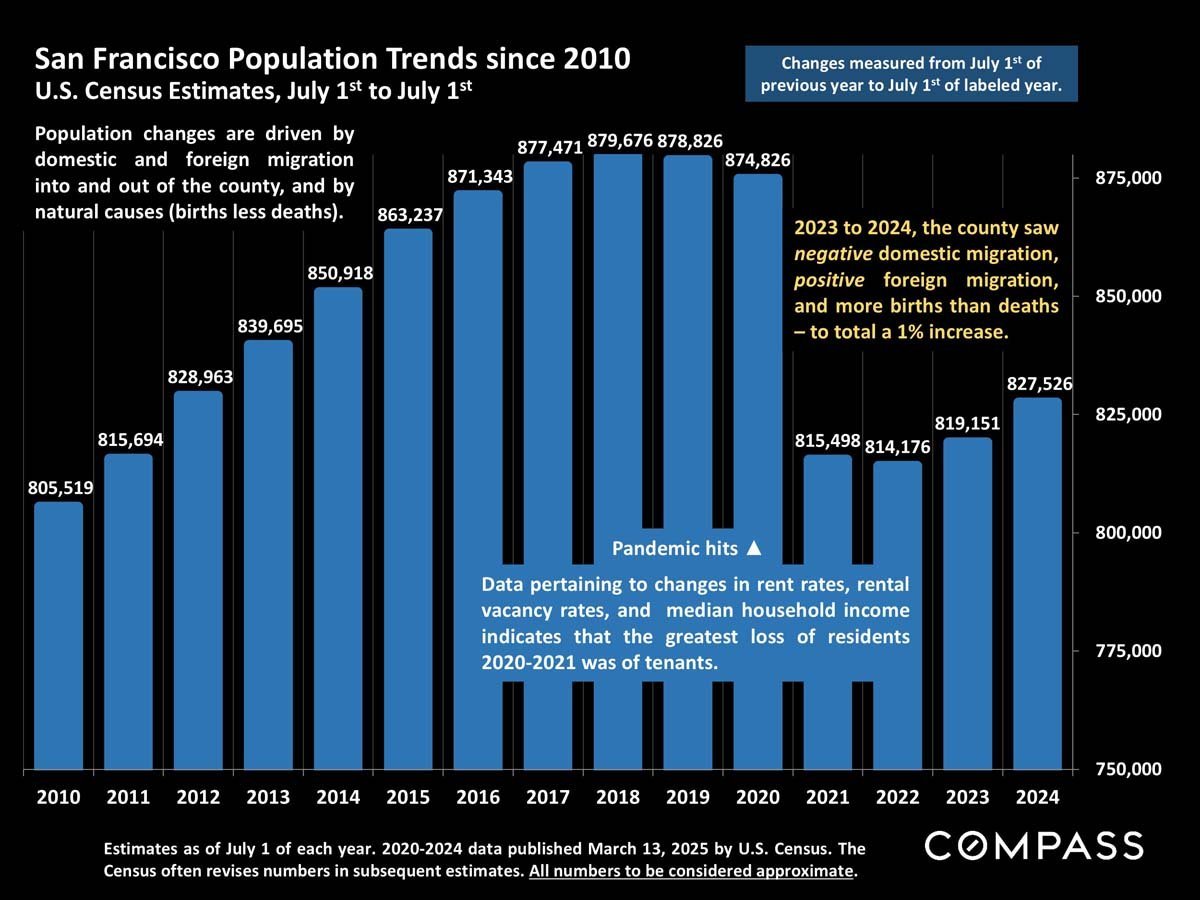
Chart of San Francisco population estimates from 2010 to 2024, with a 2018 peak and sharp decline in 2021.
 
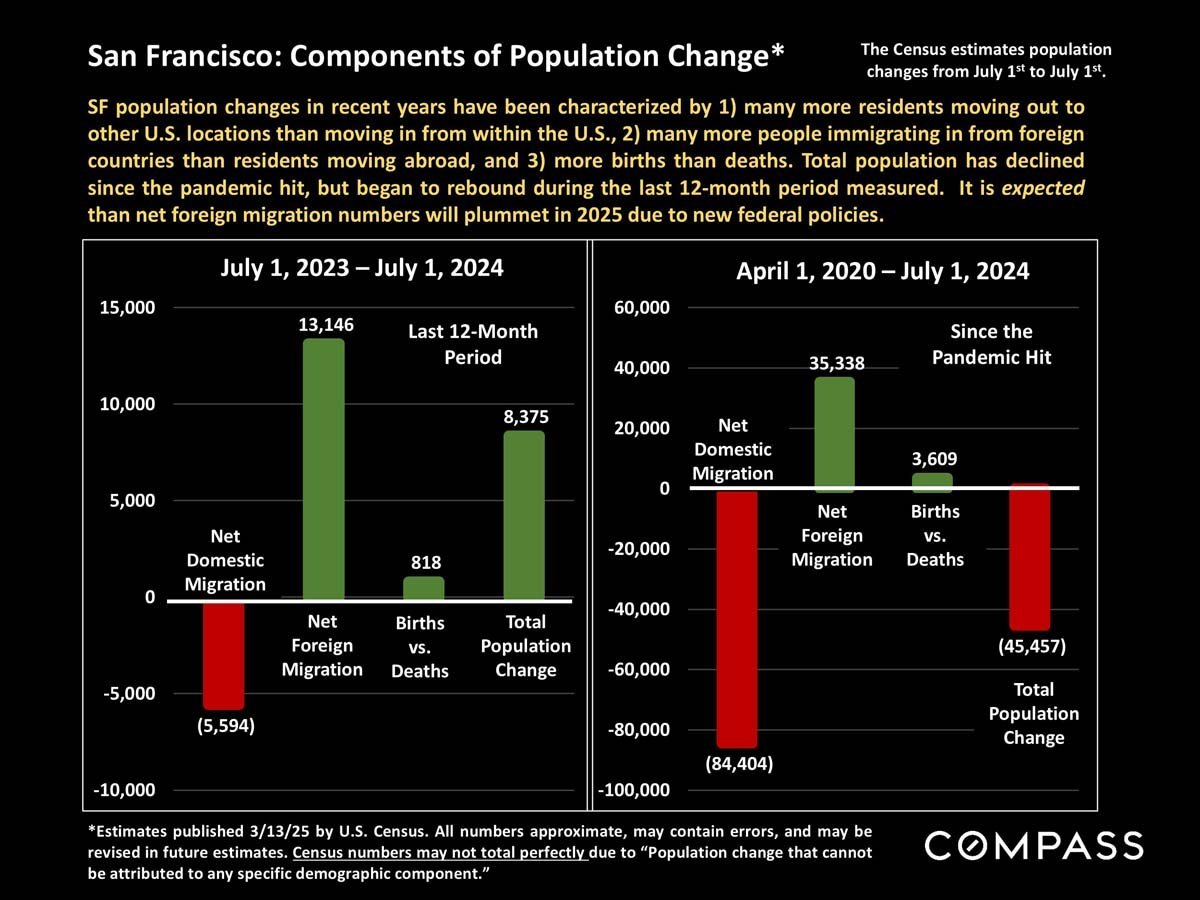
Infographic comparing San Francisco population change components from 2020–2024 and 2023–2024.
 
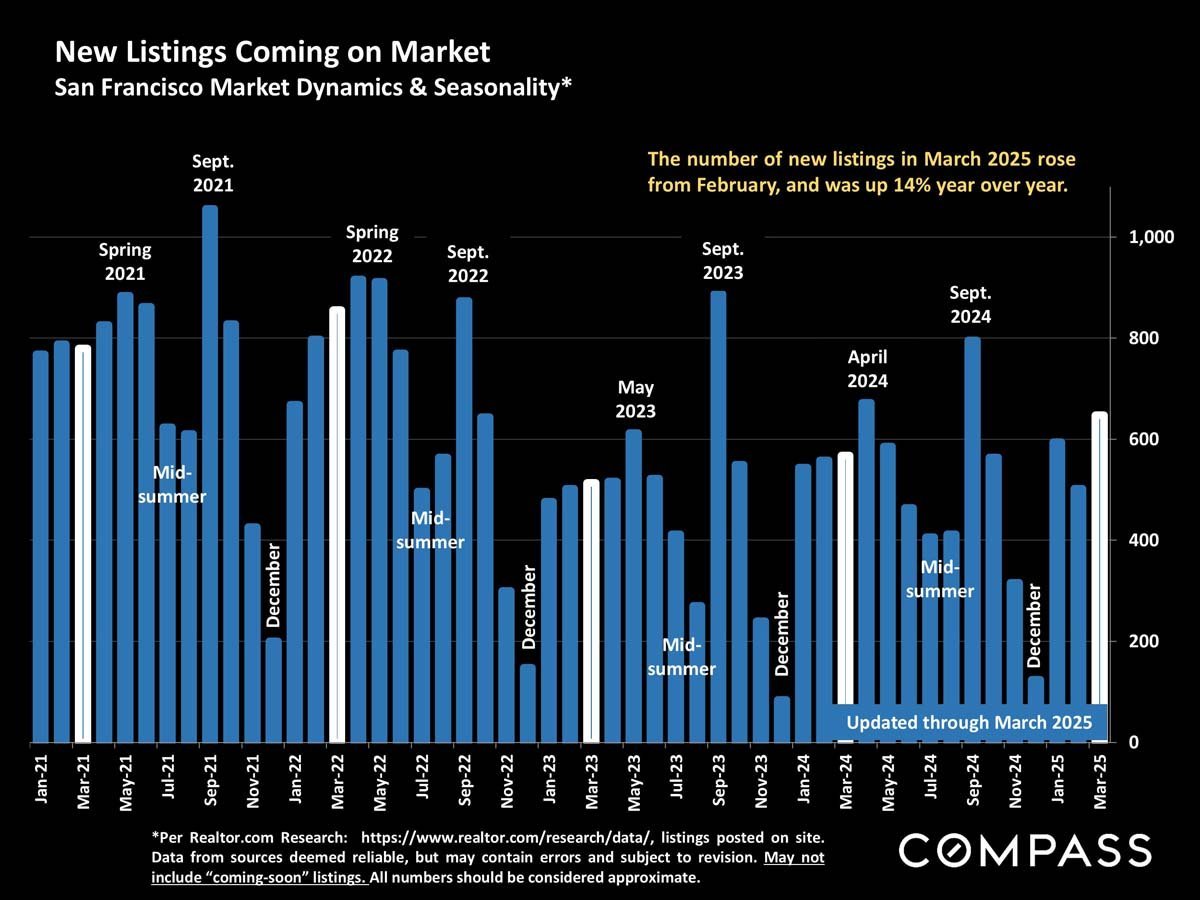
Chart of San Francisco new listings from January 2021 to March 2025, with monthly bars and seasonal annotations.
 
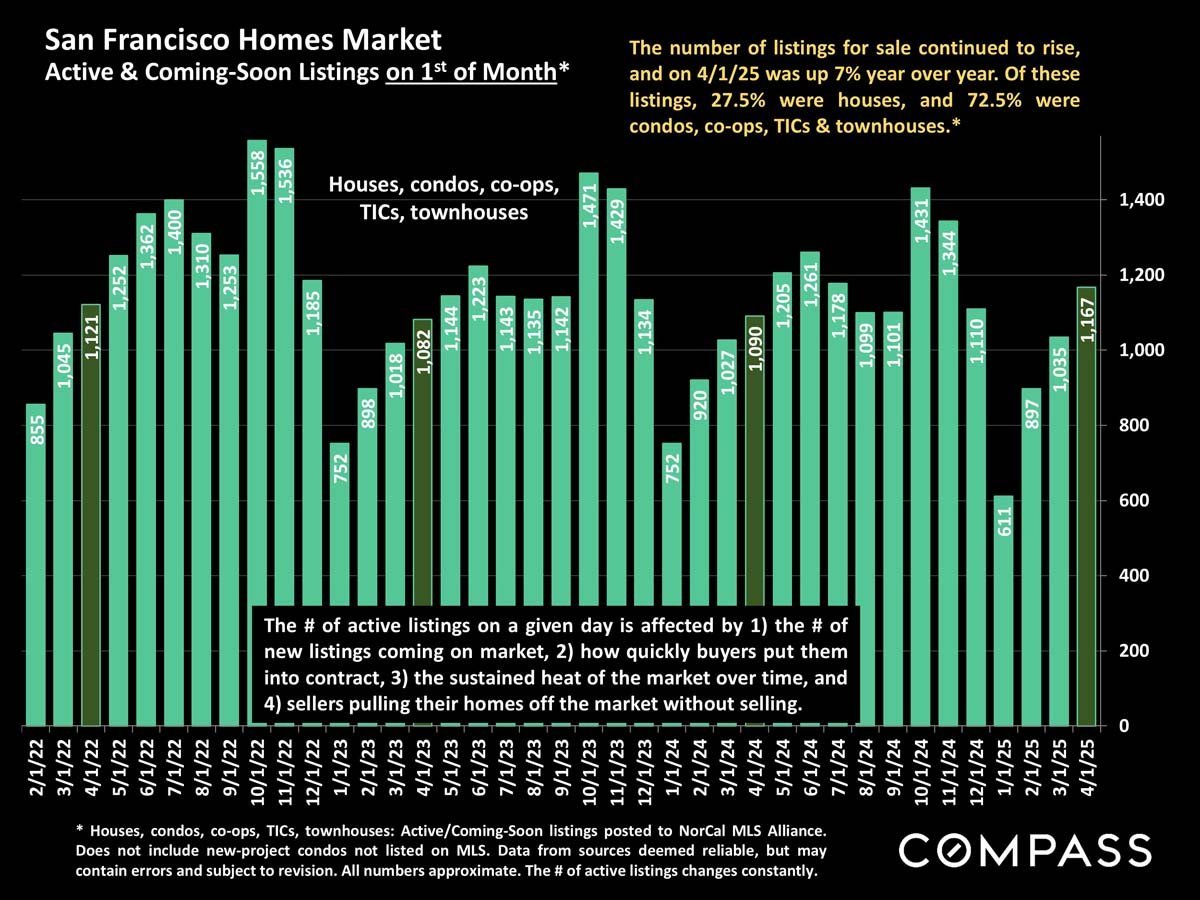
Bar chart of San Francisco active and coming-soon listings, January 2022–April 2025; April 2025 shows 1,167 listings.
 
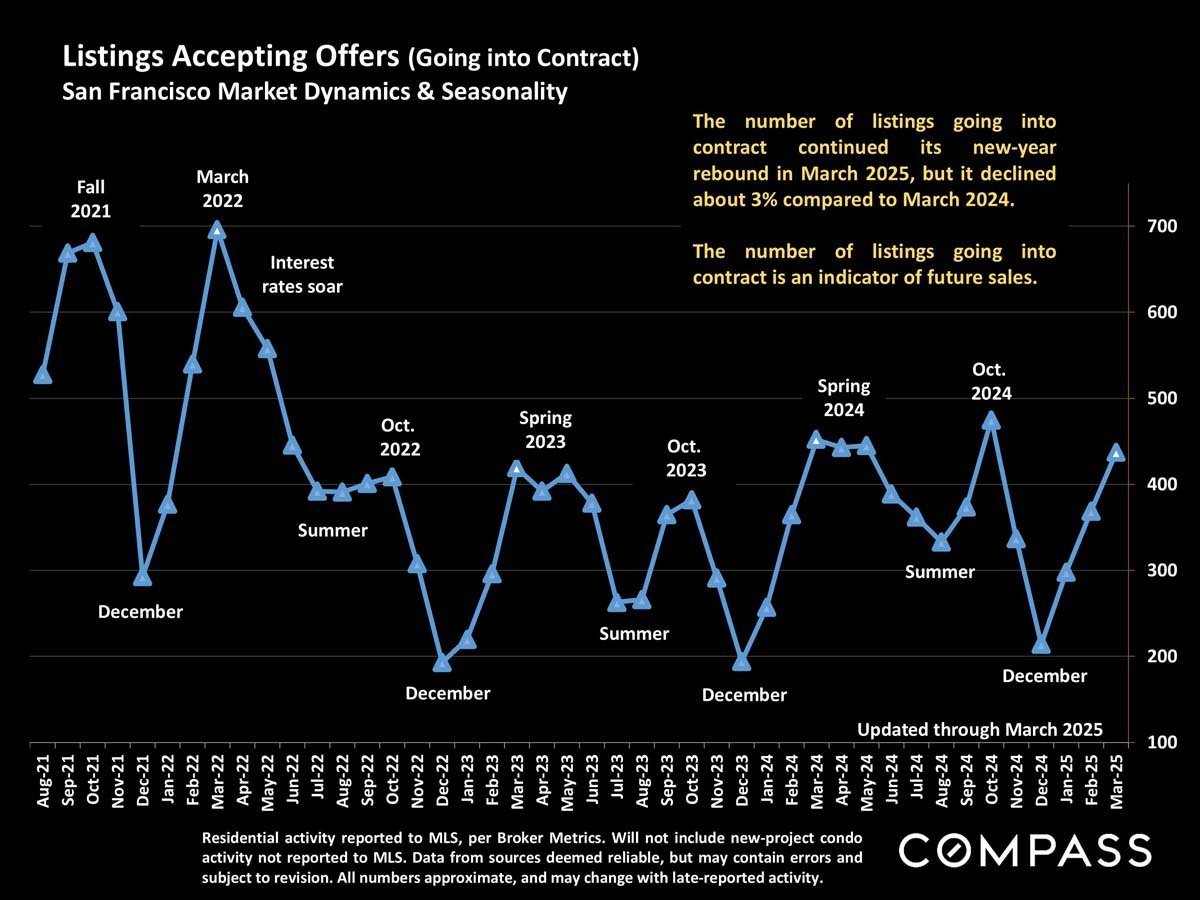
Line chart of San Francisco listings going into contract, August 2021–March 2025, with seasonal fluctuations.
 
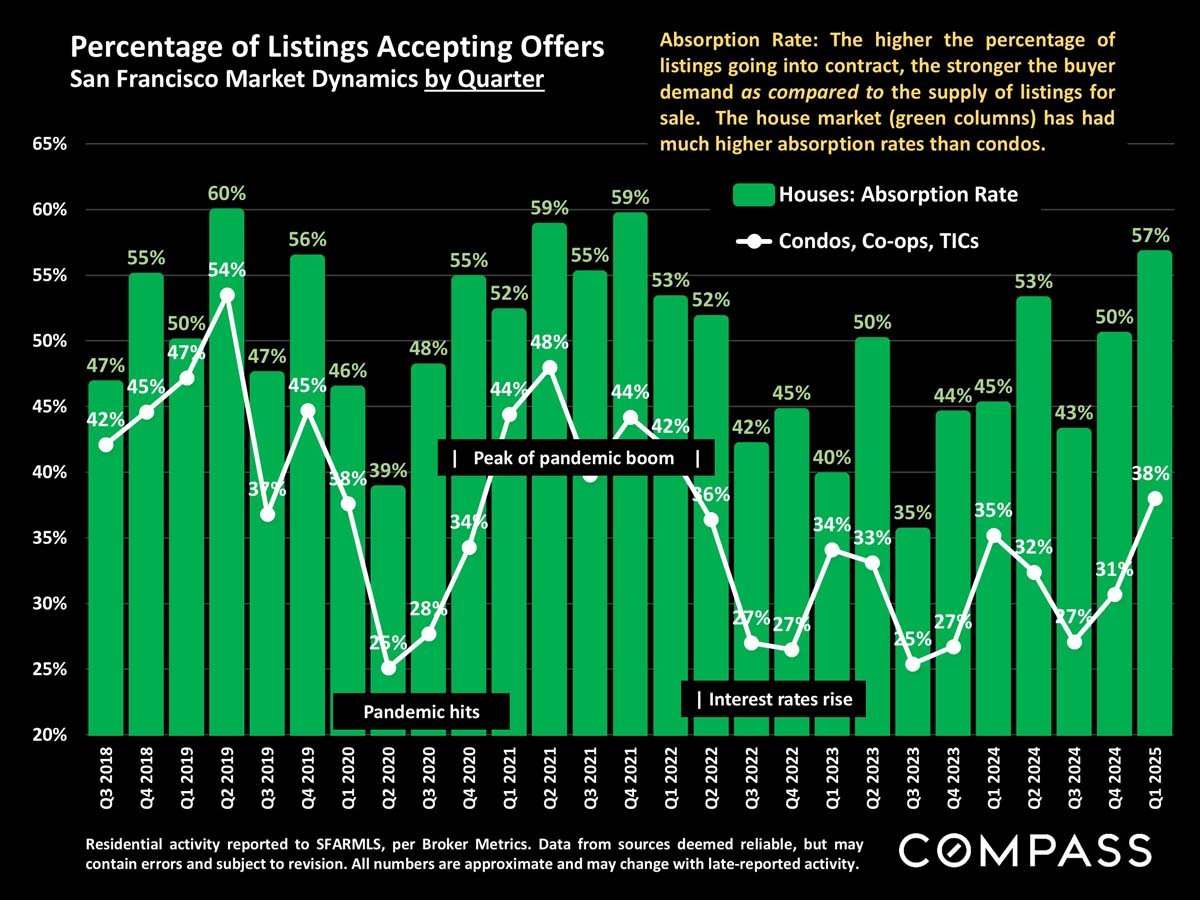
Chart comparing quarterly San Francisco house and condo listing absorption rates from 2018 to 2025.
 
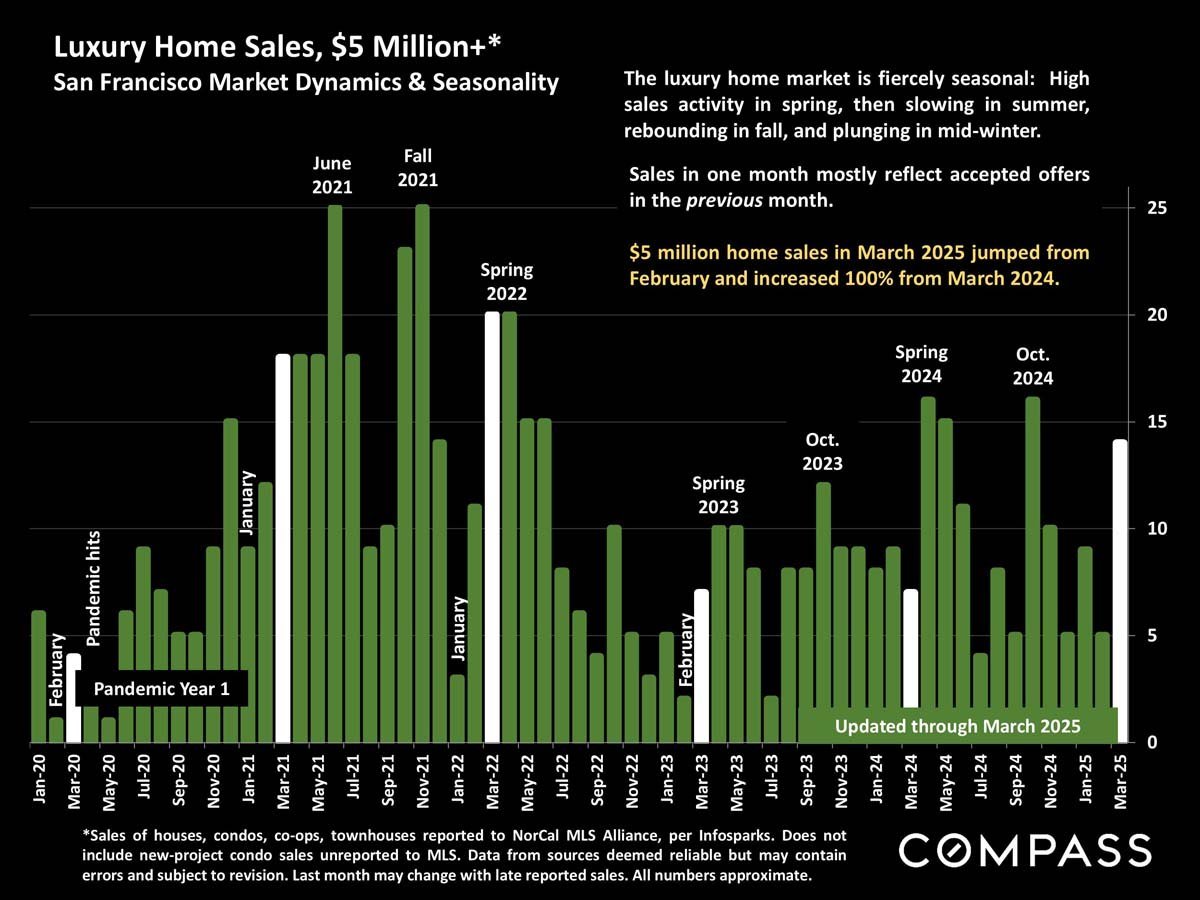
Chart of San Francisco $5 million-plus home sales, showing monthly counts and seasonal trends through March 2025.
 
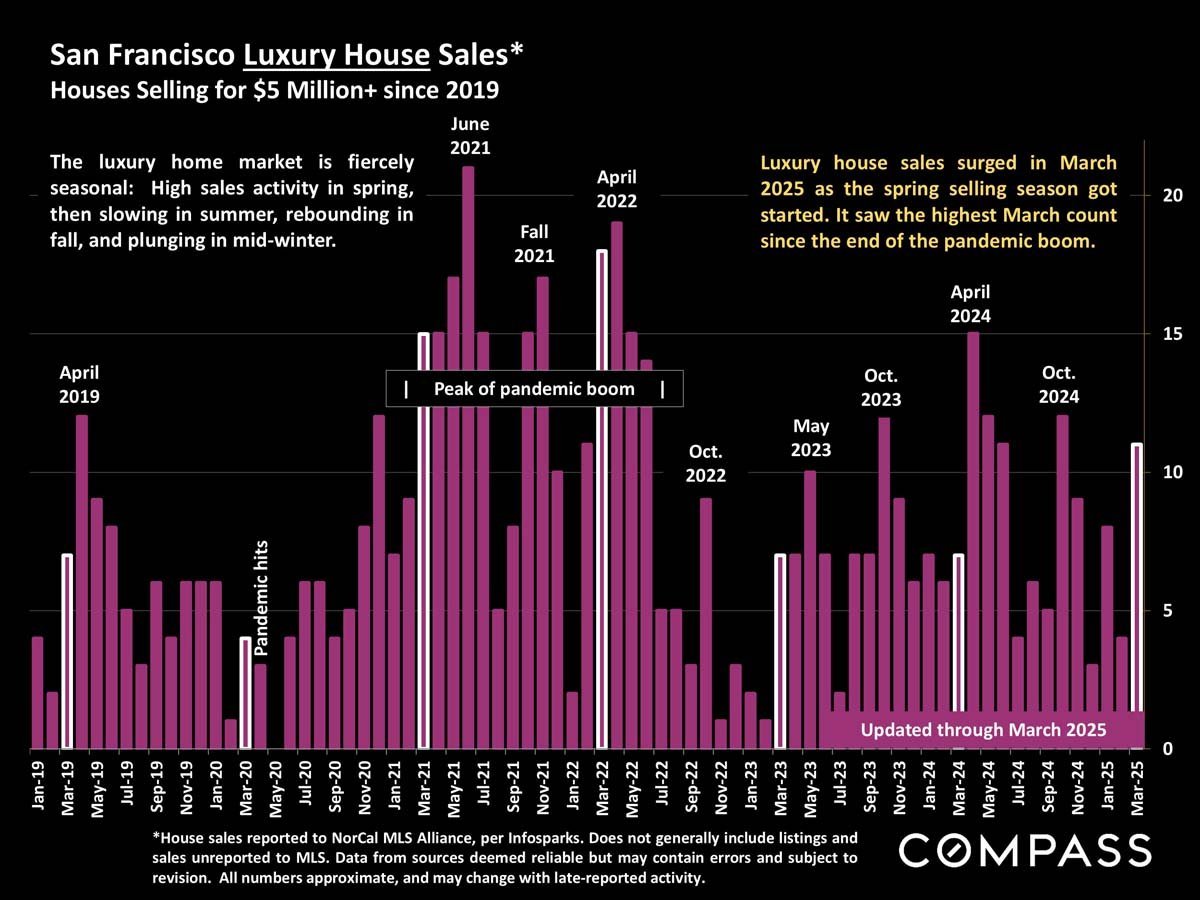
Bar chart of San Francisco luxury home sales of $5 million or more, January 2019–March 2025.
 
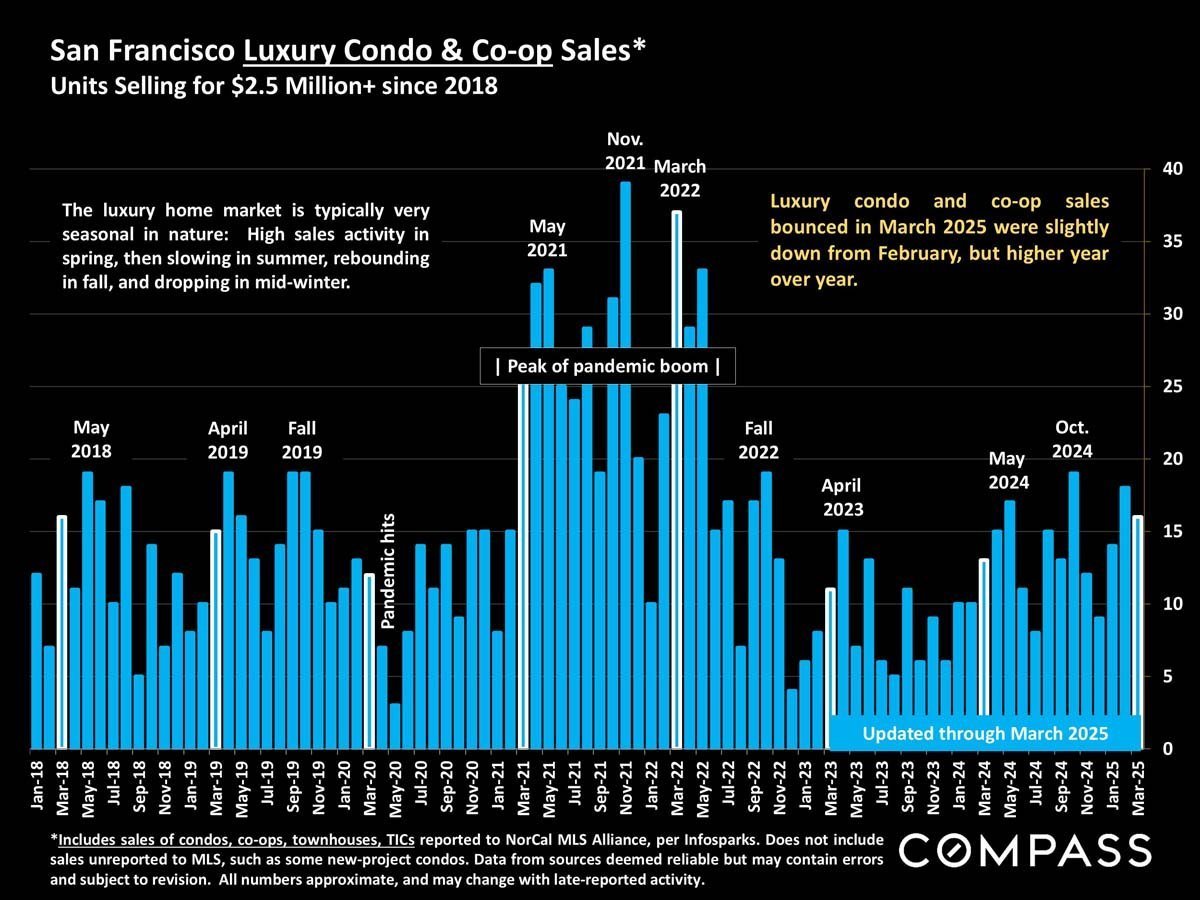
Bar chart of San Francisco luxury condo and co-op sales since 2018, updated through March 2025.
 
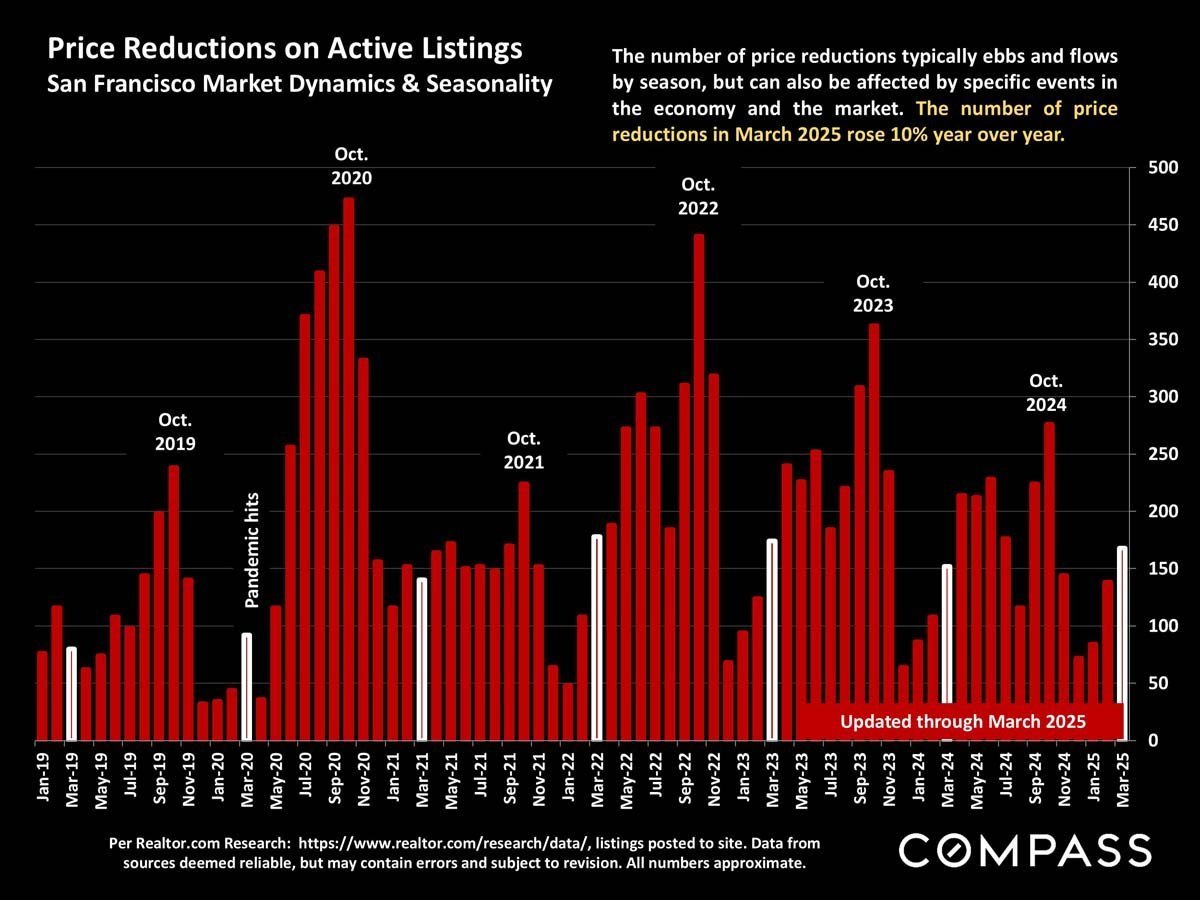
Chart of San Francisco active-listing price reductions from January 2019 through March 2025, with seasonal peaks and a 10% year-over-year increase.
 
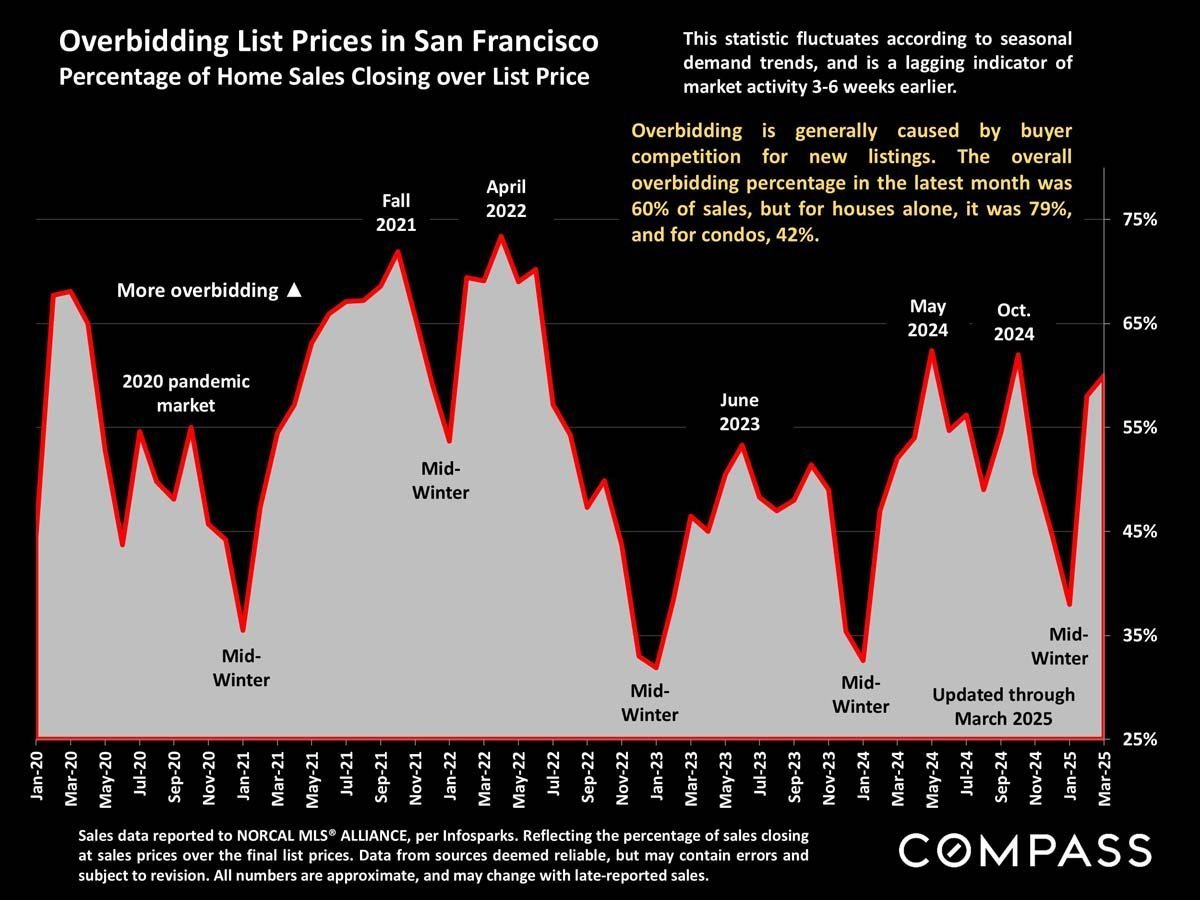
Chart tracking San Francisco home sales closing over list price, with monthly trends from 2020 through March 2025.
 
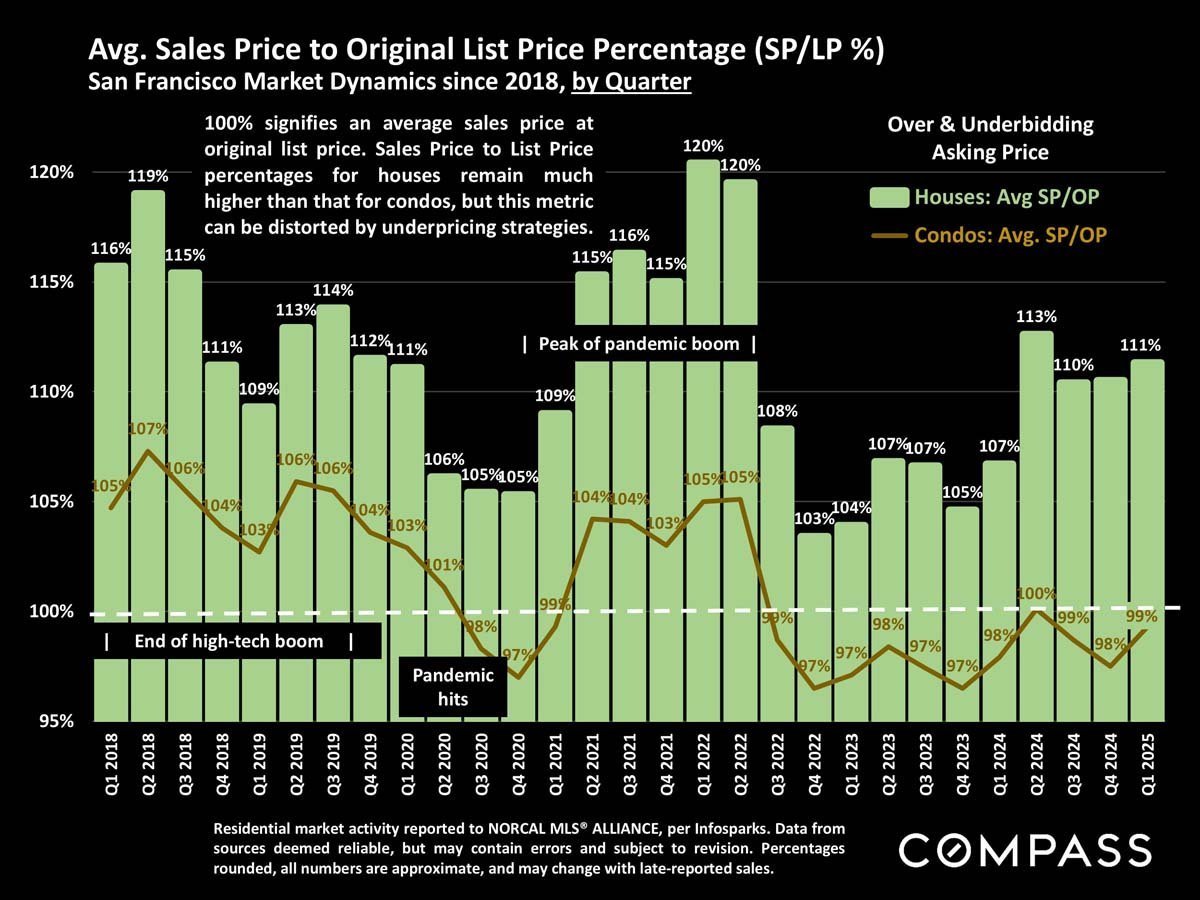
Chart compares San Francisco houses’ and condos’ sale-to-list price percentages by quarter from 2018 through early 2025.
 
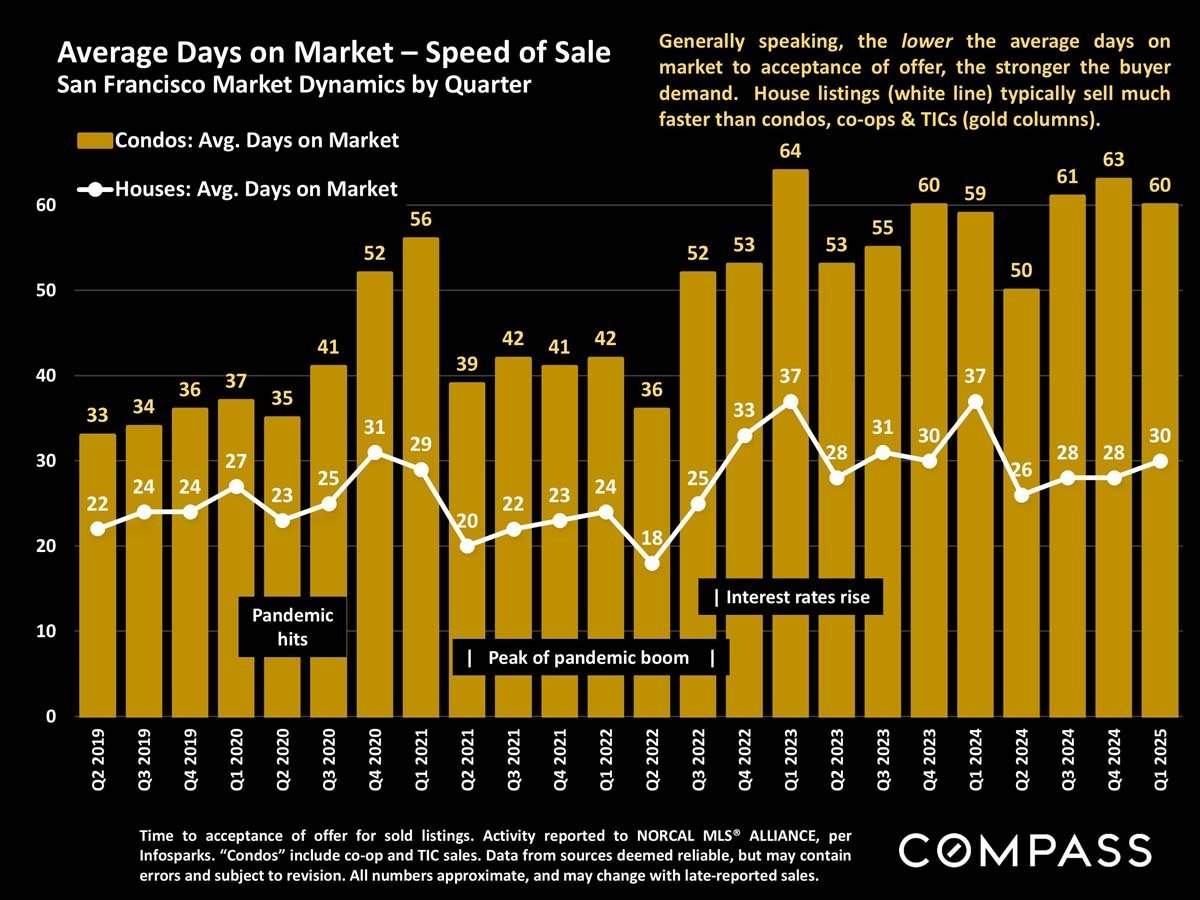
Chart comparing San Francisco quarterly days on market for condos and houses, Q2 2019–Q1 2025.
 
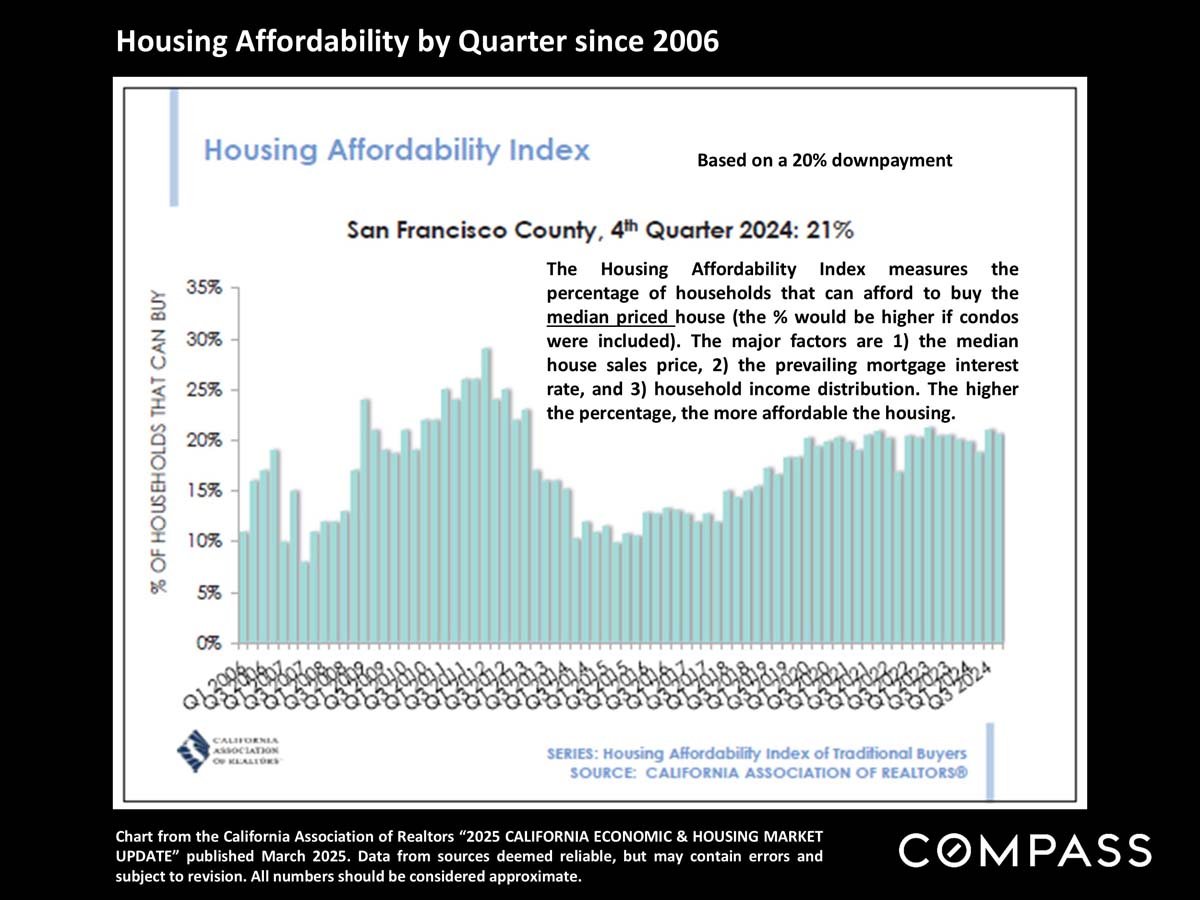
San Francisco County housing affordability chart shows 21% affordability in the fourth quarter of 2024.
 
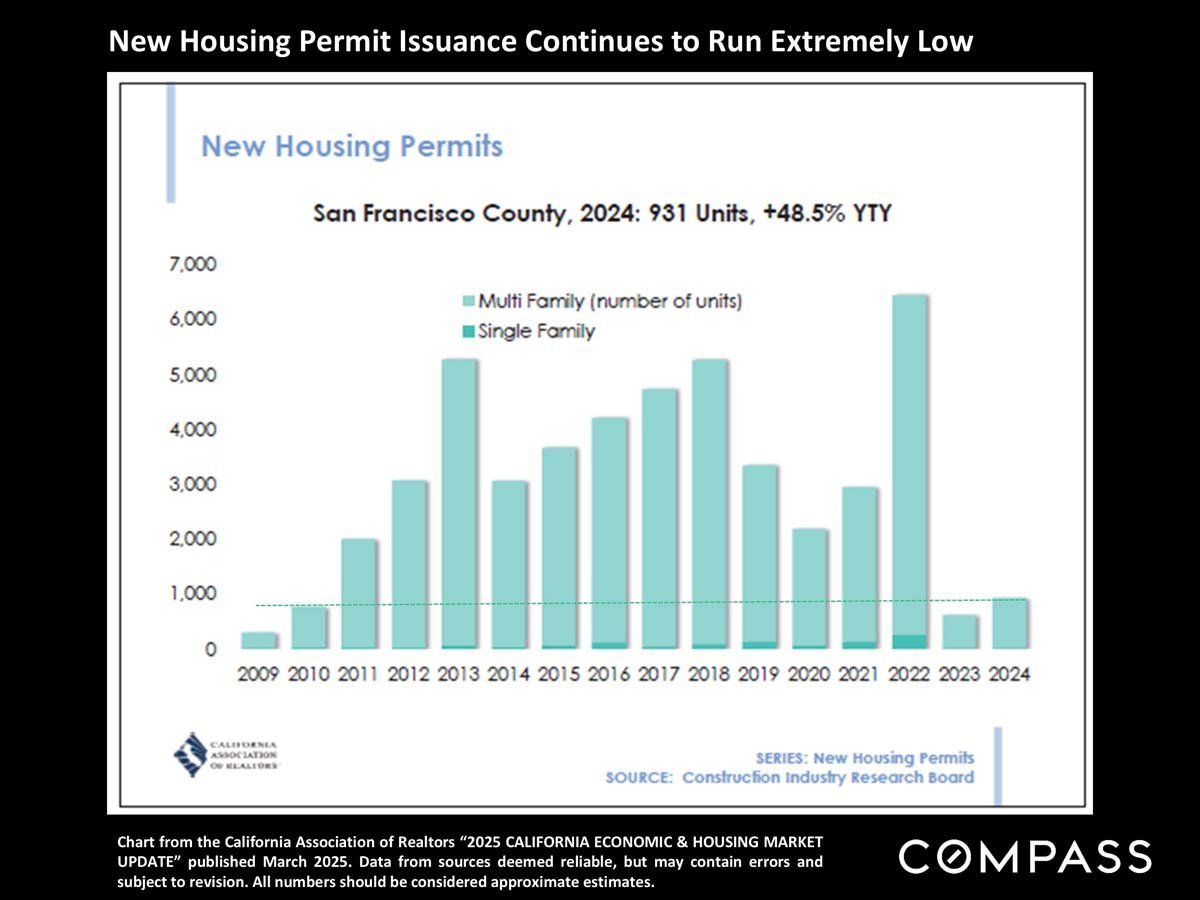
Chart of San Francisco County housing permits from 2009–2024, showing 931 units issued in 2024.
 
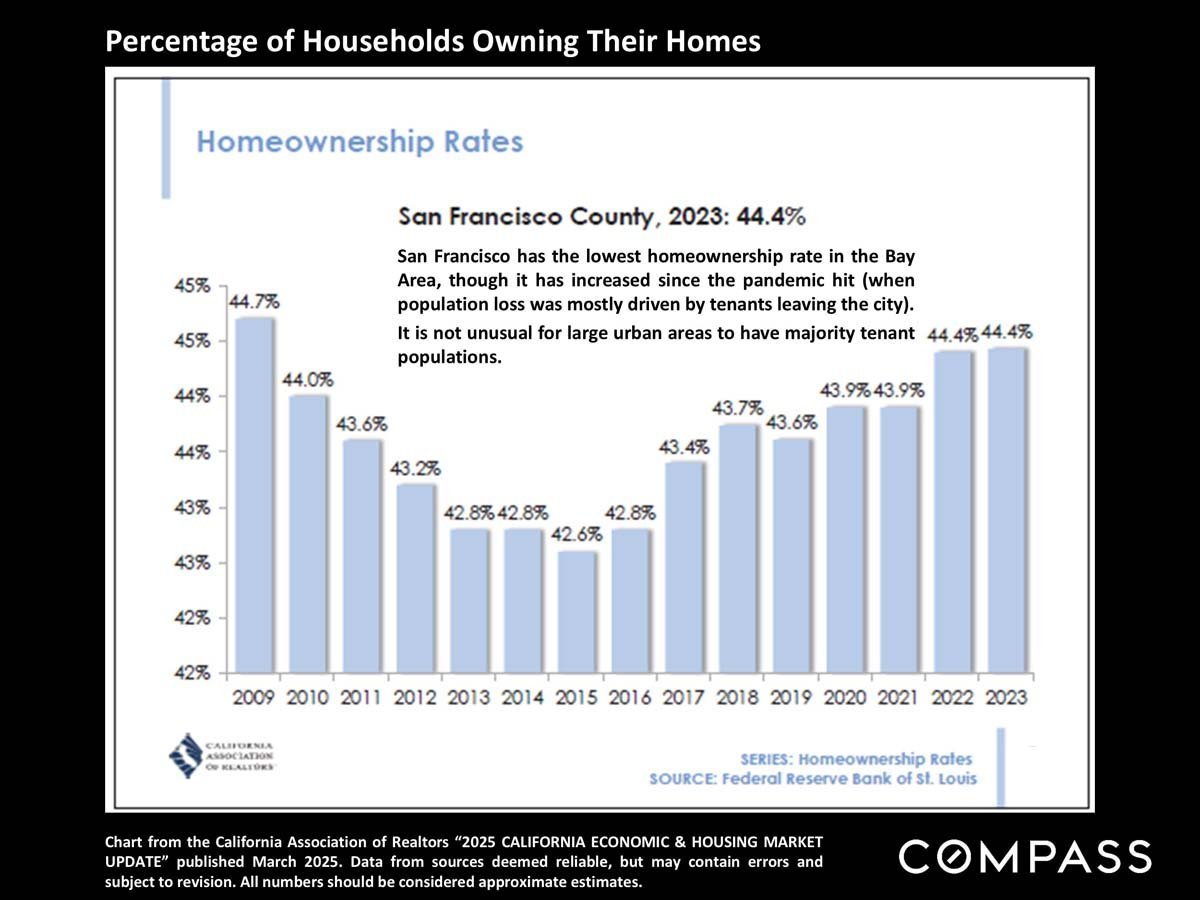
Chart of San Francisco County homeownership rates, falling to 42.6% in 2015 before rising to 44.4% in 2023.
 
Real estate market report disclaimer covering statistics, median prices, square-foot costs, and legal terms.
 
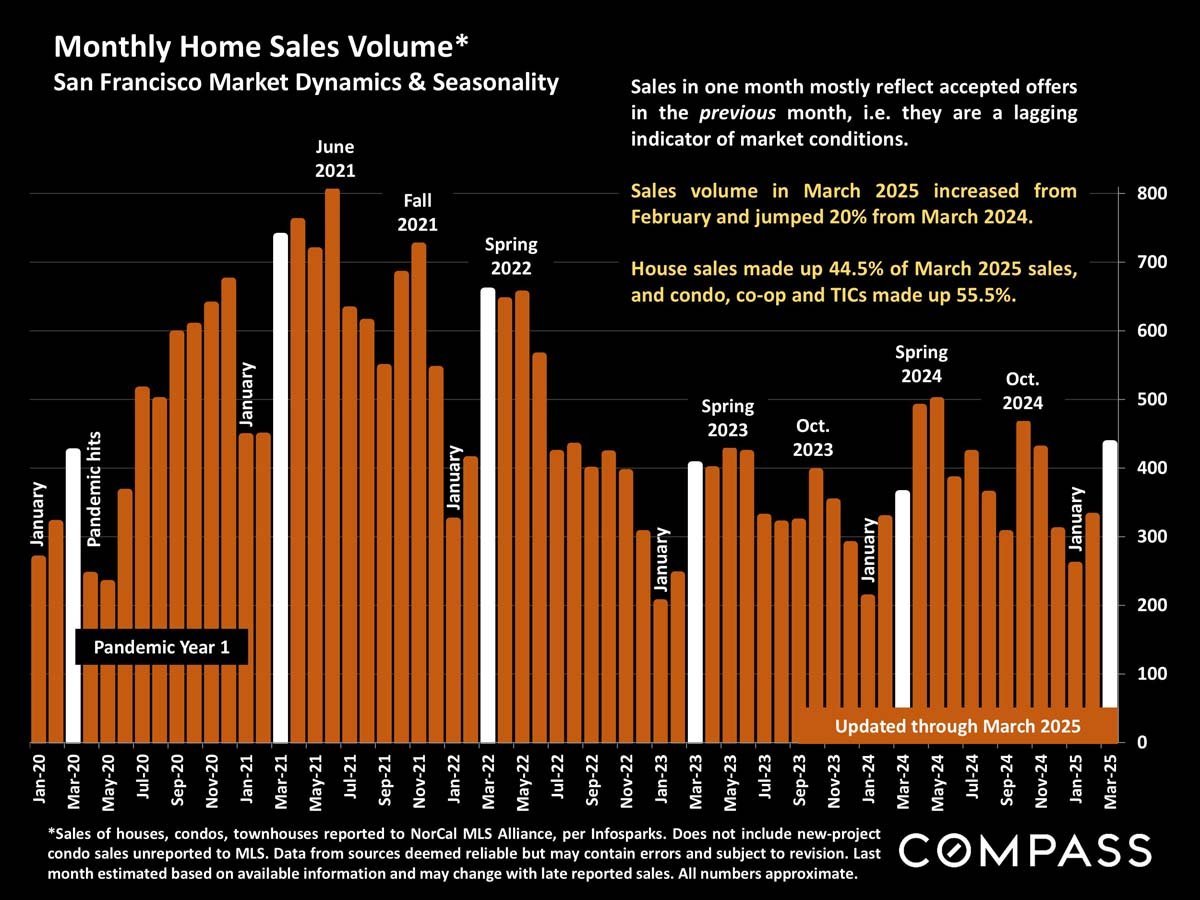
Chart of monthly San Francisco home sales, January 2020–March 2025, with March 2025 sales up 20% year over year.
 
Market statistics limitations, definitions, photo license, and Compass legal disclaimer.

Work With Jane

Get assistance in determining the current property value, crafting a competitive offer, writing and negotiating a contract, and much more. Contact me today.
Follow Me on Instagram