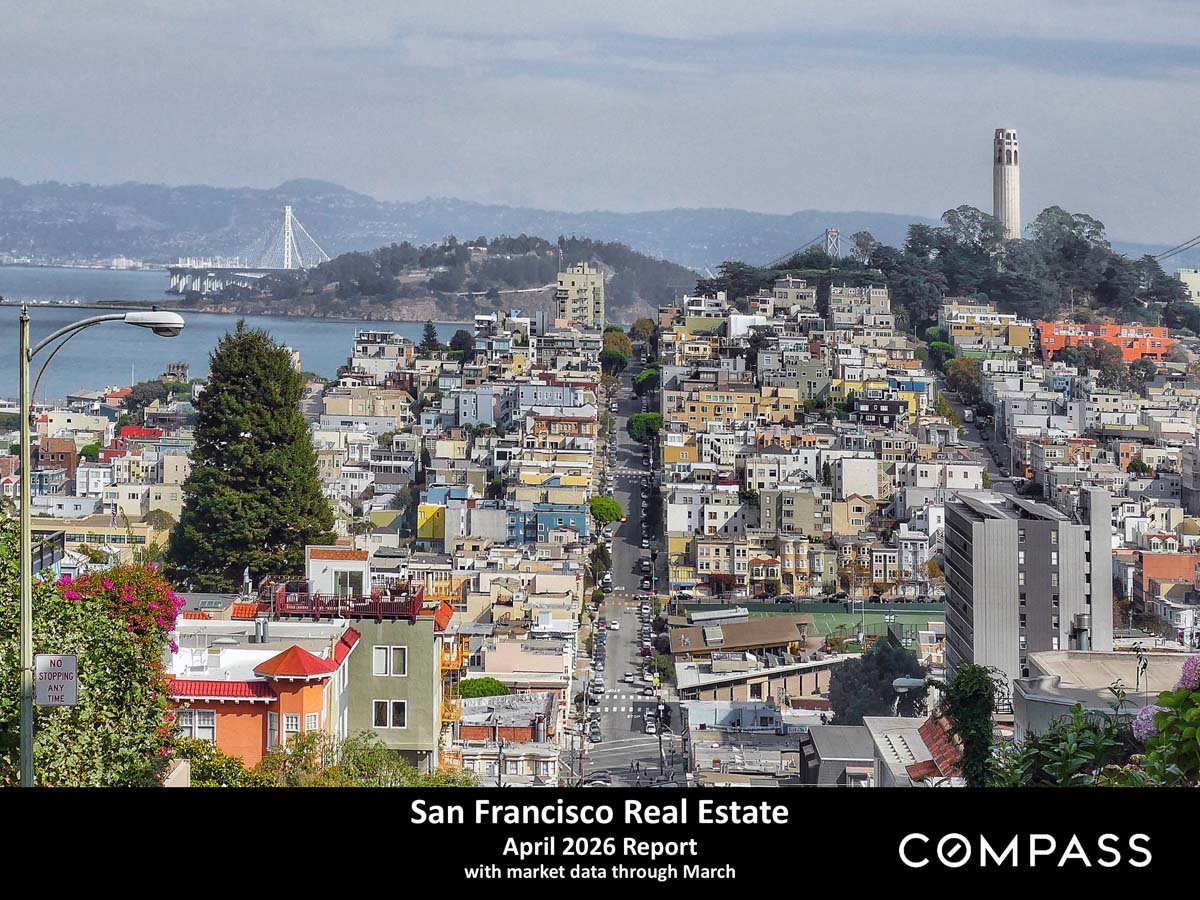
San Francisco Real Estate: April 2026 Report, with market data through March

San Francisco Home Prices, Market Conditions & Trends April 2026

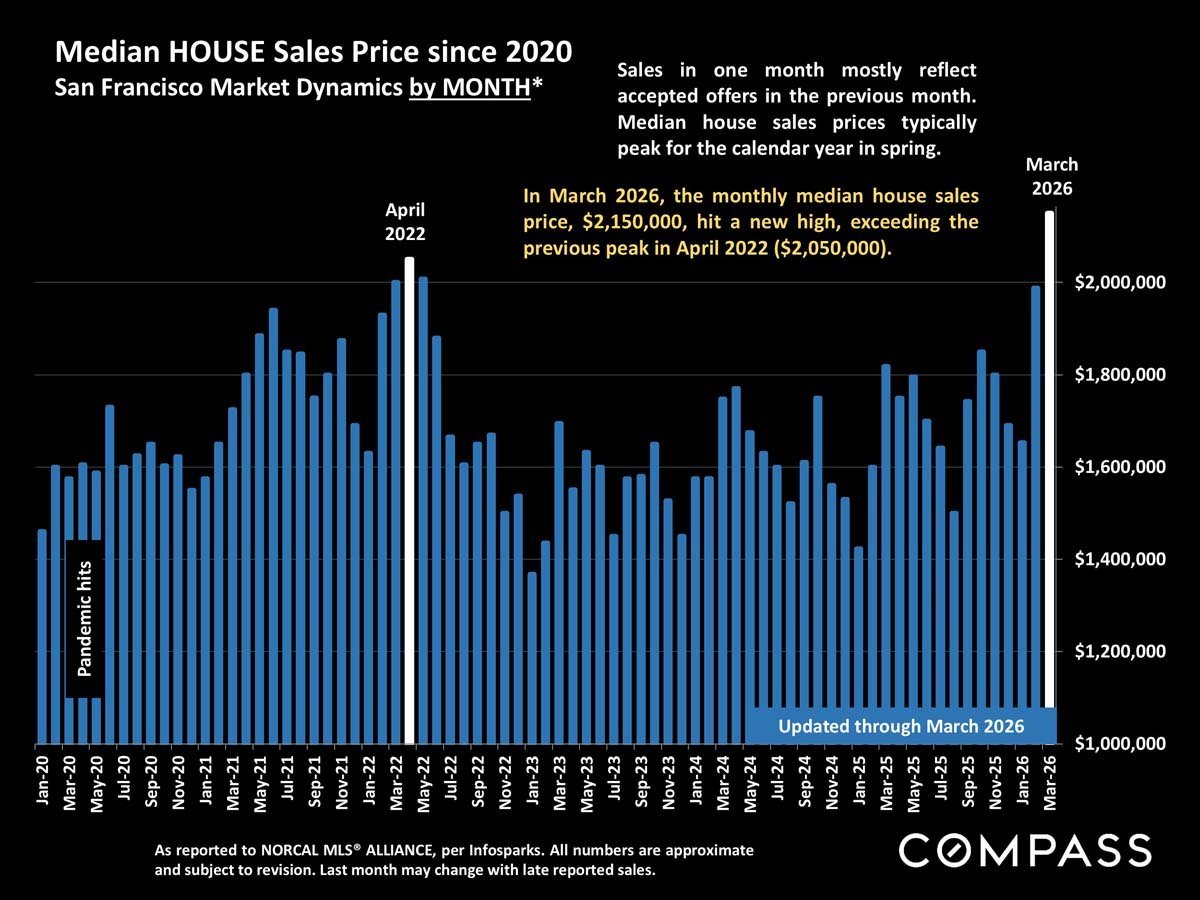
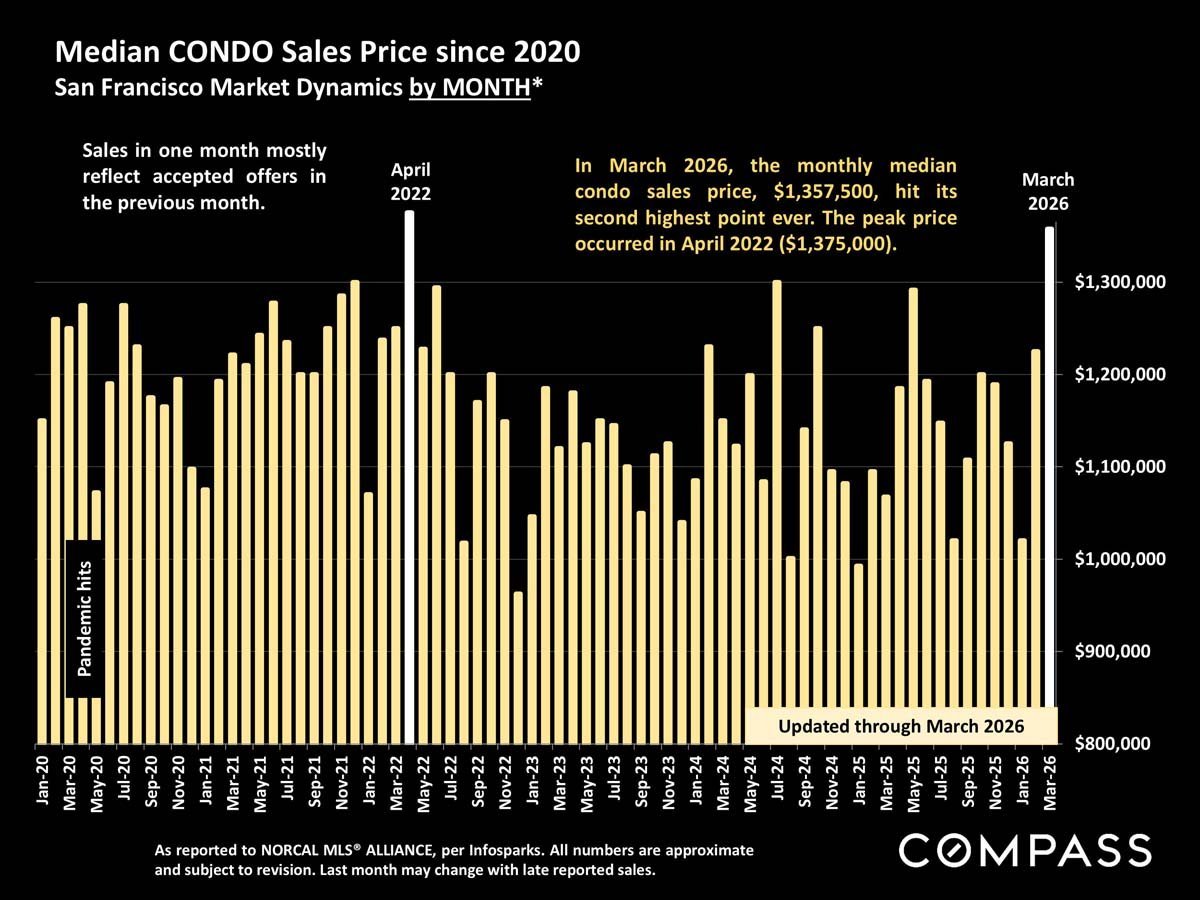
The median HOUSE sales price in March 2026 hit $2,150,000, up 18% year-over-year, exceeding the previous peak of $2,050,000 in April 2022. The median CONDO sales price was $1,357,500, up 27% year-over-year, marking the second-highest monthly price ever after the $1,375,000 peak in April 2022.

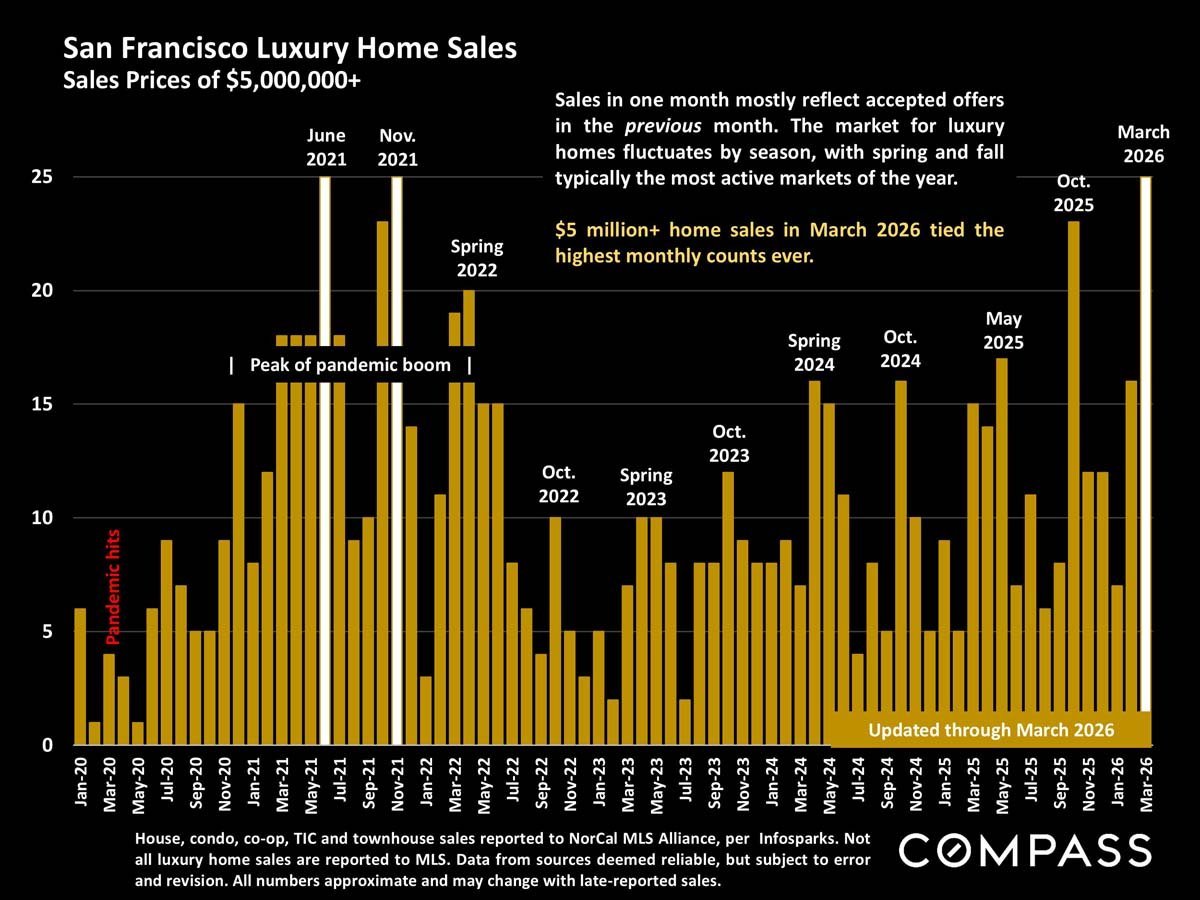
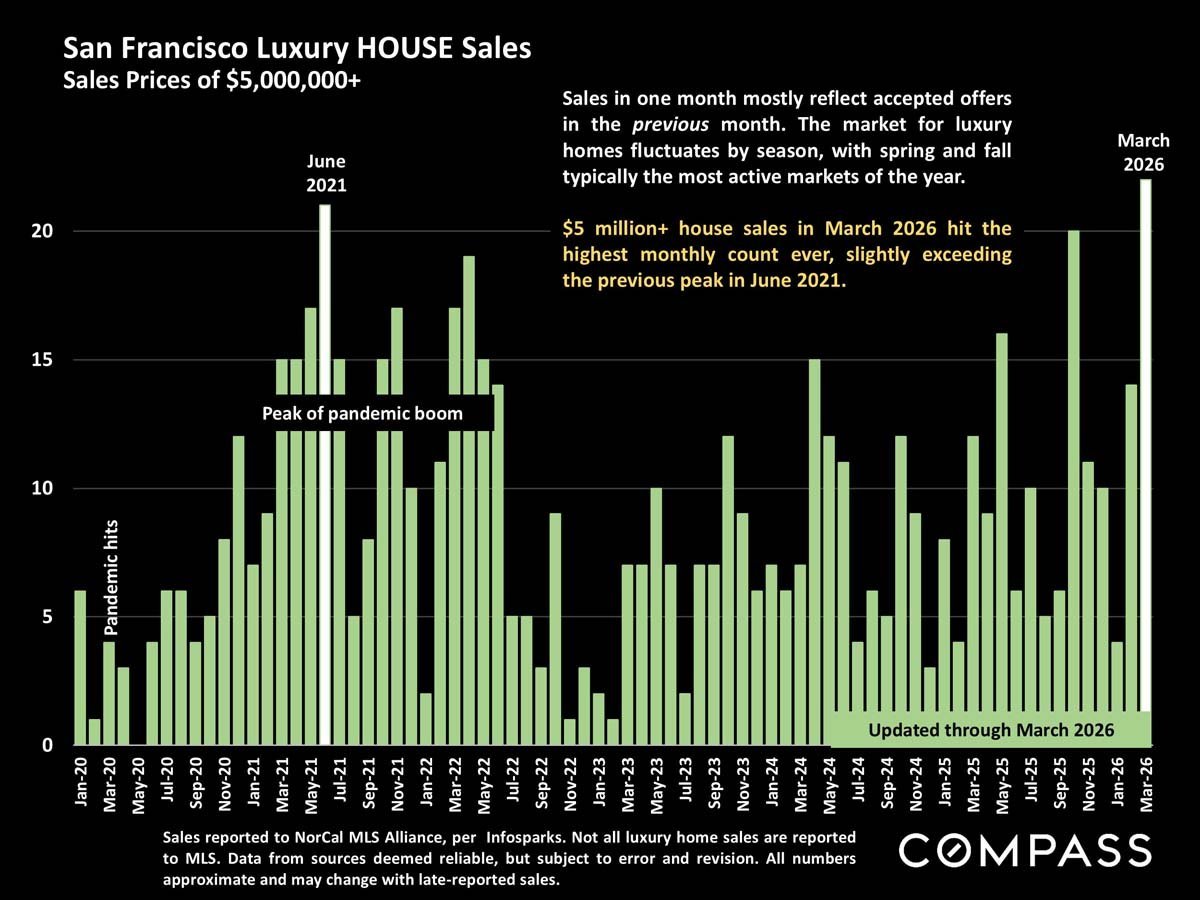
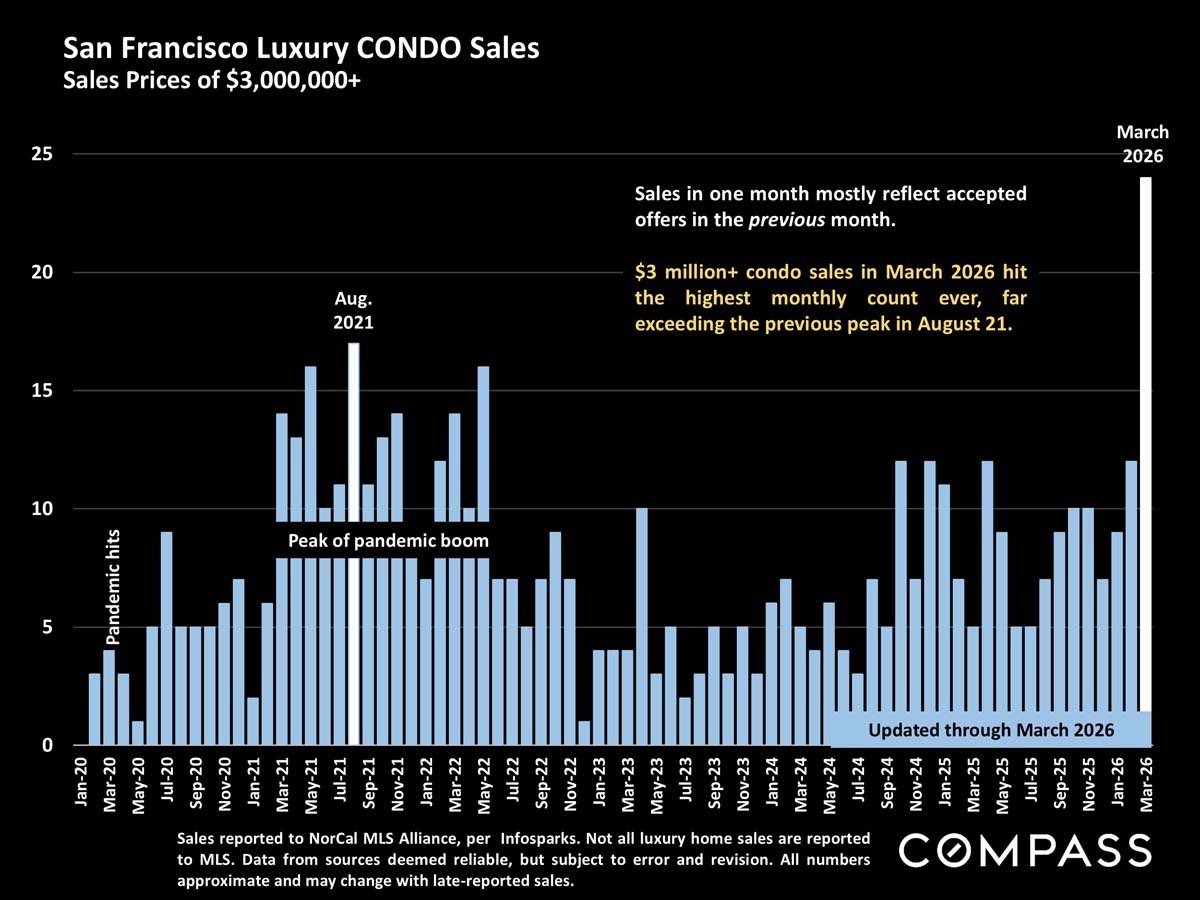
22 luxury HOUSE sales of $5 million+ were reported in March 2026, up 83% year-over- year, surpassing the previous peak of 21 sales in June 2021. 24 luxury CONDO sales of $3 million+ were reported in March, up 380% year-over-year, exceeding the previous high of 17 sales in August 2021.

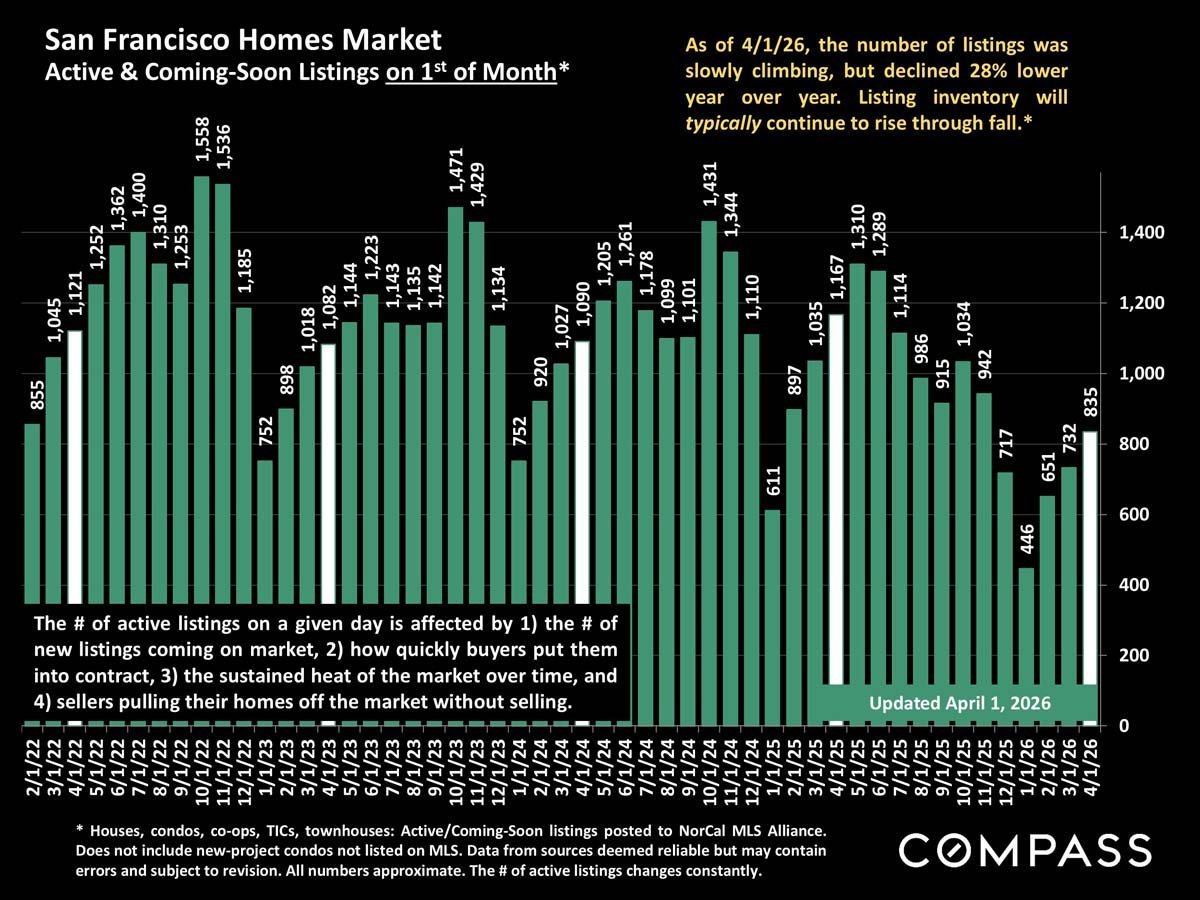
The number of homes listed for sale fell 28% year over year. The inadequate supply of listings – especially of houses – compared to soaring demand continues to pressurize the market as buyers compete furiously for scarce listings.

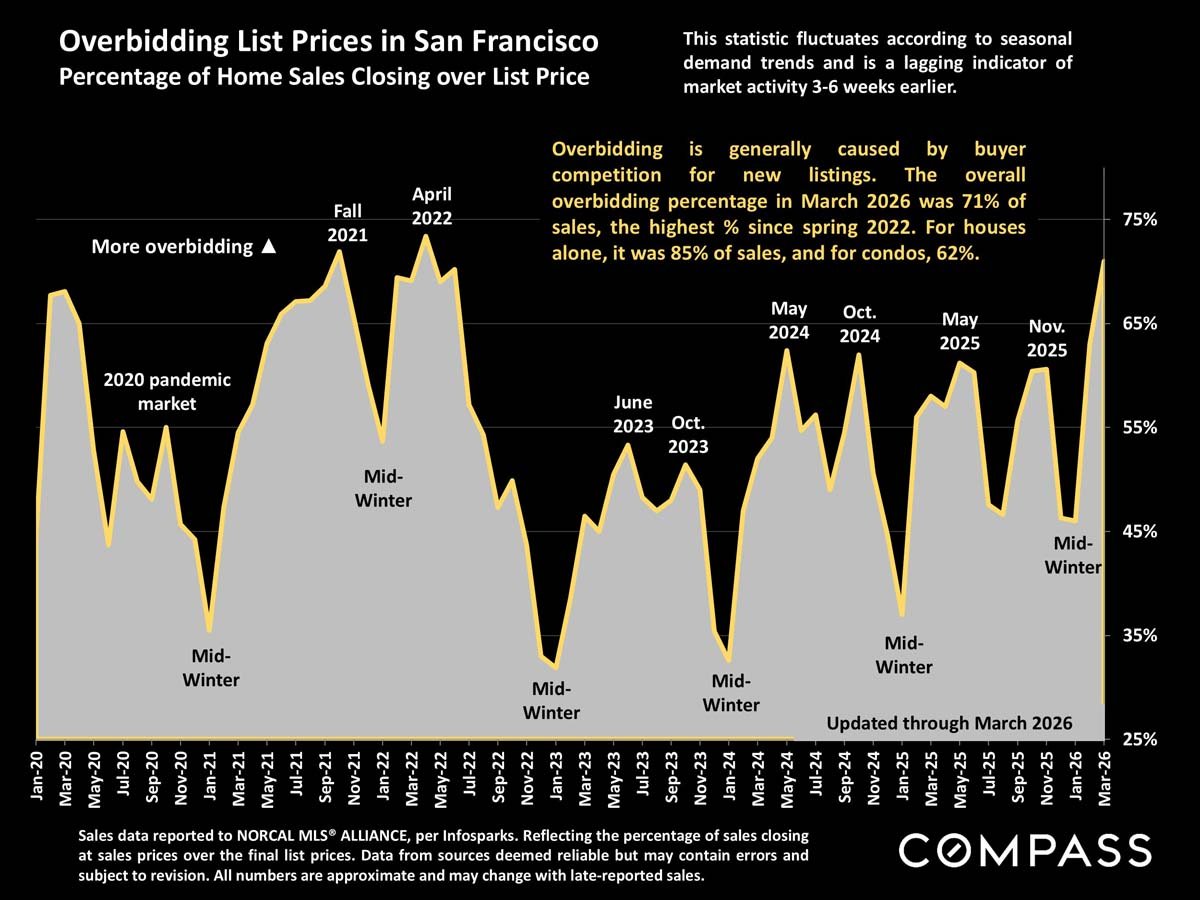
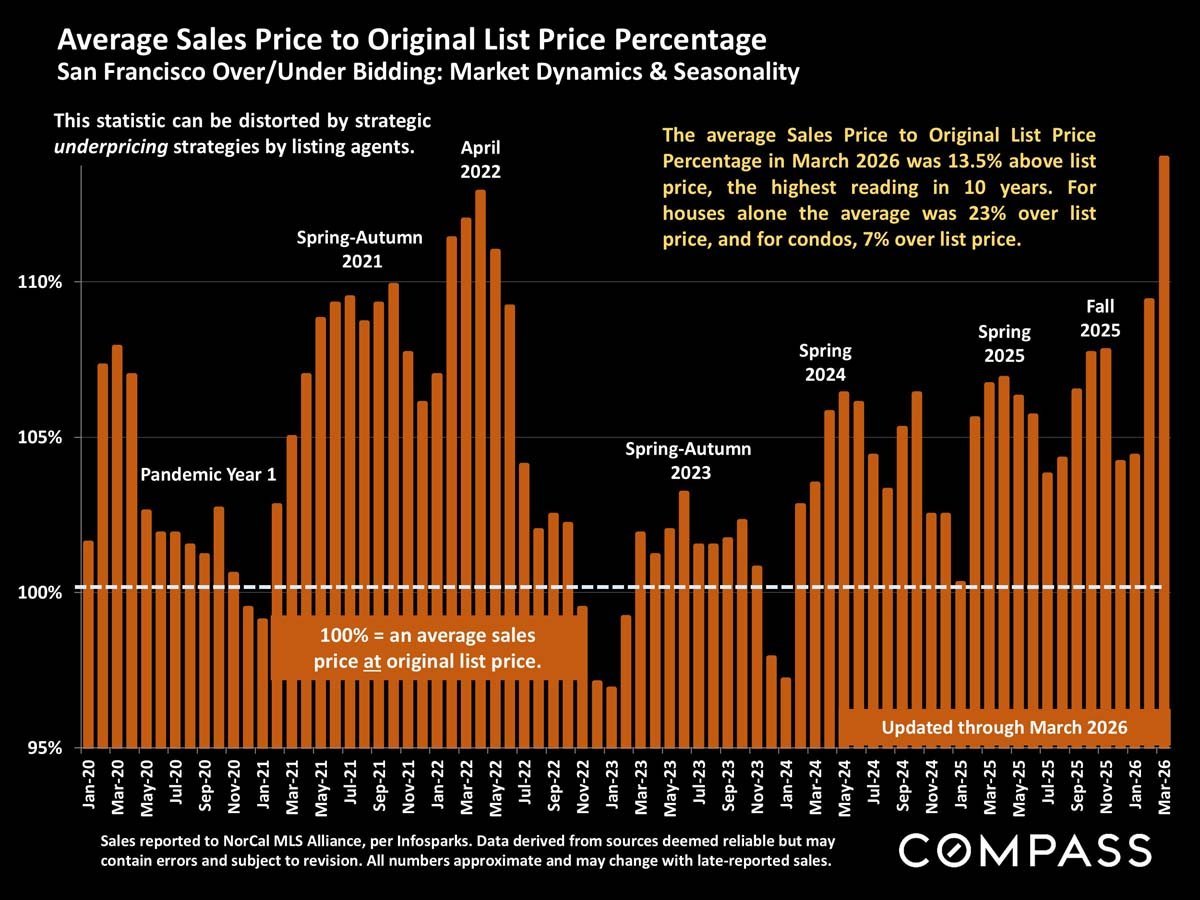
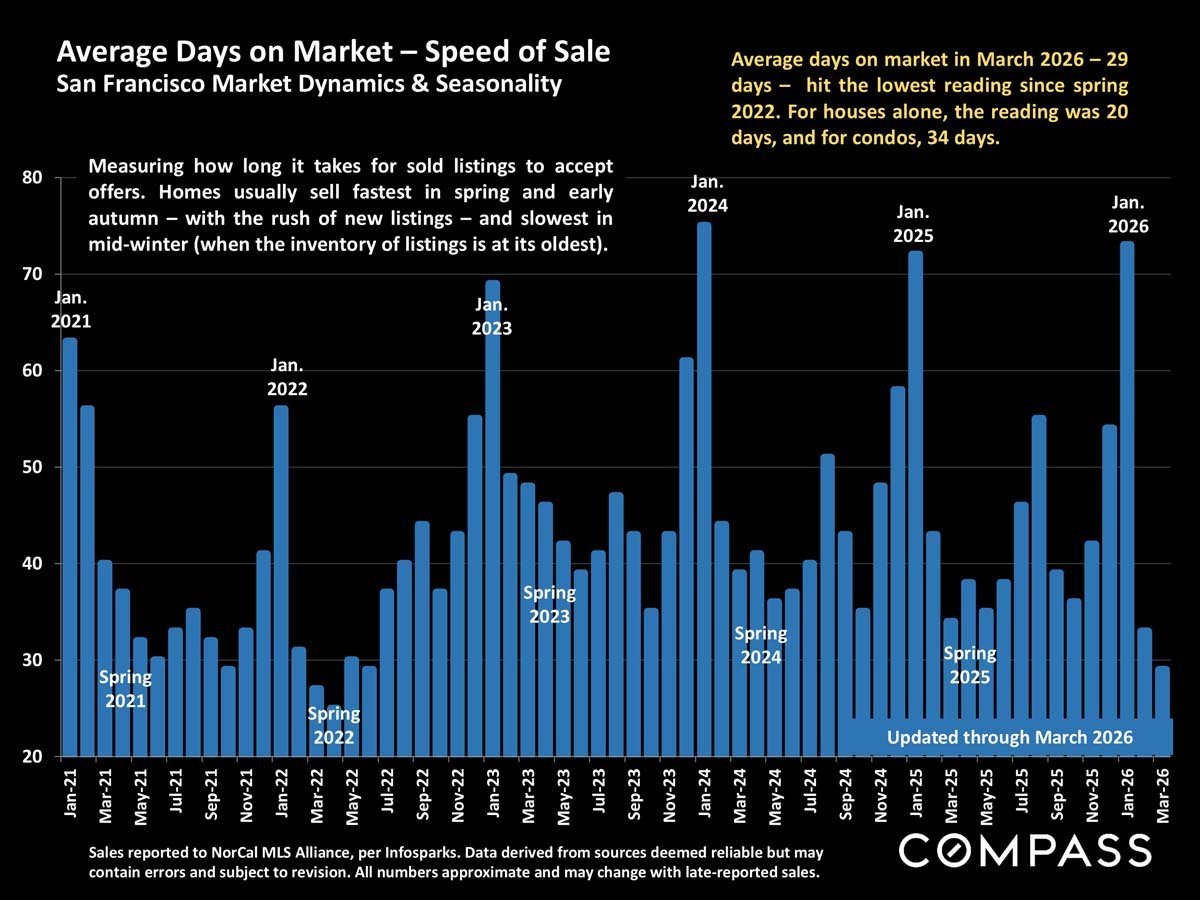
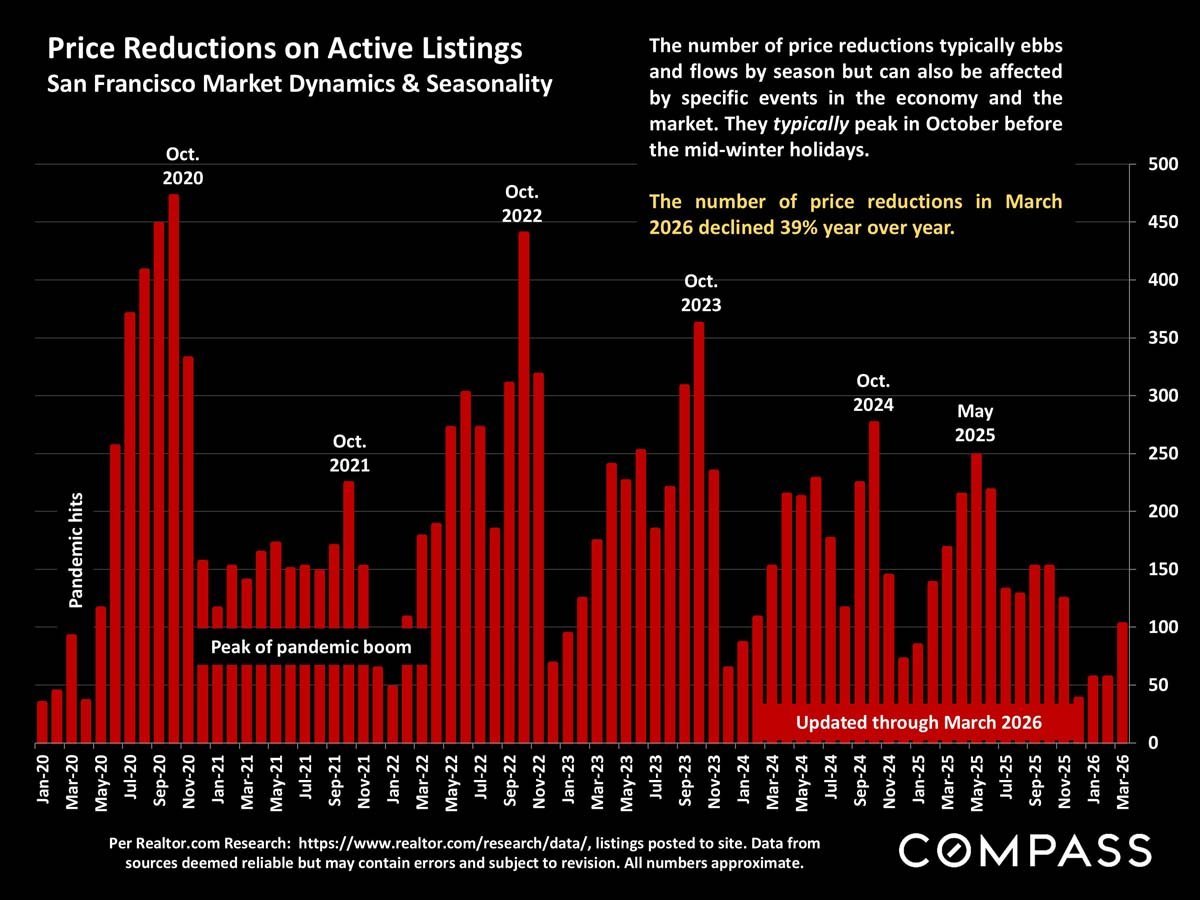
85% of house sales sold over list price with an average sale price 23% over list price, tied with April 2022 for highest overbid percentage ever. 62% of condo sales sold over list price with an average sale price 7% over list price, the highest overbid % since 2019. The average days on market to acceptance of offer was 29 days in March 2026, the fastest rate of sale since spring 2022. Price reductions fell 39% from March 2025.
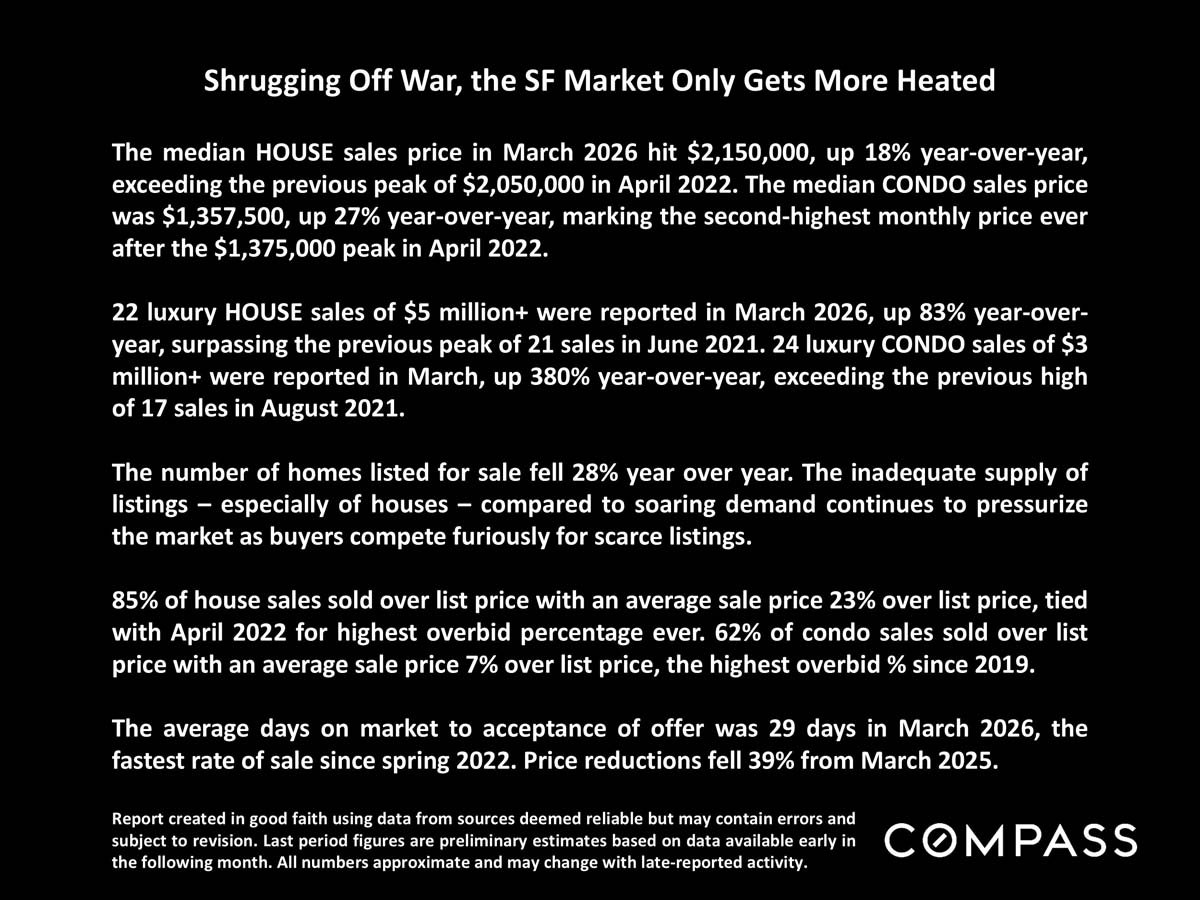
San Francisco March 2026 housing market infographic with home prices, luxury sales, inventory, bidding, and market speed statistics.
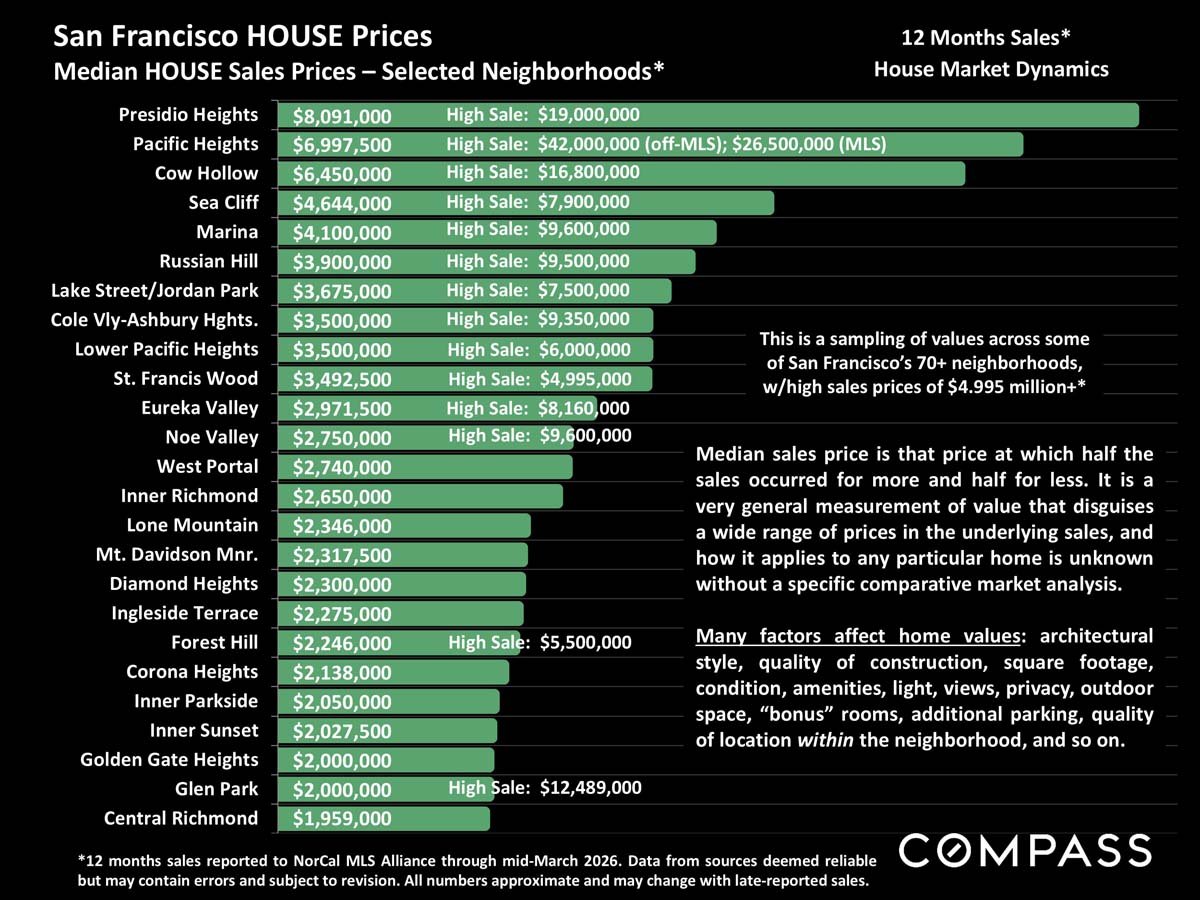
San Francisco neighborhood house prices chart with green bars, median sale prices, and selected high sales.
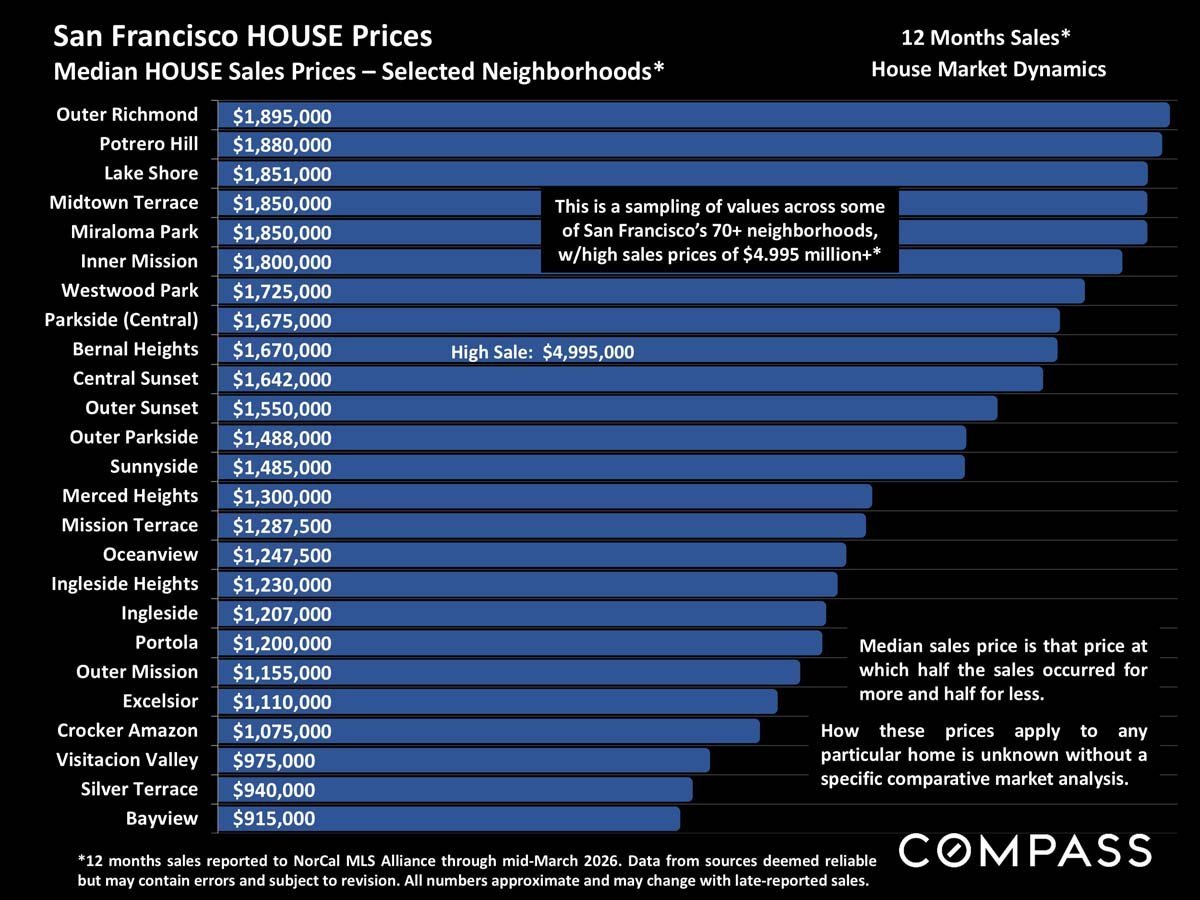
Chart of median San Francisco house prices by neighborhood, from $1.895 million in Outer Richmond to $915,000 in Bayview.
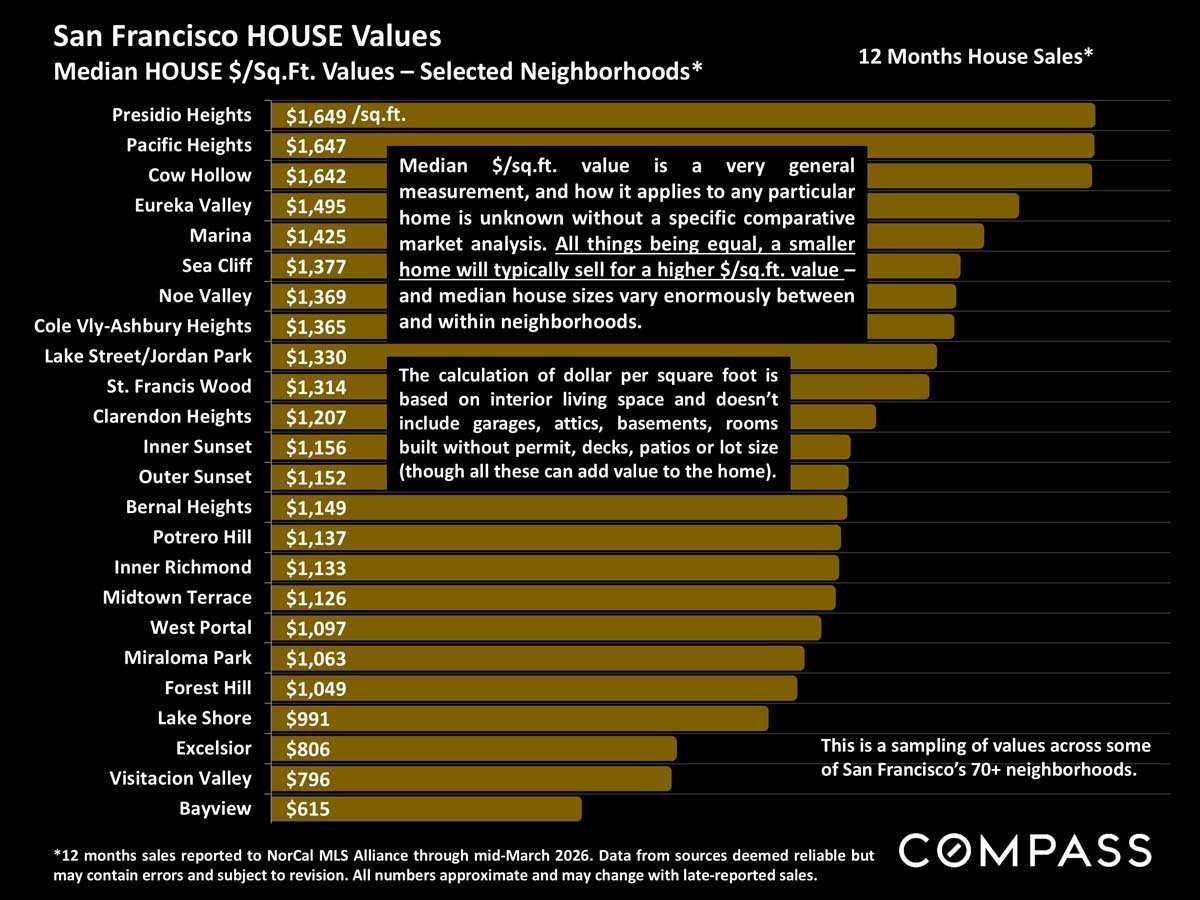
Chart of median house price per square foot in selected San Francisco neighborhoods, led by Presidio Heights.
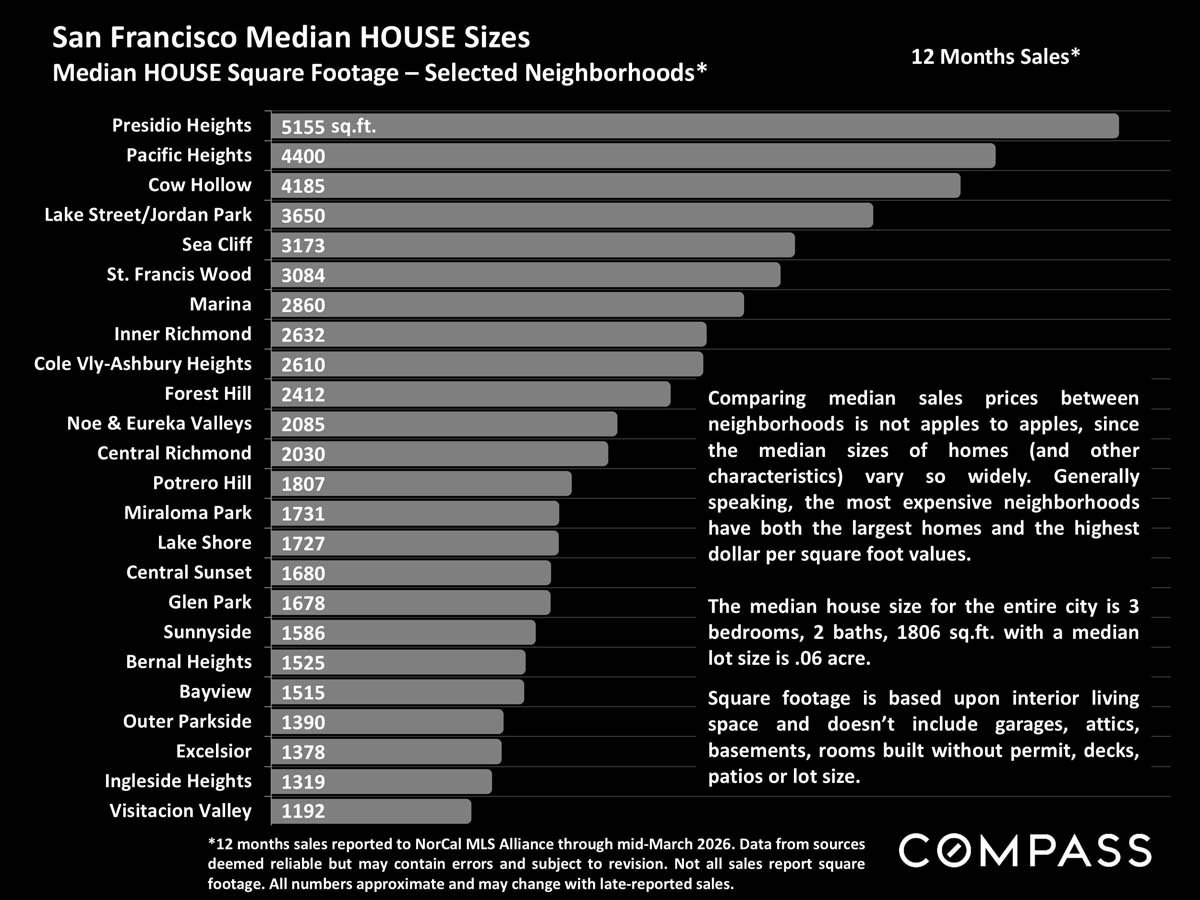
Bar chart comparing median house square footage across San Francisco neighborhoods, from Presidio Heights to Visitacion Valley.
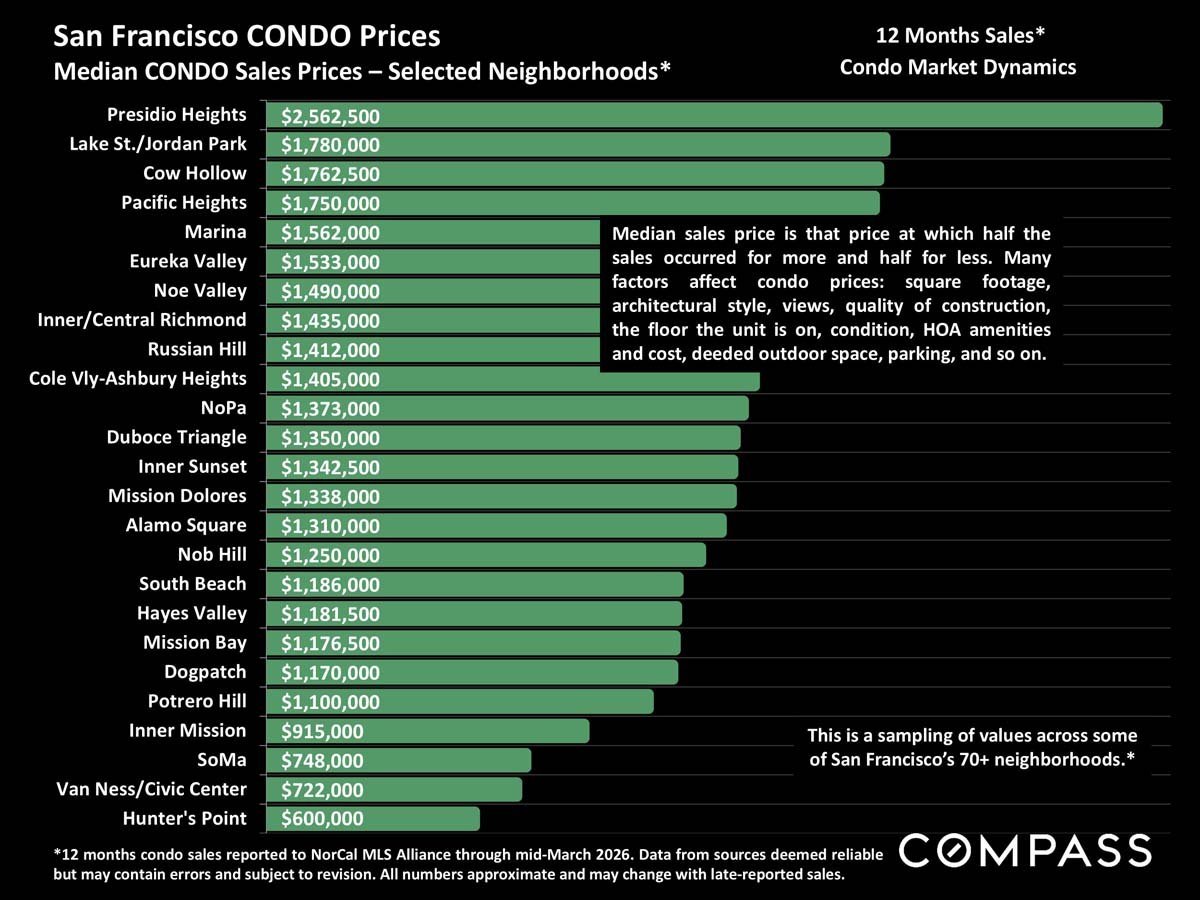
Bar chart comparing median condo sale prices across selected San Francisco neighborhoods, from Presidio Heights to Hunter's Point.
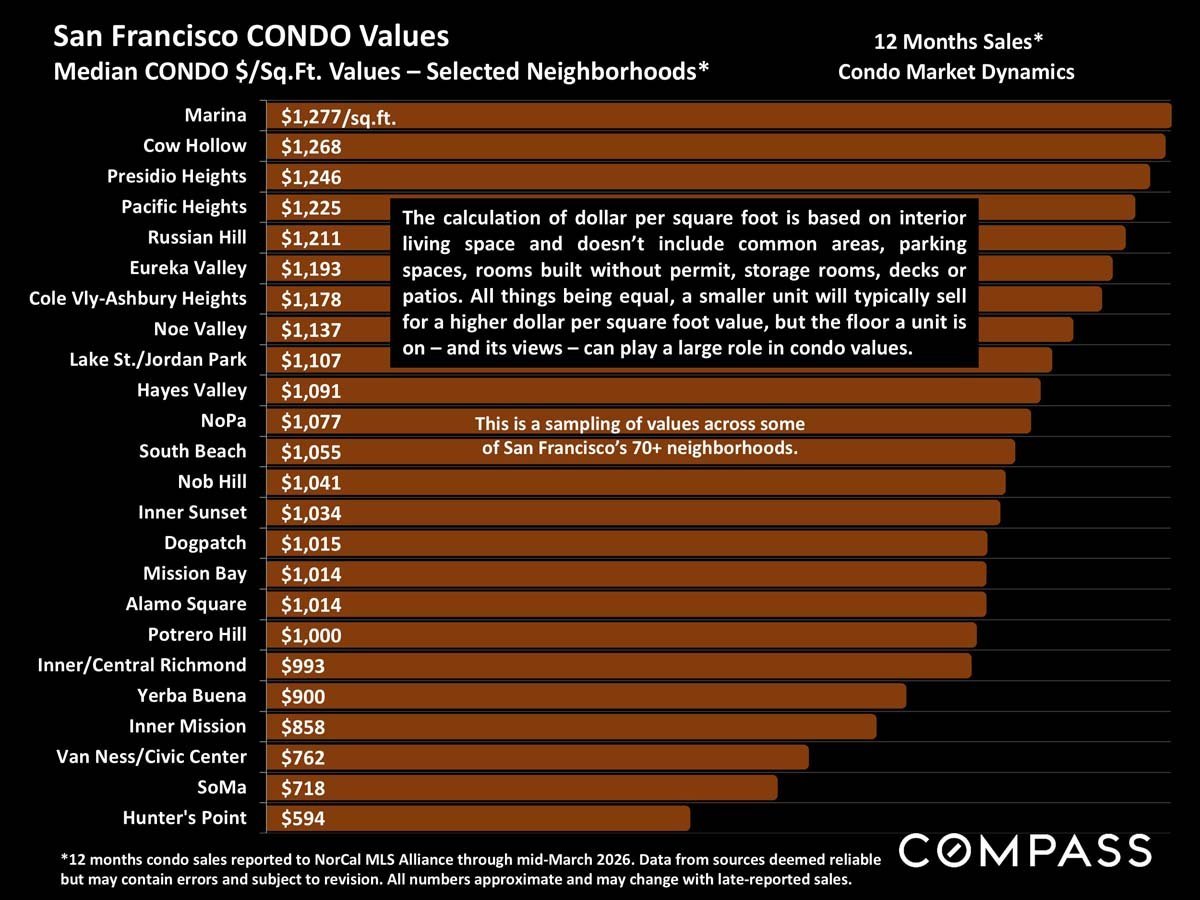
Bar chart comparing median condo prices per square foot across selected San Francisco neighborhoods.
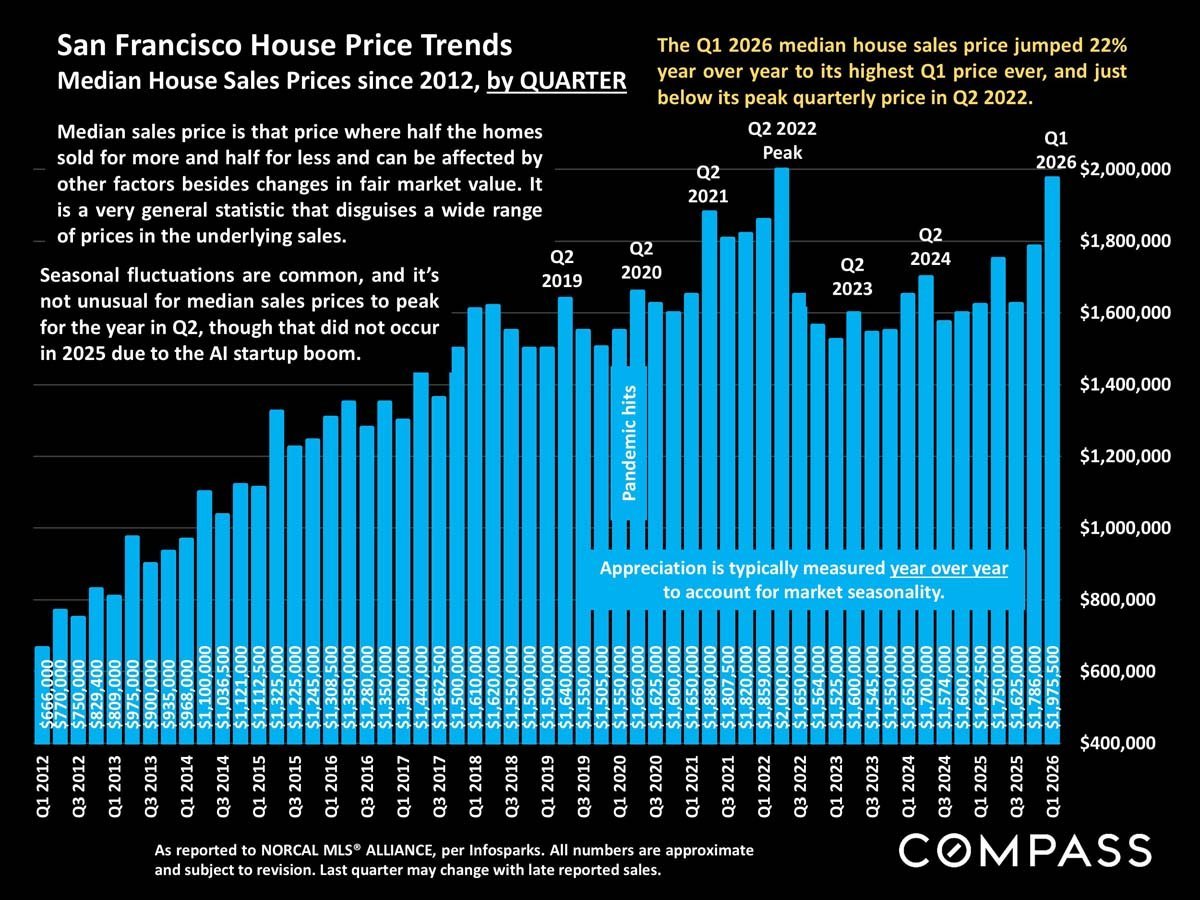
Chart of San Francisco quarterly median house prices from 2012 to Q1 2026, highlighting the 22% year-over-year increase.
Chart of San Francisco monthly median house sale prices, highlighting the March 2026 record of $2.15 million.
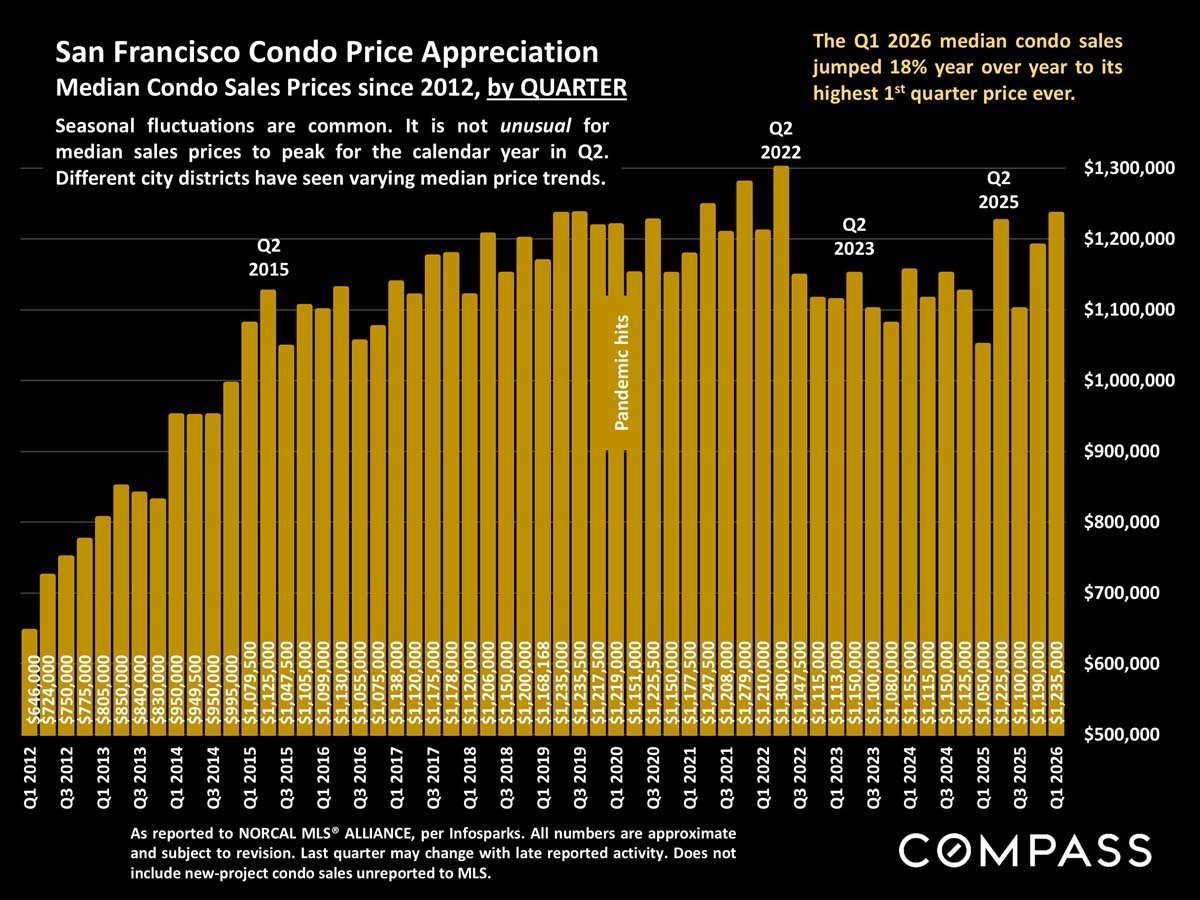
Chart of San Francisco quarterly median condo prices from 2012 to 2026, with Q1 2026 up 18% year over year.
Chart of San Francisco median condo sale prices, January 2020–March 2026; March 2026 median was $1,357,500.
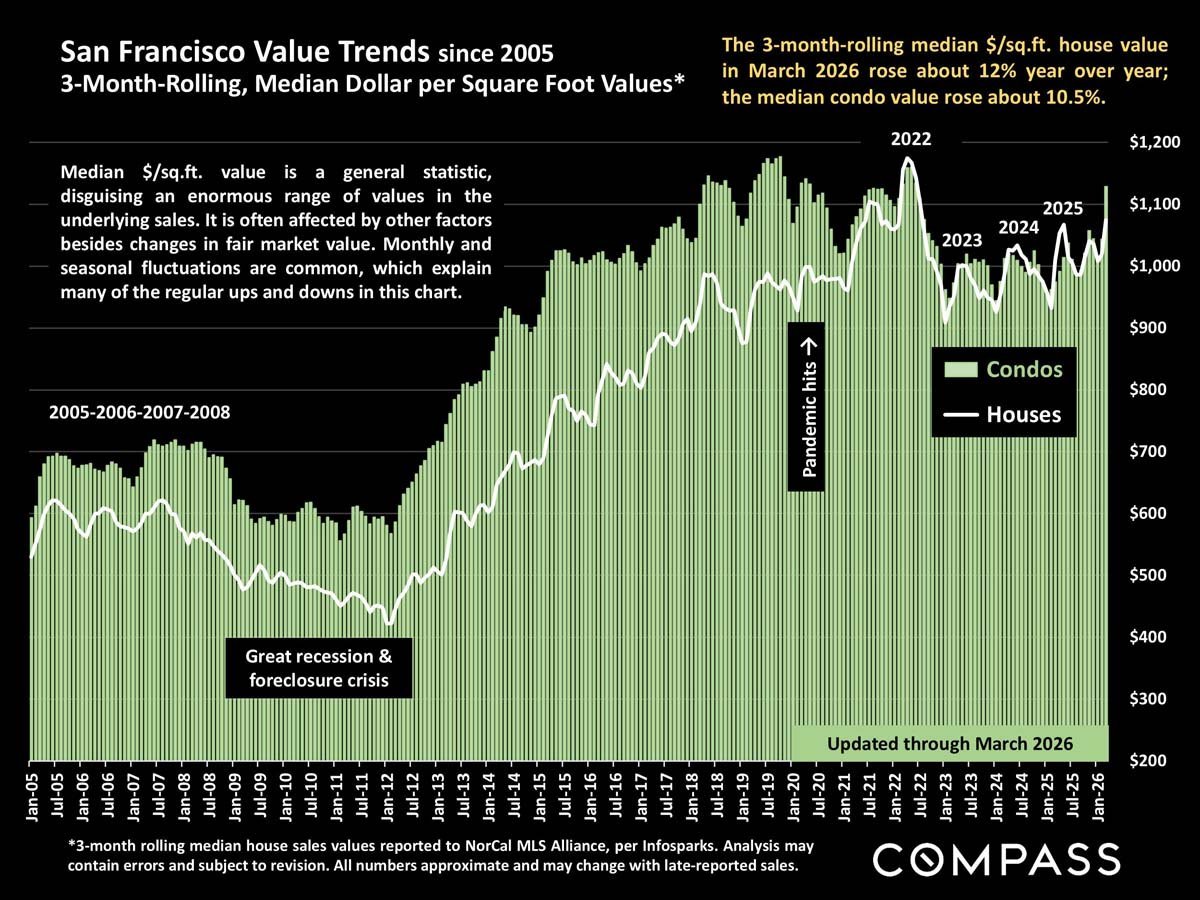
San Francisco home value chart, 2005–2026, with condo bars and a house-value line.
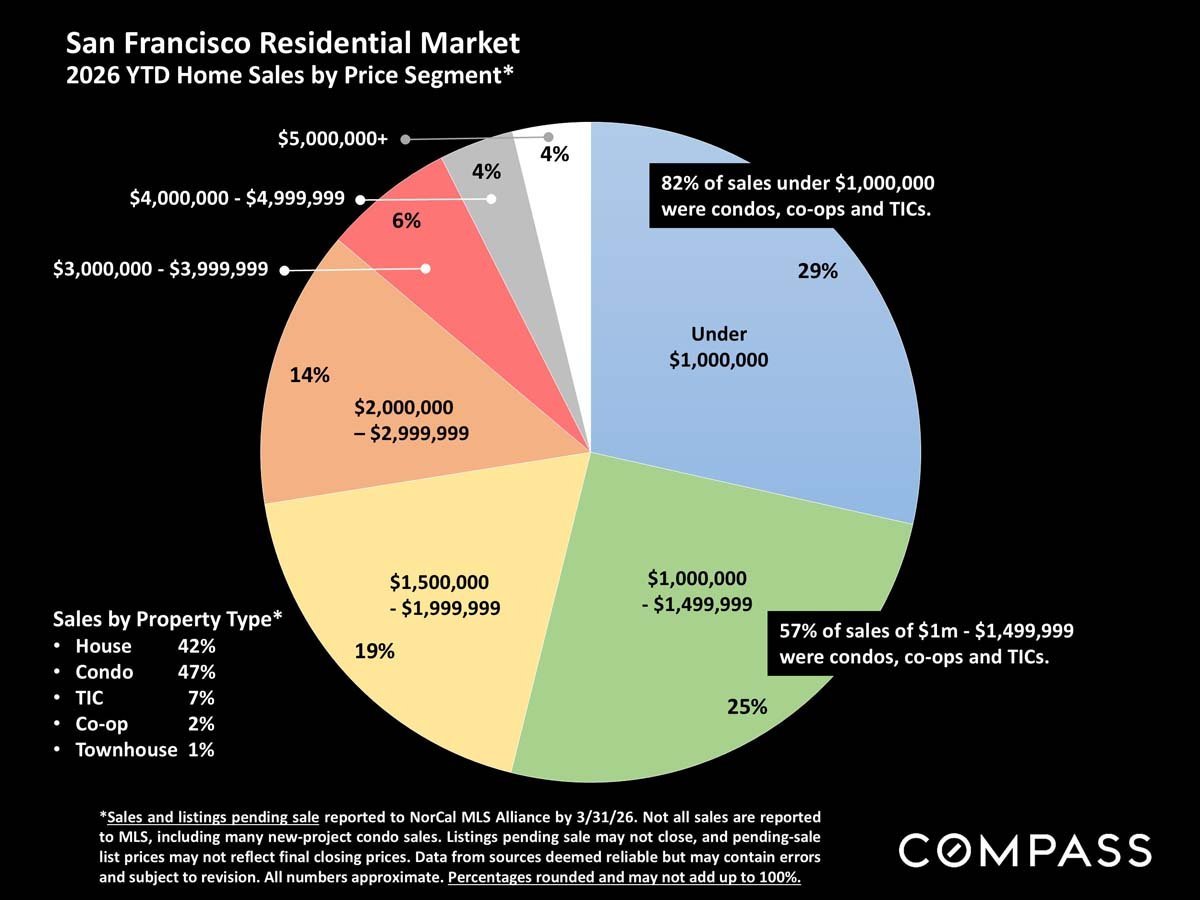
San Francisco 2026 home sales by price segment, with property-type shares and condo/co-op/TIC notes.
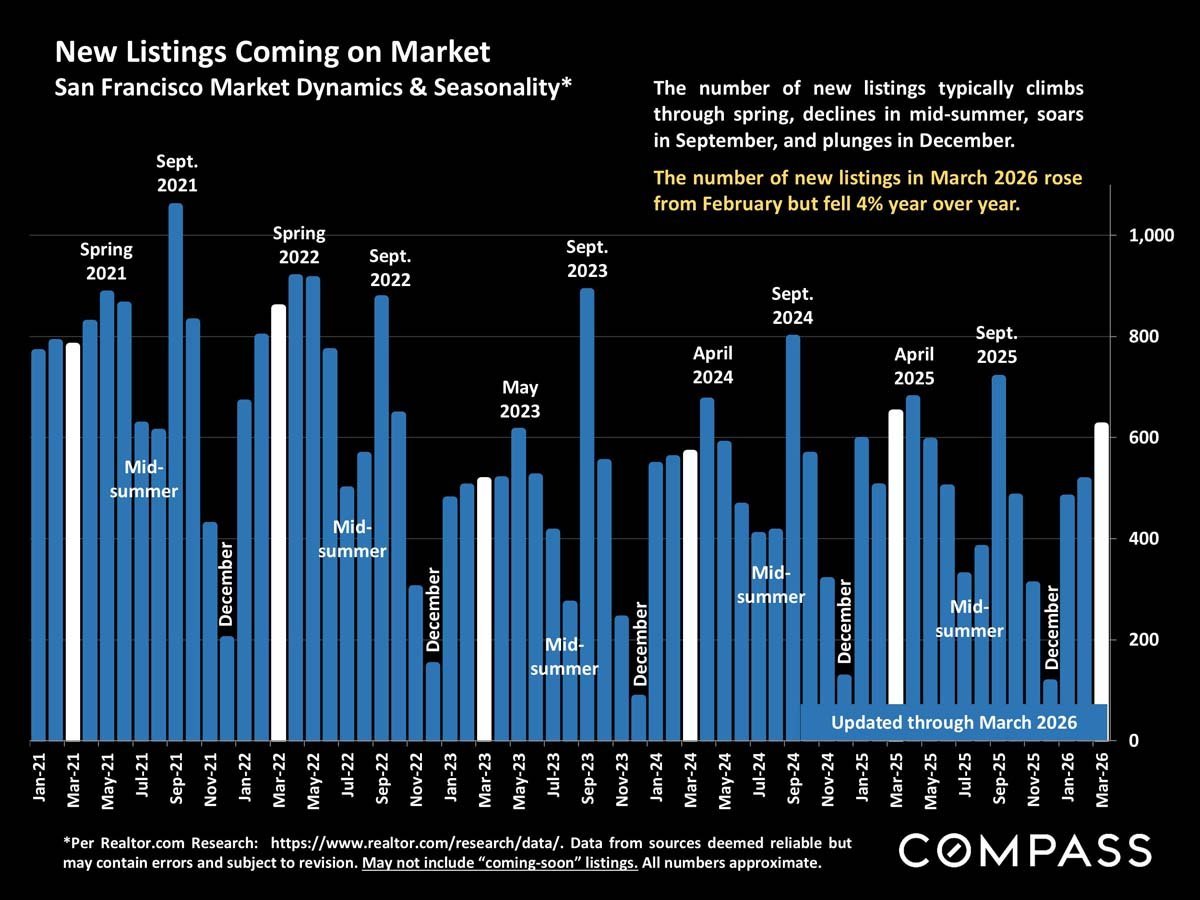
San Francisco new-listings chart, January 2021–March 2026, highlighting seasonal patterns and a 4% year-over-year March decline.
Bar chart of San Francisco active and coming-soon listings by month, January 2022 to April 2026, with a 28% year-over-year decline.
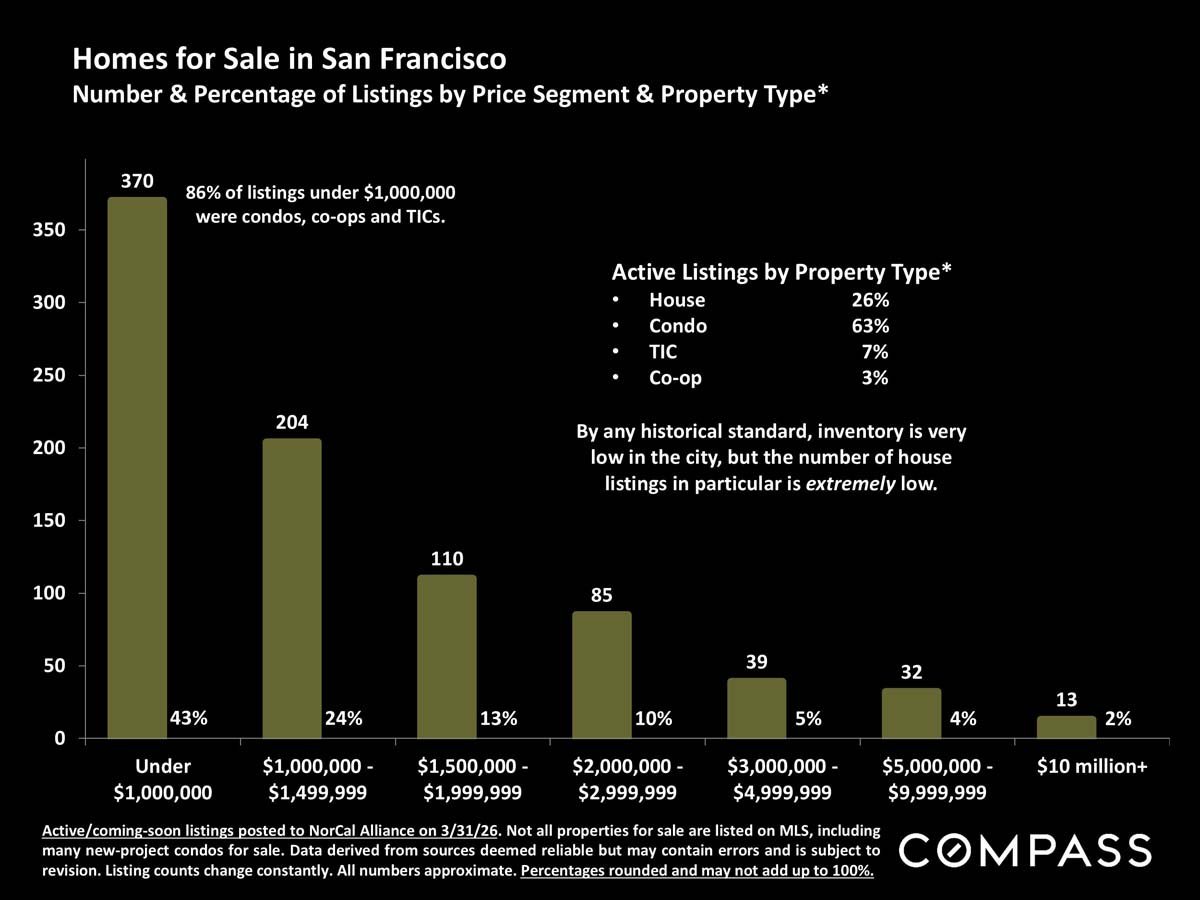
Chart of San Francisco listings by price range and property type; most are condos, and inventory is very low.
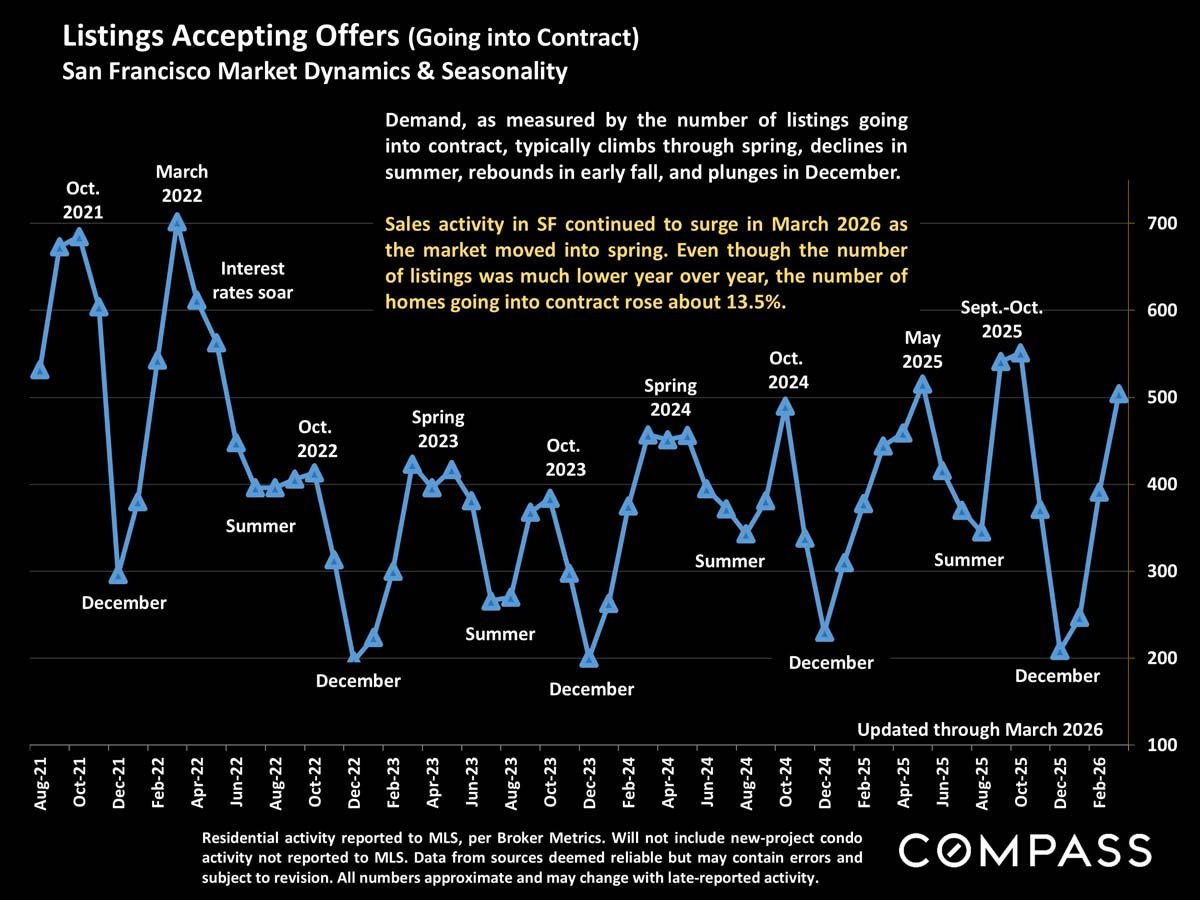
Line chart of San Francisco listings going into contract, August 2021 to February 2026, with seasonal peaks and December declines.
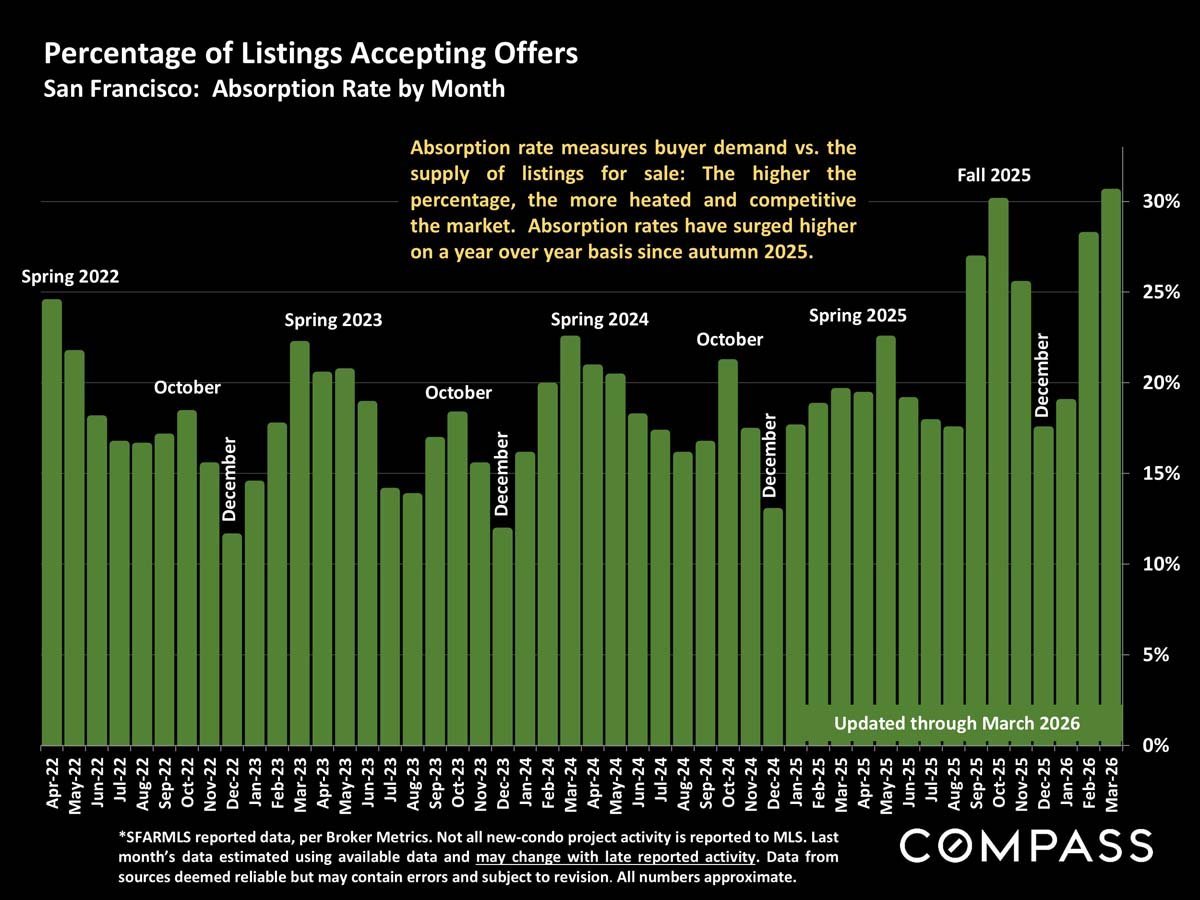
San Francisco monthly listing absorption rate chart, April 2022–March 2026, with a sharp rise in late 2025.
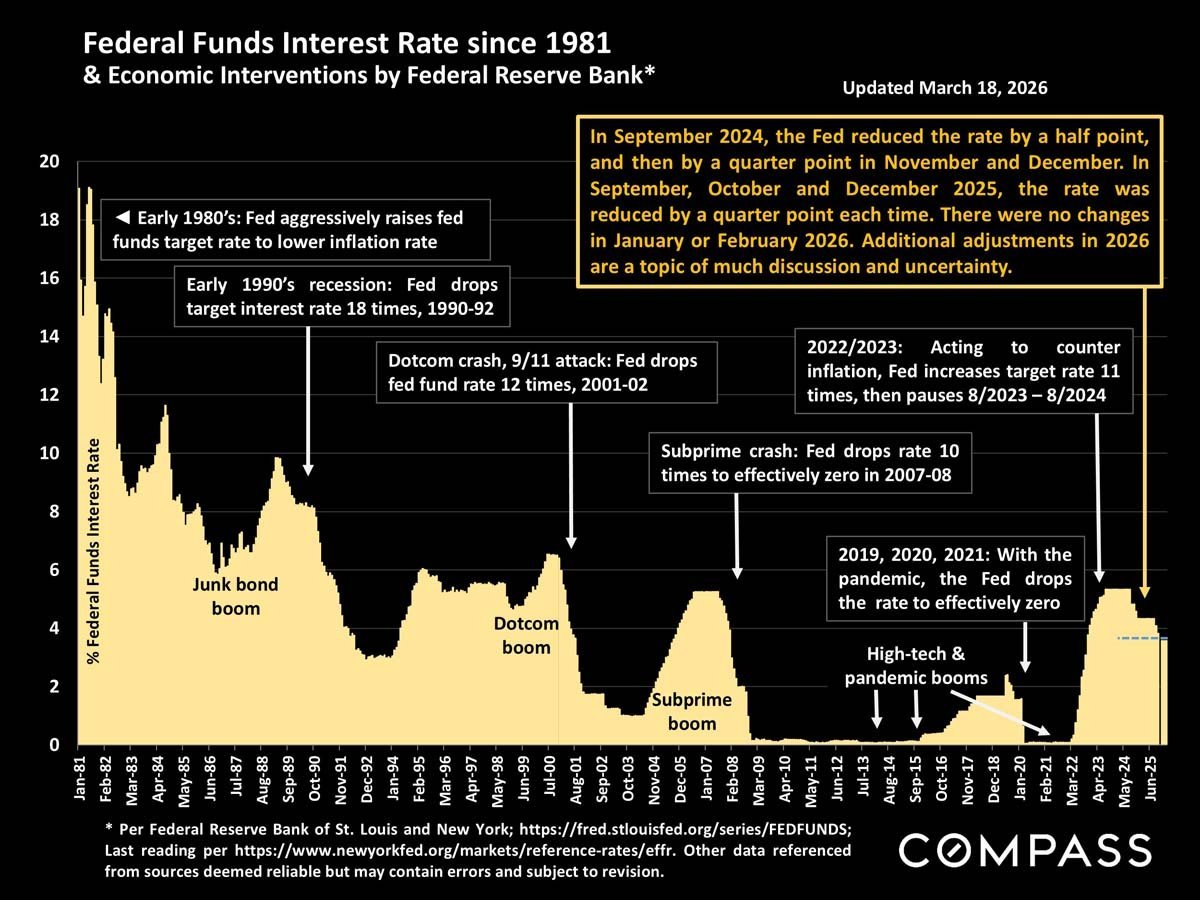
Chart of San Francisco home sales closing over list price, reaching 71% in March 2026.
Chart of San Francisco home sale prices relative to original list prices, January 2020 through March 2026.
Chart of San Francisco average days on market, January 2021–March 2026, with seasonal patterns and March 2026 figures.
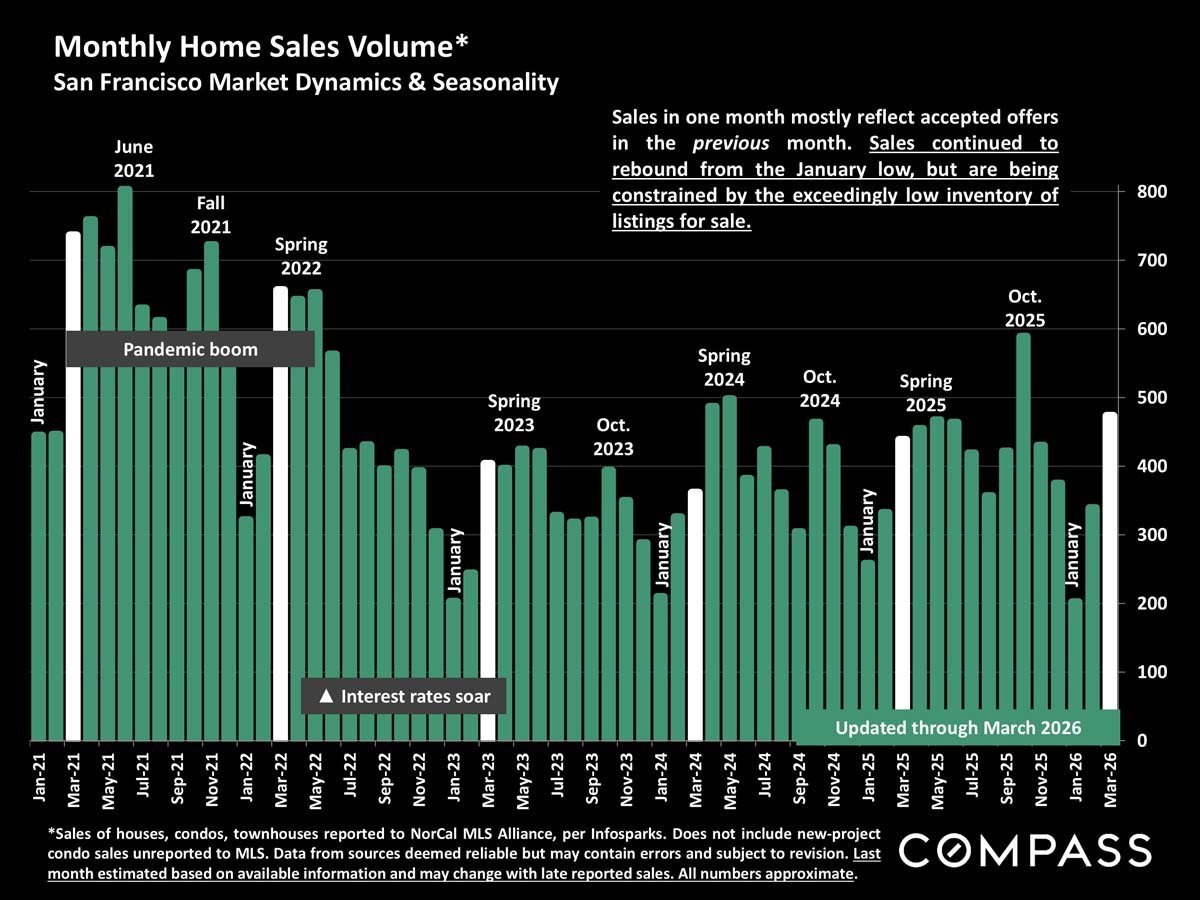
Chart of San Francisco monthly home sales from January 2021 to March 2026, with seasonal peaks and market annotations.
Chart of San Francisco sales of homes priced above $5 million, with monthly counts from 2020 through March 2026.
Bar chart of San Francisco $5 million-plus home sales, with a record monthly count in March 2026.
Bar chart of San Francisco $3 million-plus condo sales, with a record 24 sales in March 2026.
Bar chart of San Francisco active-listing price reductions, January 2020–March 2026, with October peaks highlighted.
Selected Economic & Demographic Data
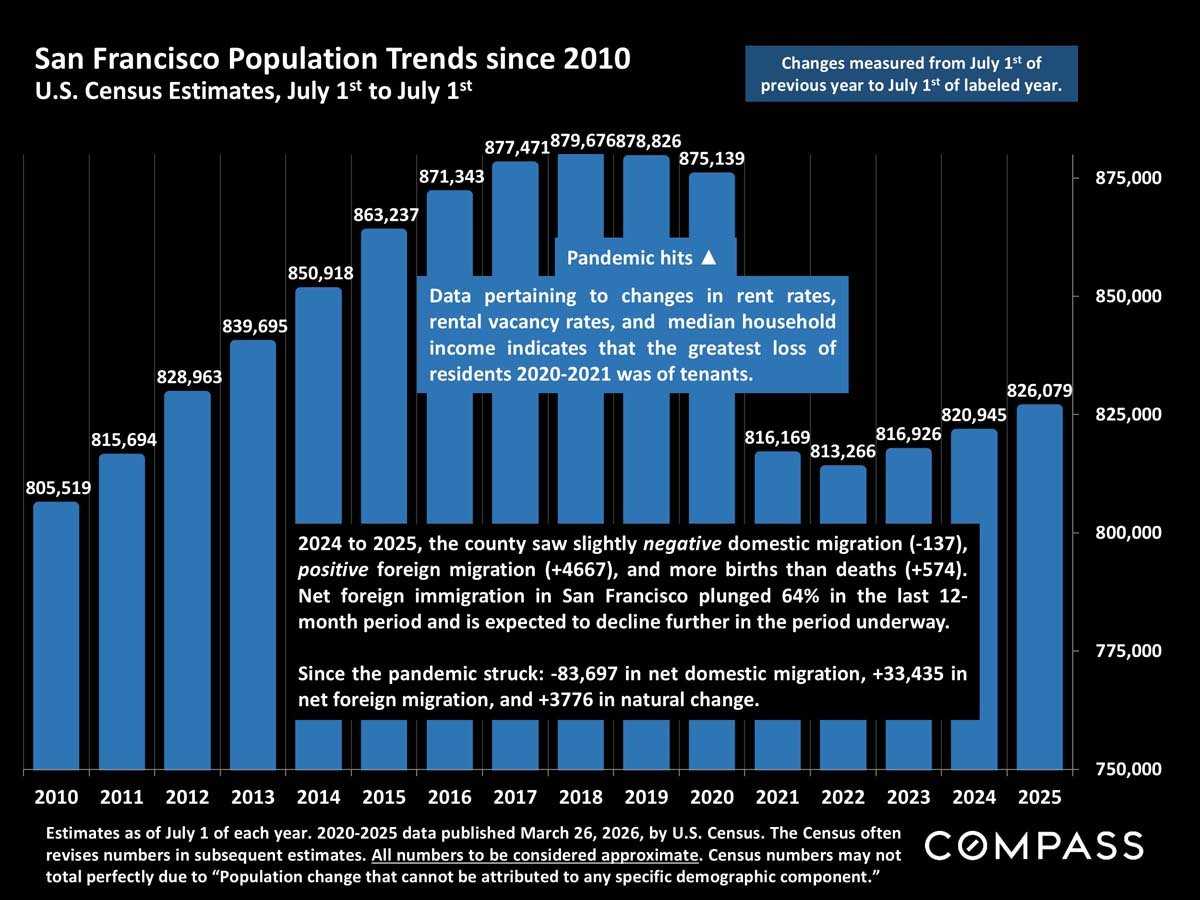
Bar chart of San Francisco population estimates, peaking in 2018 and recovering to 826,079 in 2025.
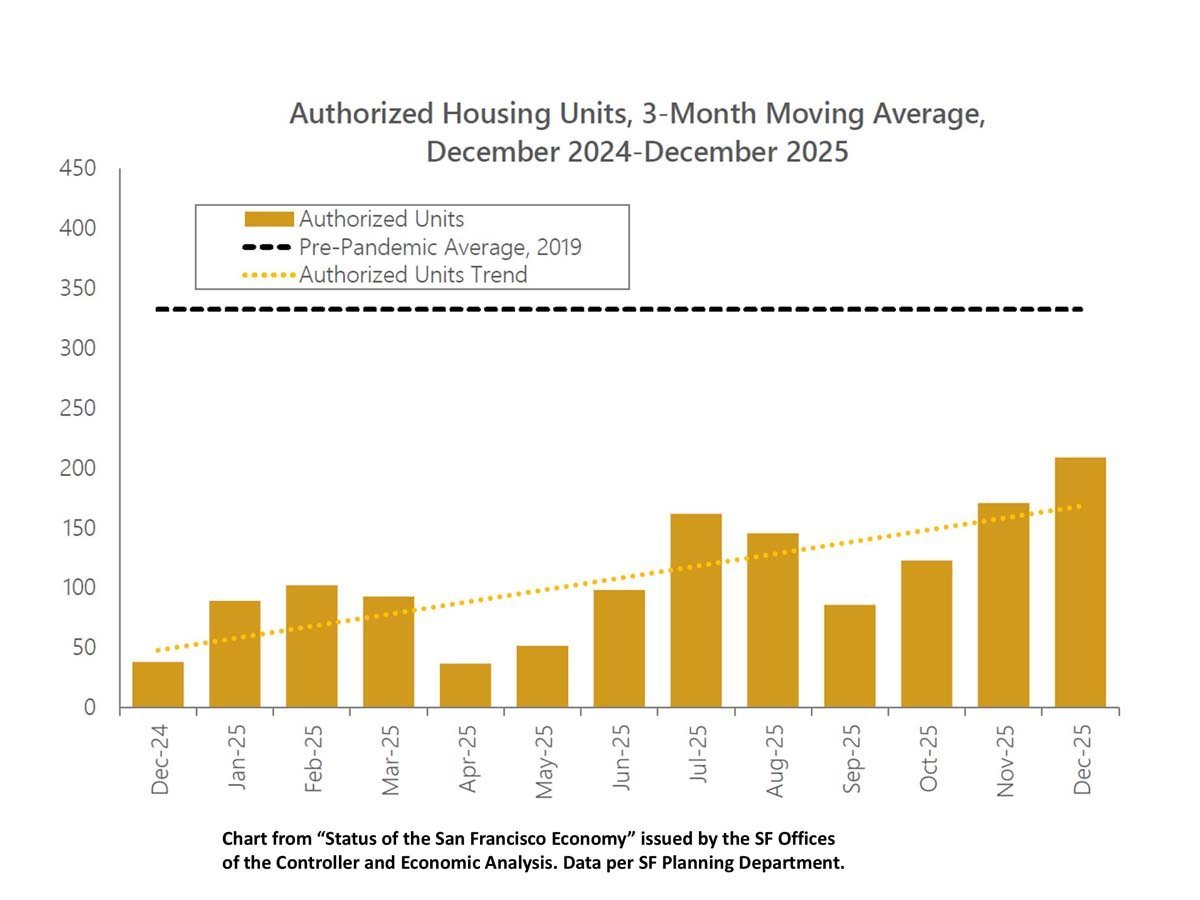
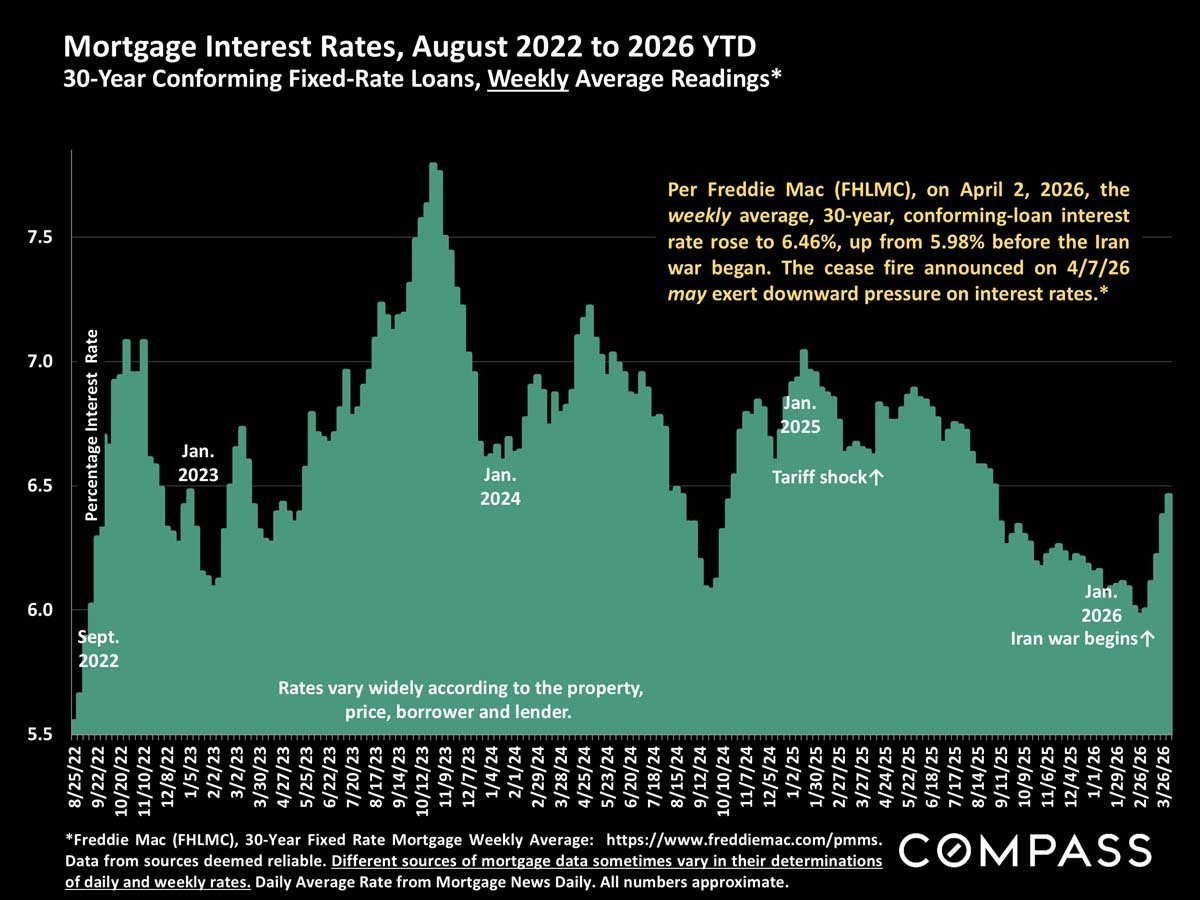
Chart of weekly 30-year mortgage rates, August 2022 to 2026 YTD, with tariff shock and Iran war annotations.
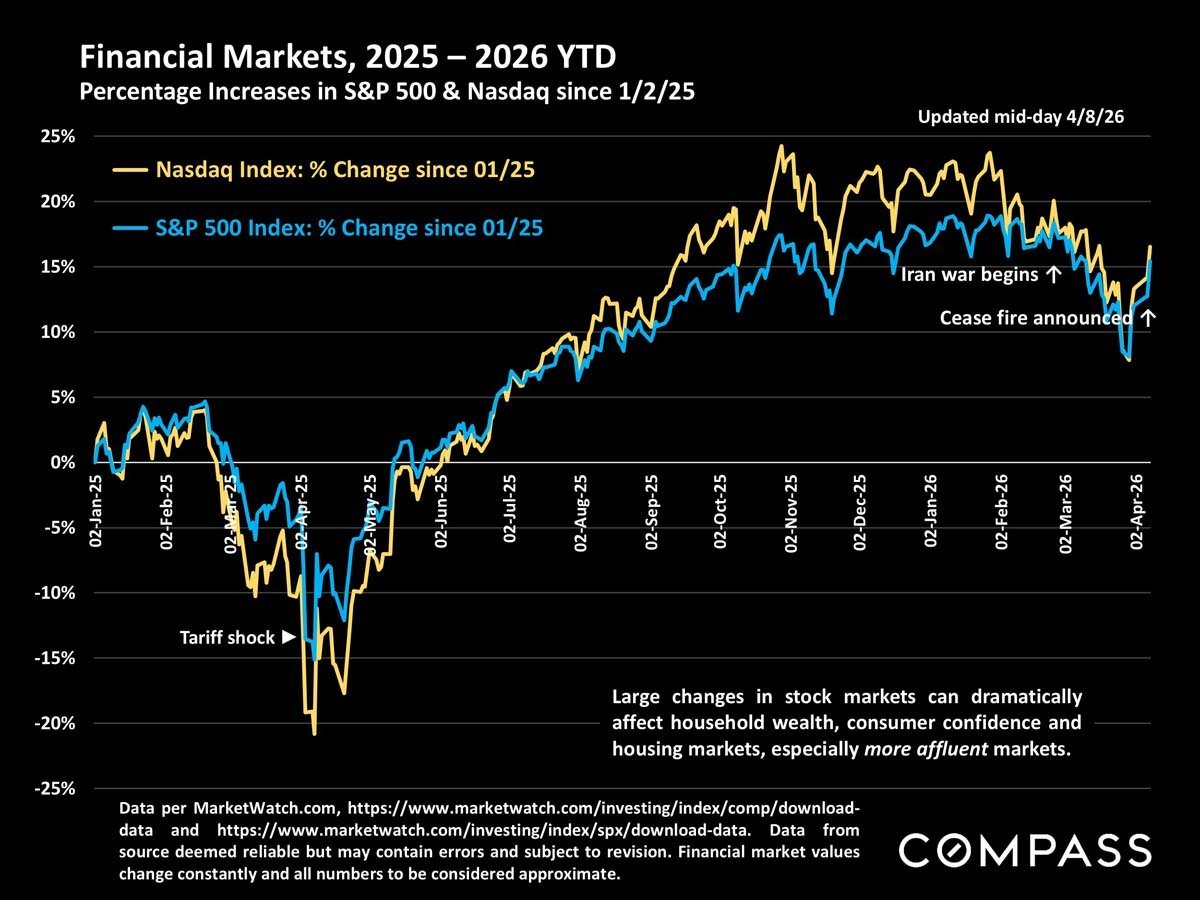
Chart comparing Nasdaq and S&P 500 percentage changes from January 2025 through April 2026, with market-event annotations.
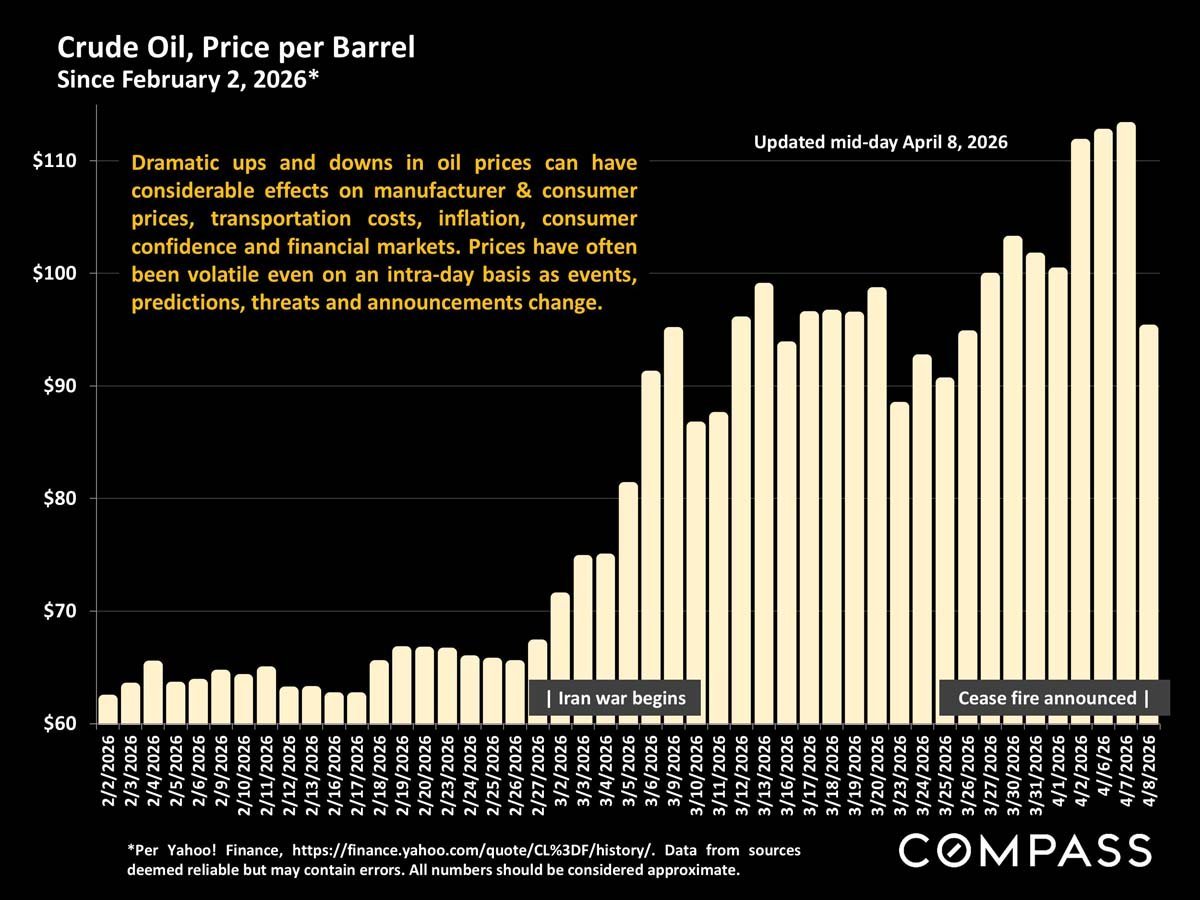
Crude oil price chart from February 2 to April 8, 2026, with prices rising above $100 and two event annotations.
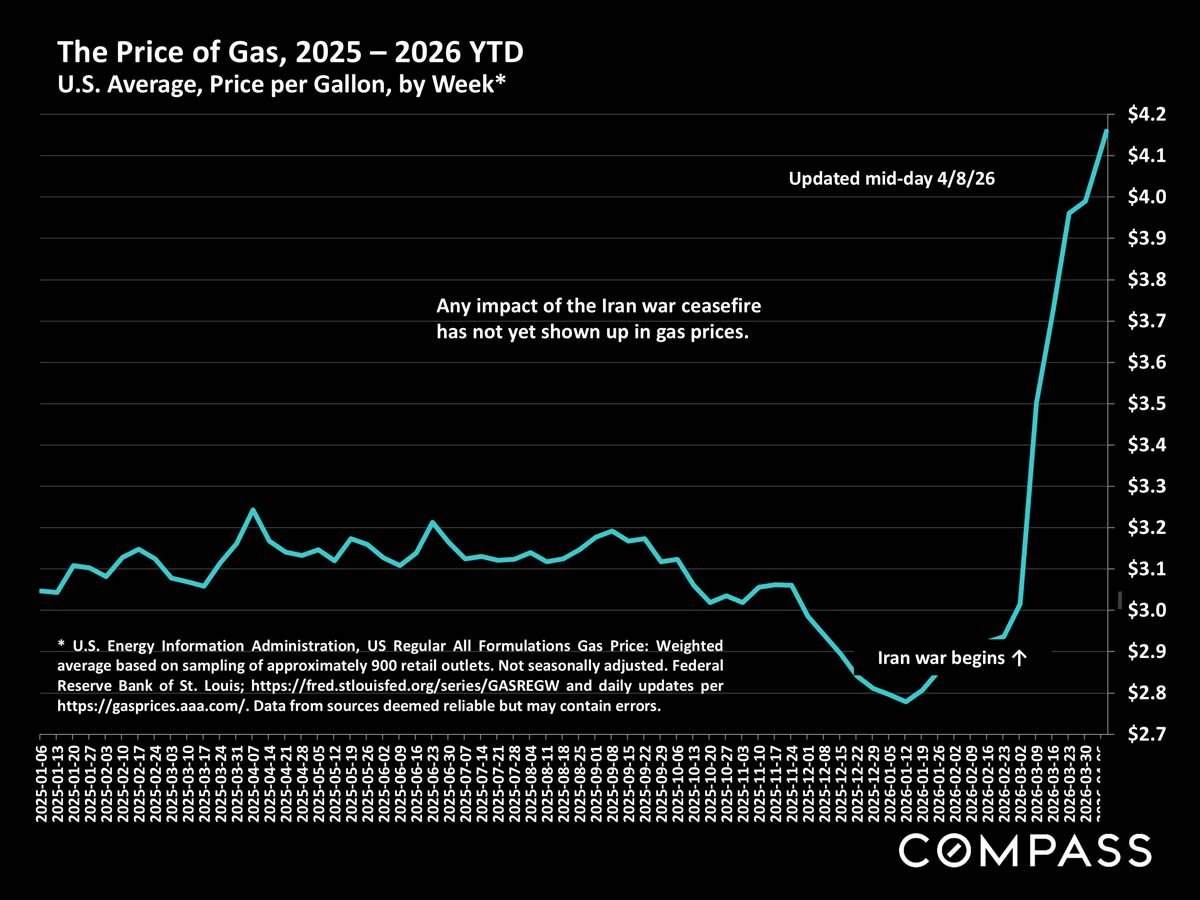
Chart of U.S. gas prices, mostly steady in 2025 before a sharp rise above $4 per gallon in 2026.
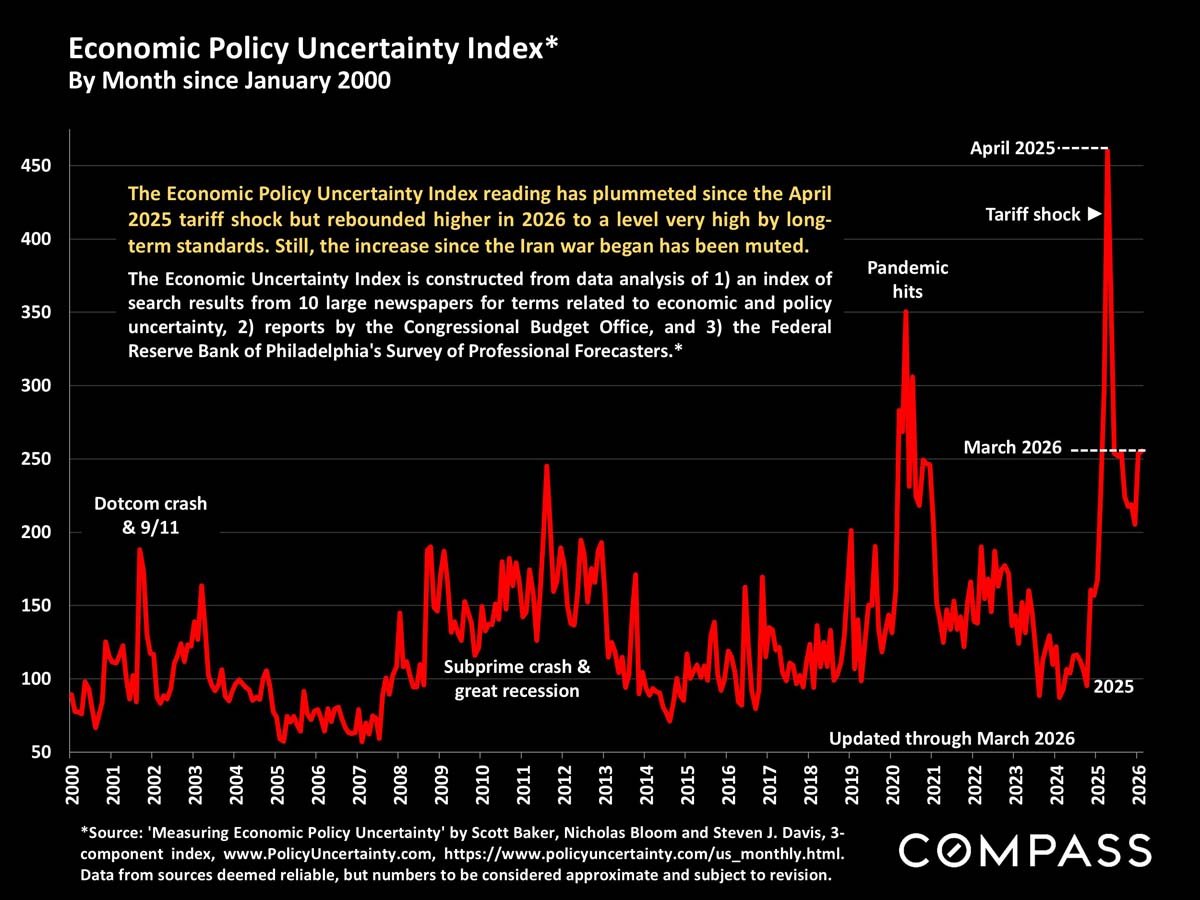
Line chart of the Economic Policy Uncertainty Index, 2000–March 2026, with a sharp spike in April 2025.
Chart of U.S. federal funds interest rates from 1981 through 2025, annotated with economic events and Fed actions.

San Francisco authorized housing units rose through 2025, remaining below the 2019 pre-pandemic average.
Real estate market statistics disclaimers and Compass legal disclosures.

Work With Jane

Get assistance in determining the current property value, crafting a competitive offer, writing and negotiating a contract, and much more. Contact me today.

Follow Me on Instagram