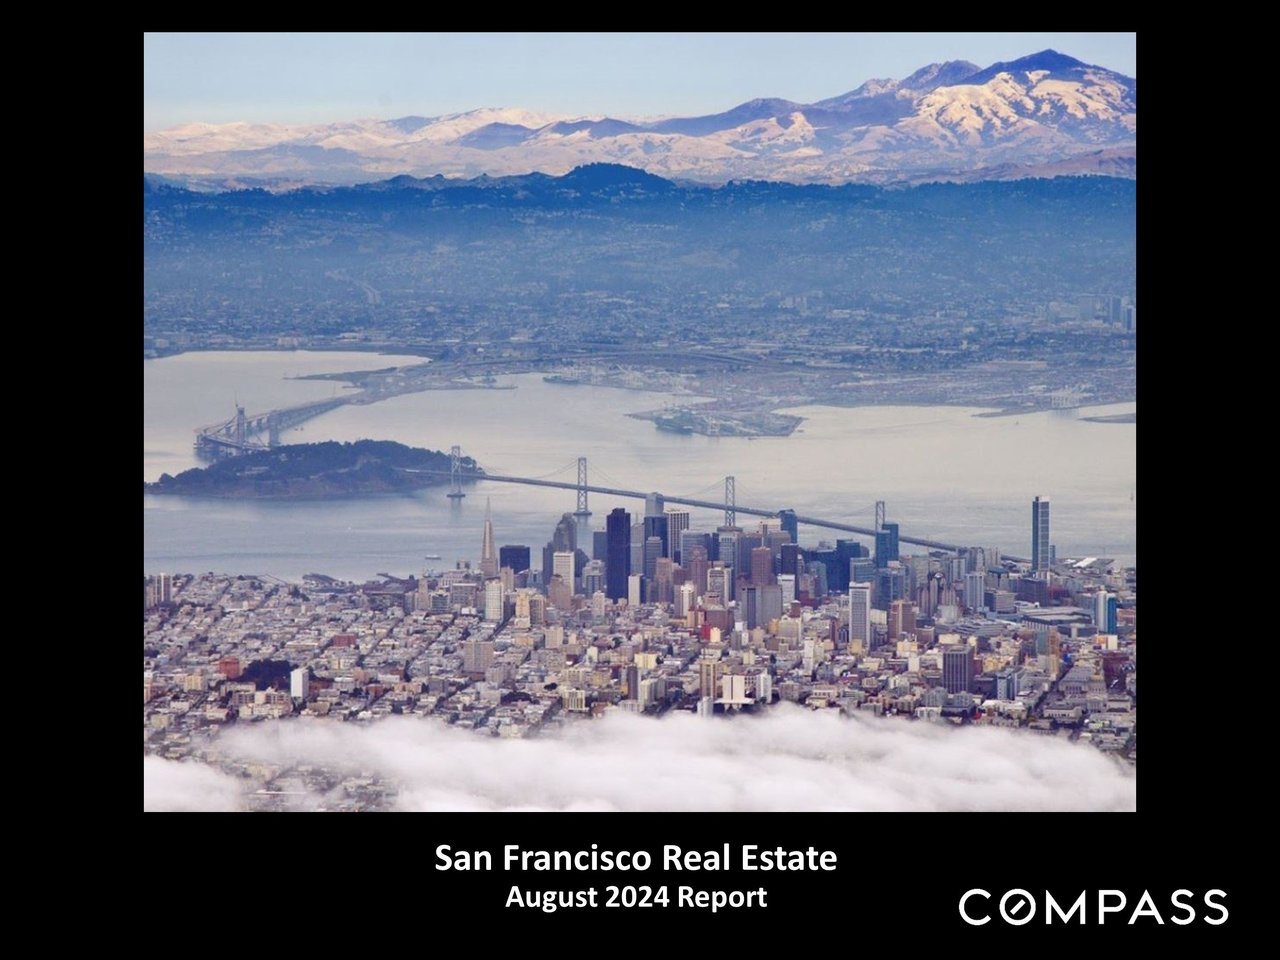
San Francisco real estate August 2024 report

San Francisco Home Prices, Market Conditions & Trends August 2024

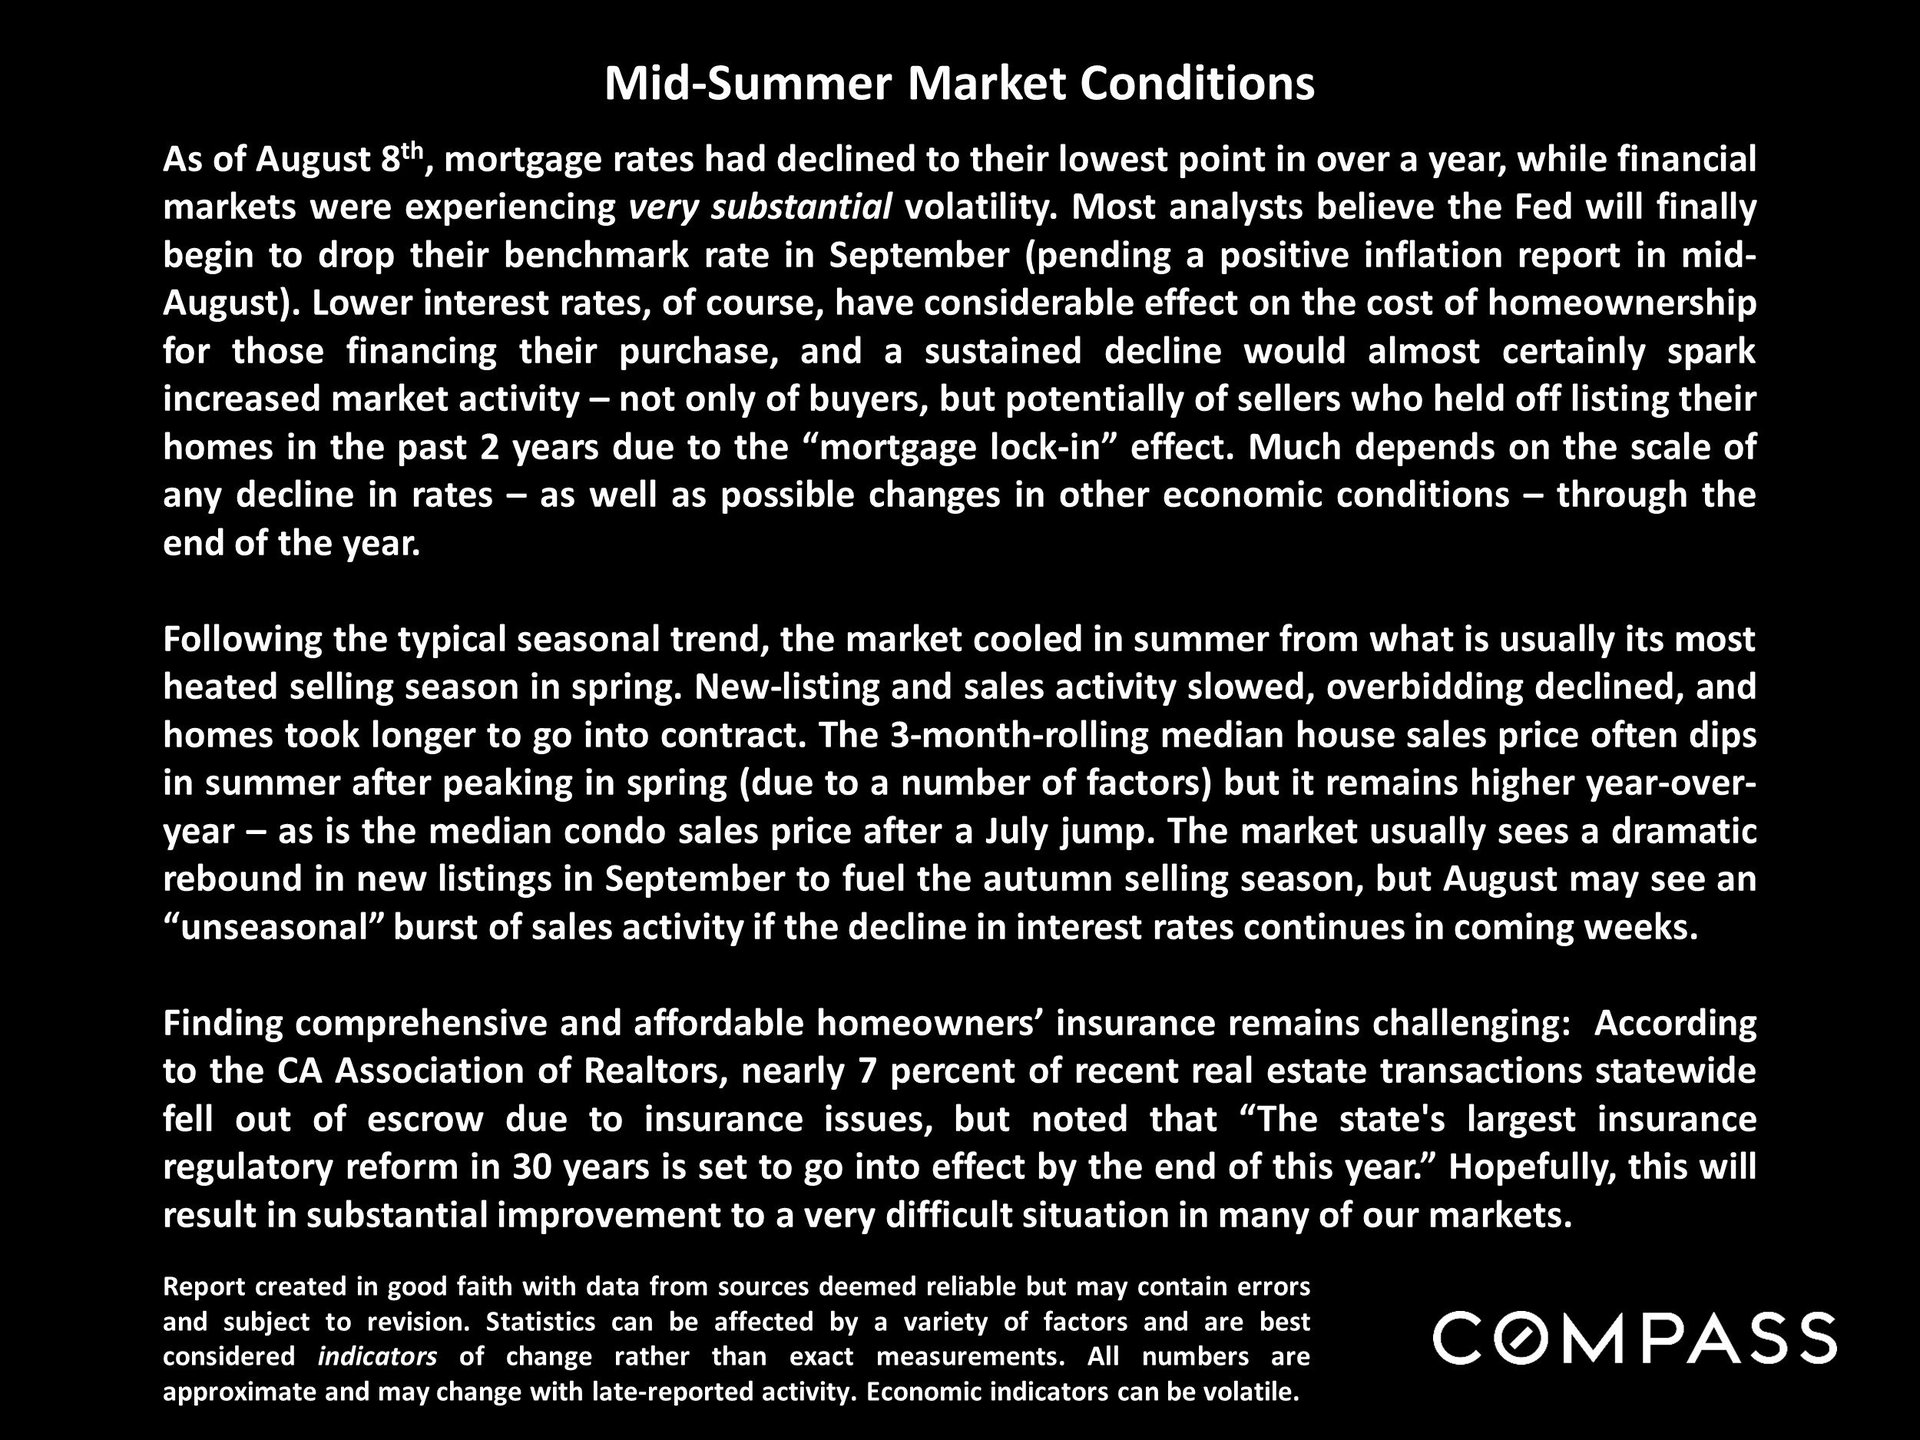
As of August 8th, mortgage rates had declined to their lowest point in over a year, while financial markets were experiencing very substantial volatility.
 
San Francisco real estate August 2024 report
 
Mid-summer market update covering mortgage rates, housing activity, prices, and homeowners’ insurance, with Compass branding.
 
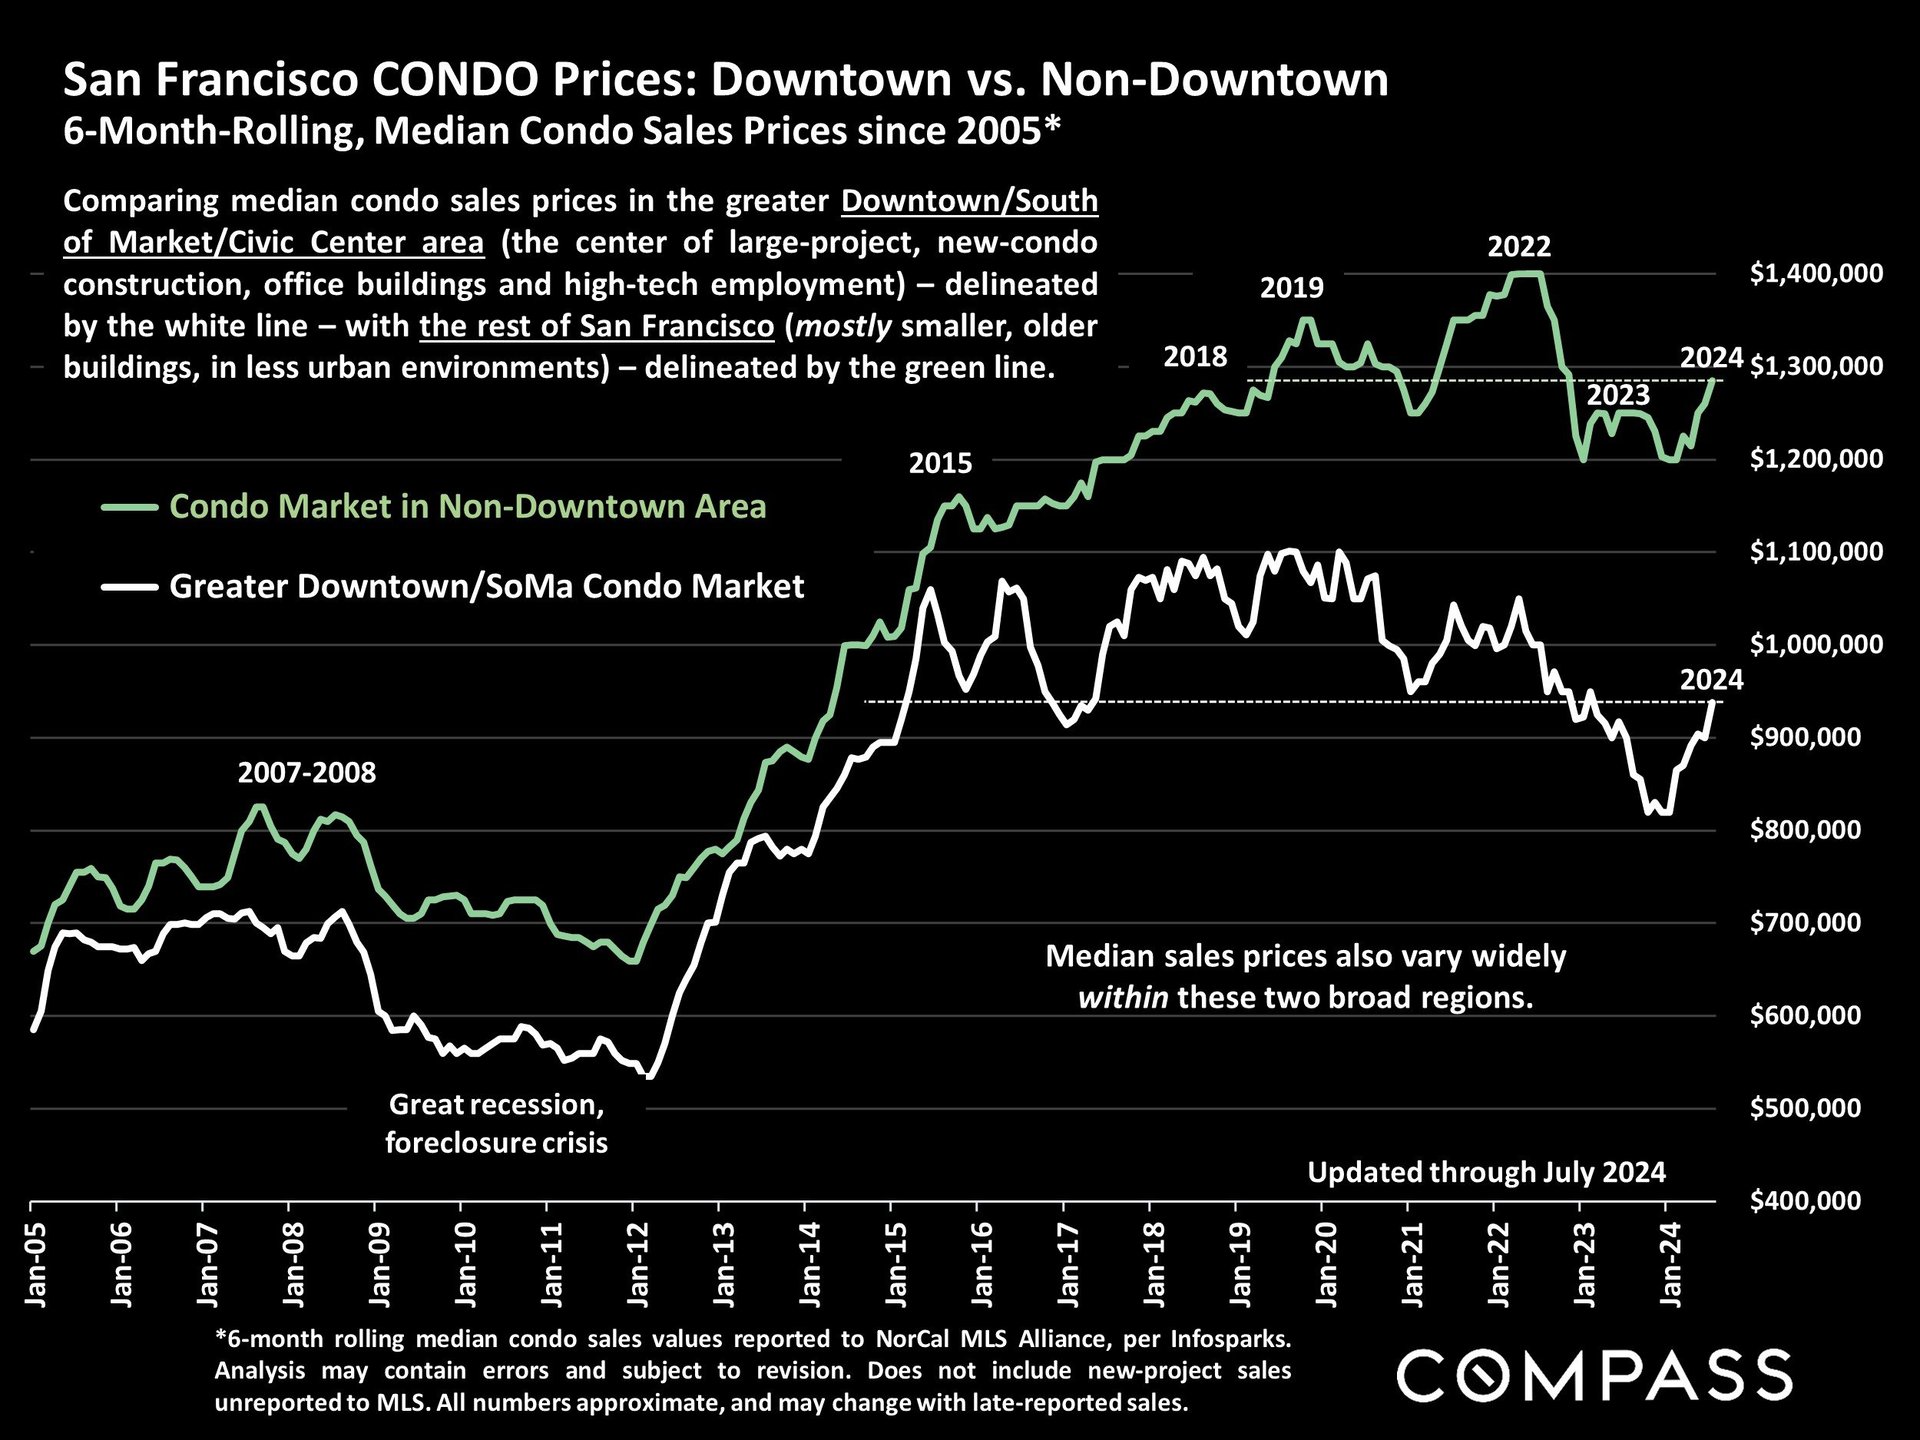
Chart comparing San Francisco condo prices downtown and outside downtown from 2005 through July 2024.
 
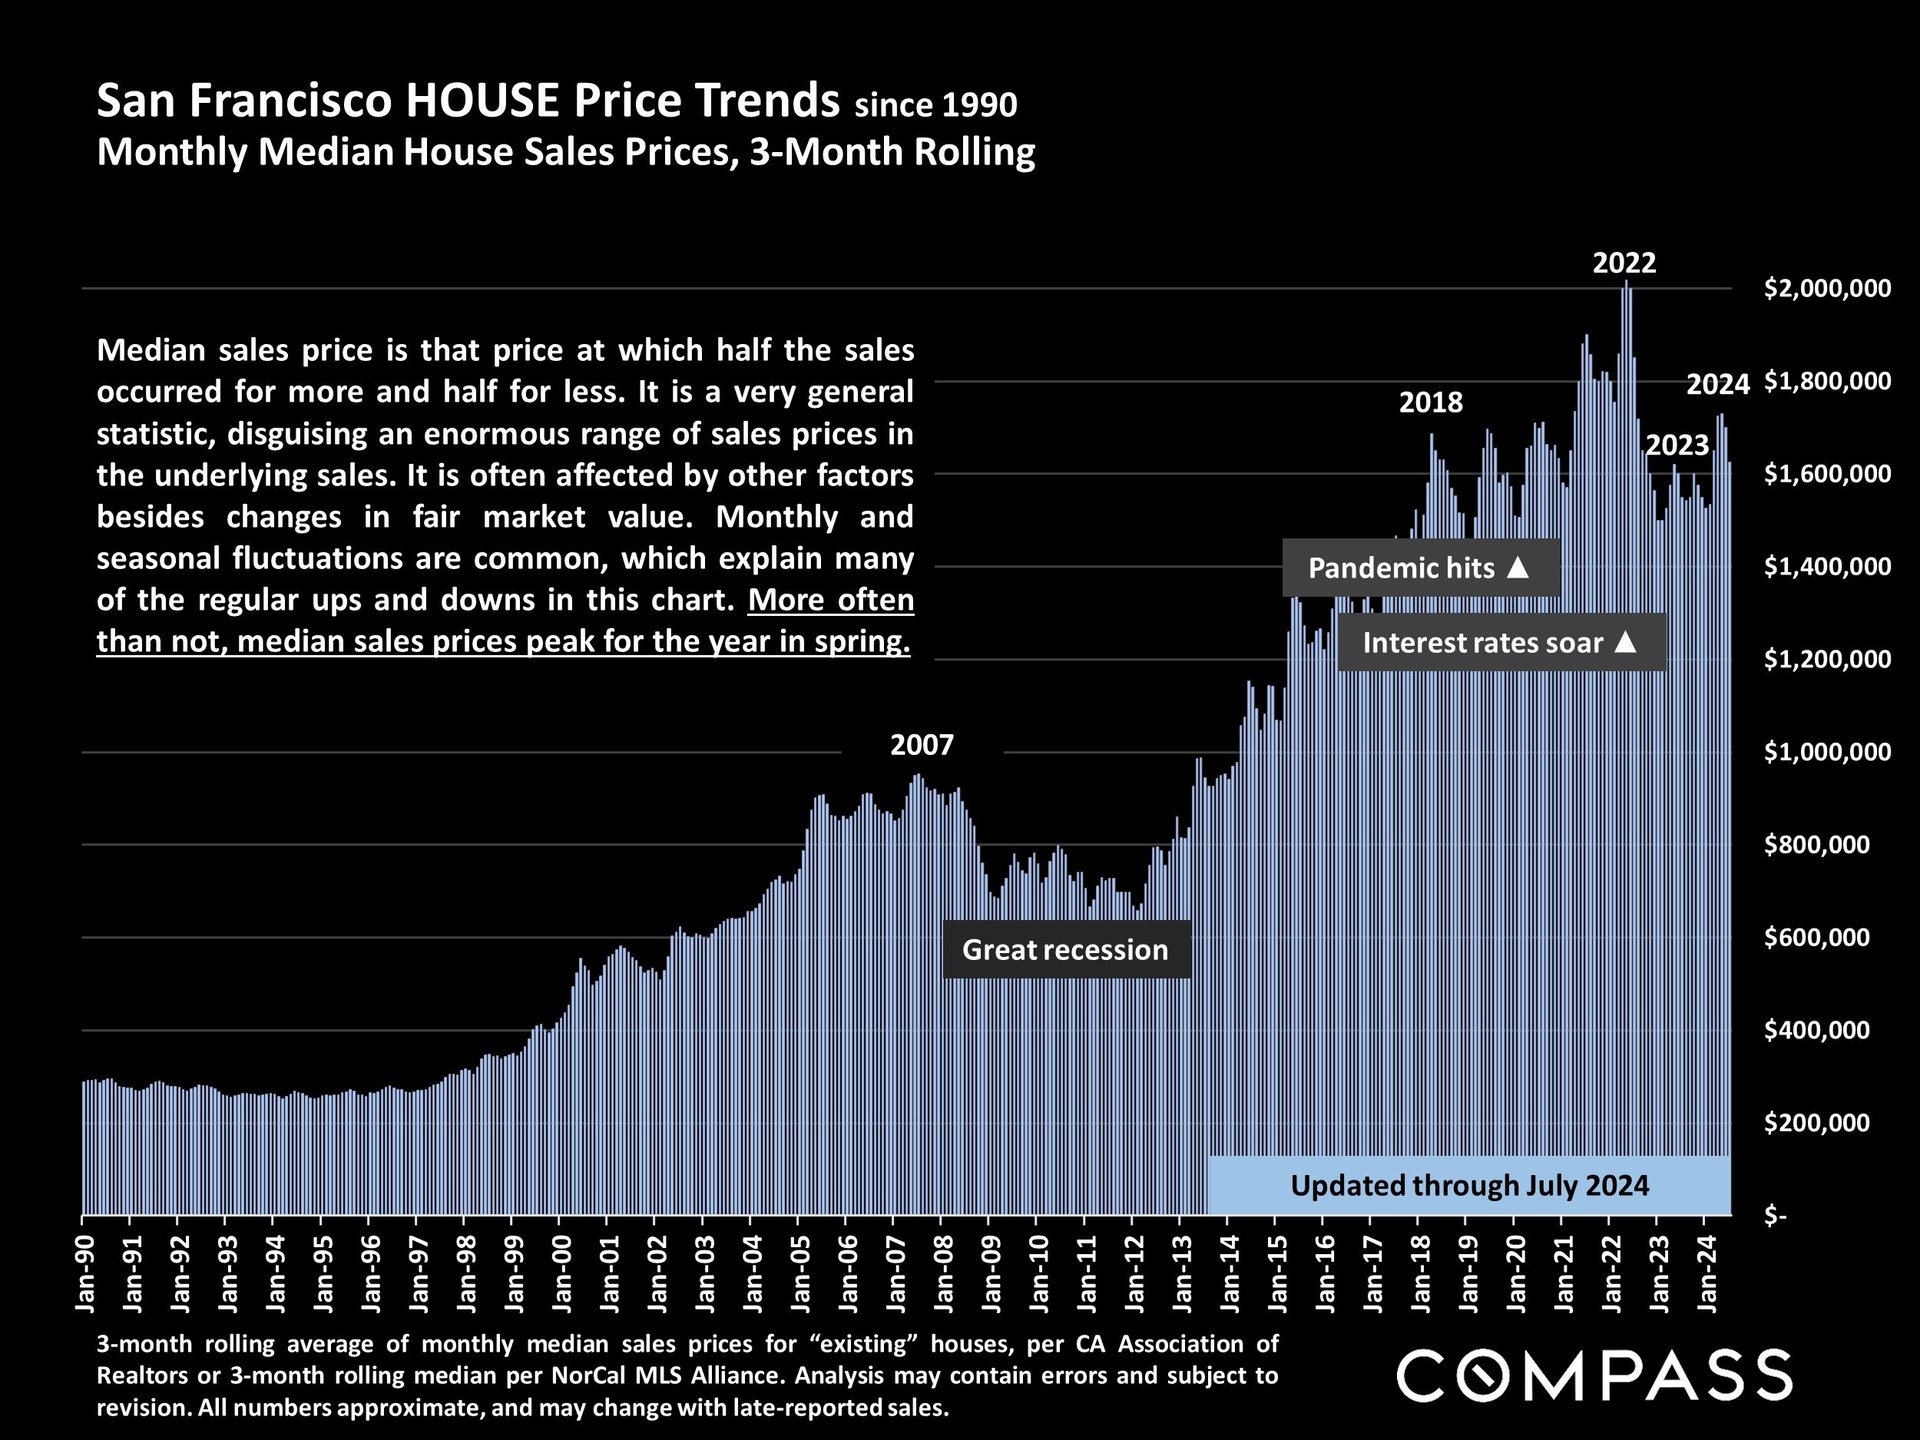
Chart of San Francisco median house prices from 1990 to July 2024, peaking near $2 million in 2022.
 
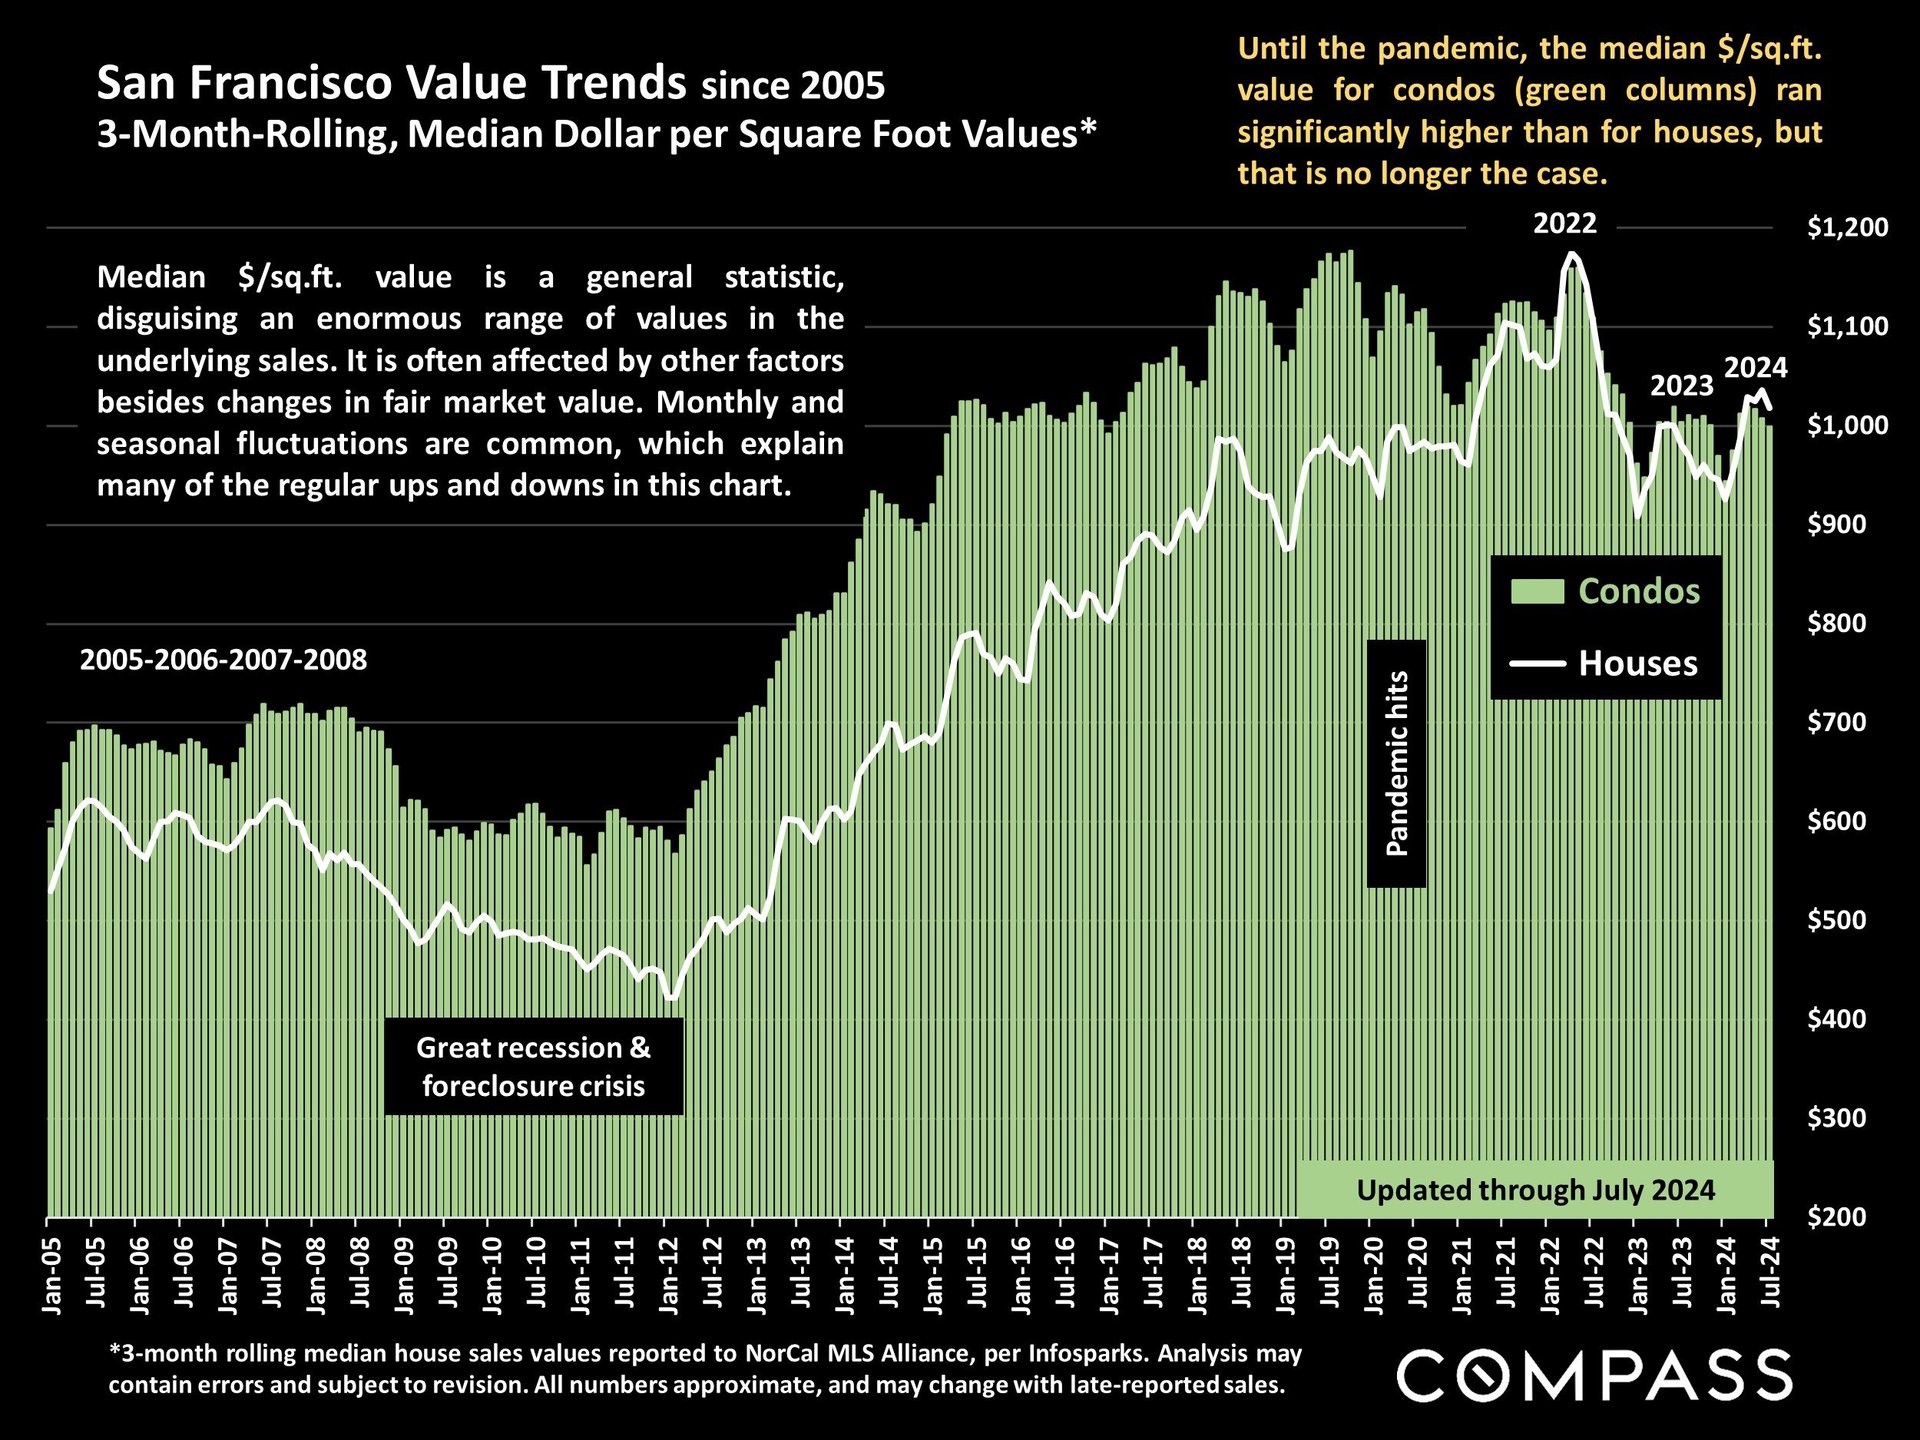
Chart of San Francisco condo and house median price per square foot from 2005 through July 2024.
 
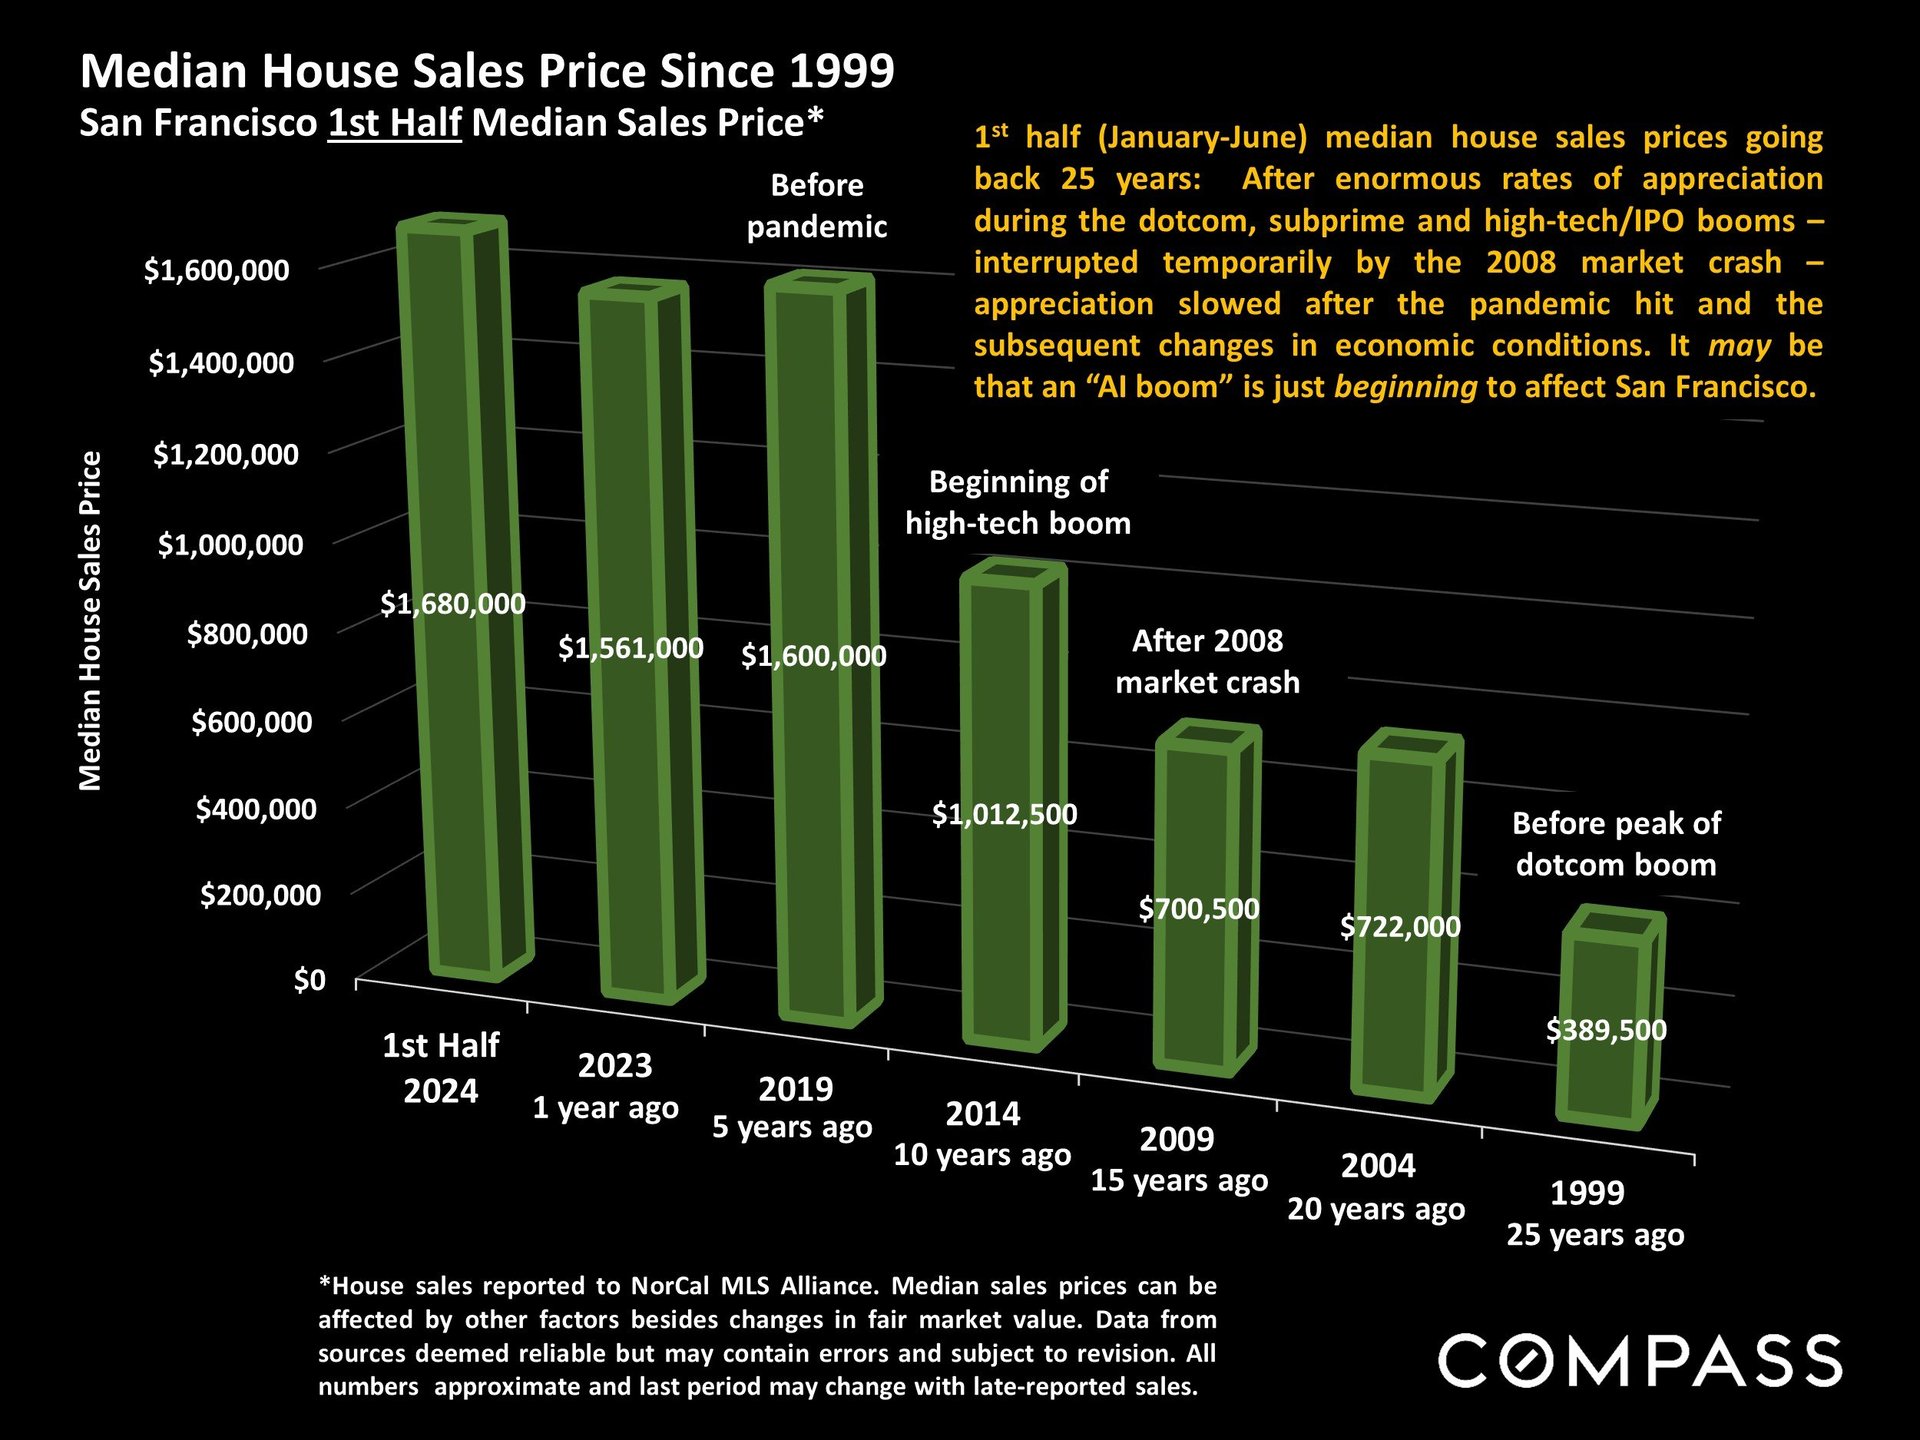
Chart of San Francisco first-half median home sale prices from 1999 to 2024, with green bars and historical notes.
 
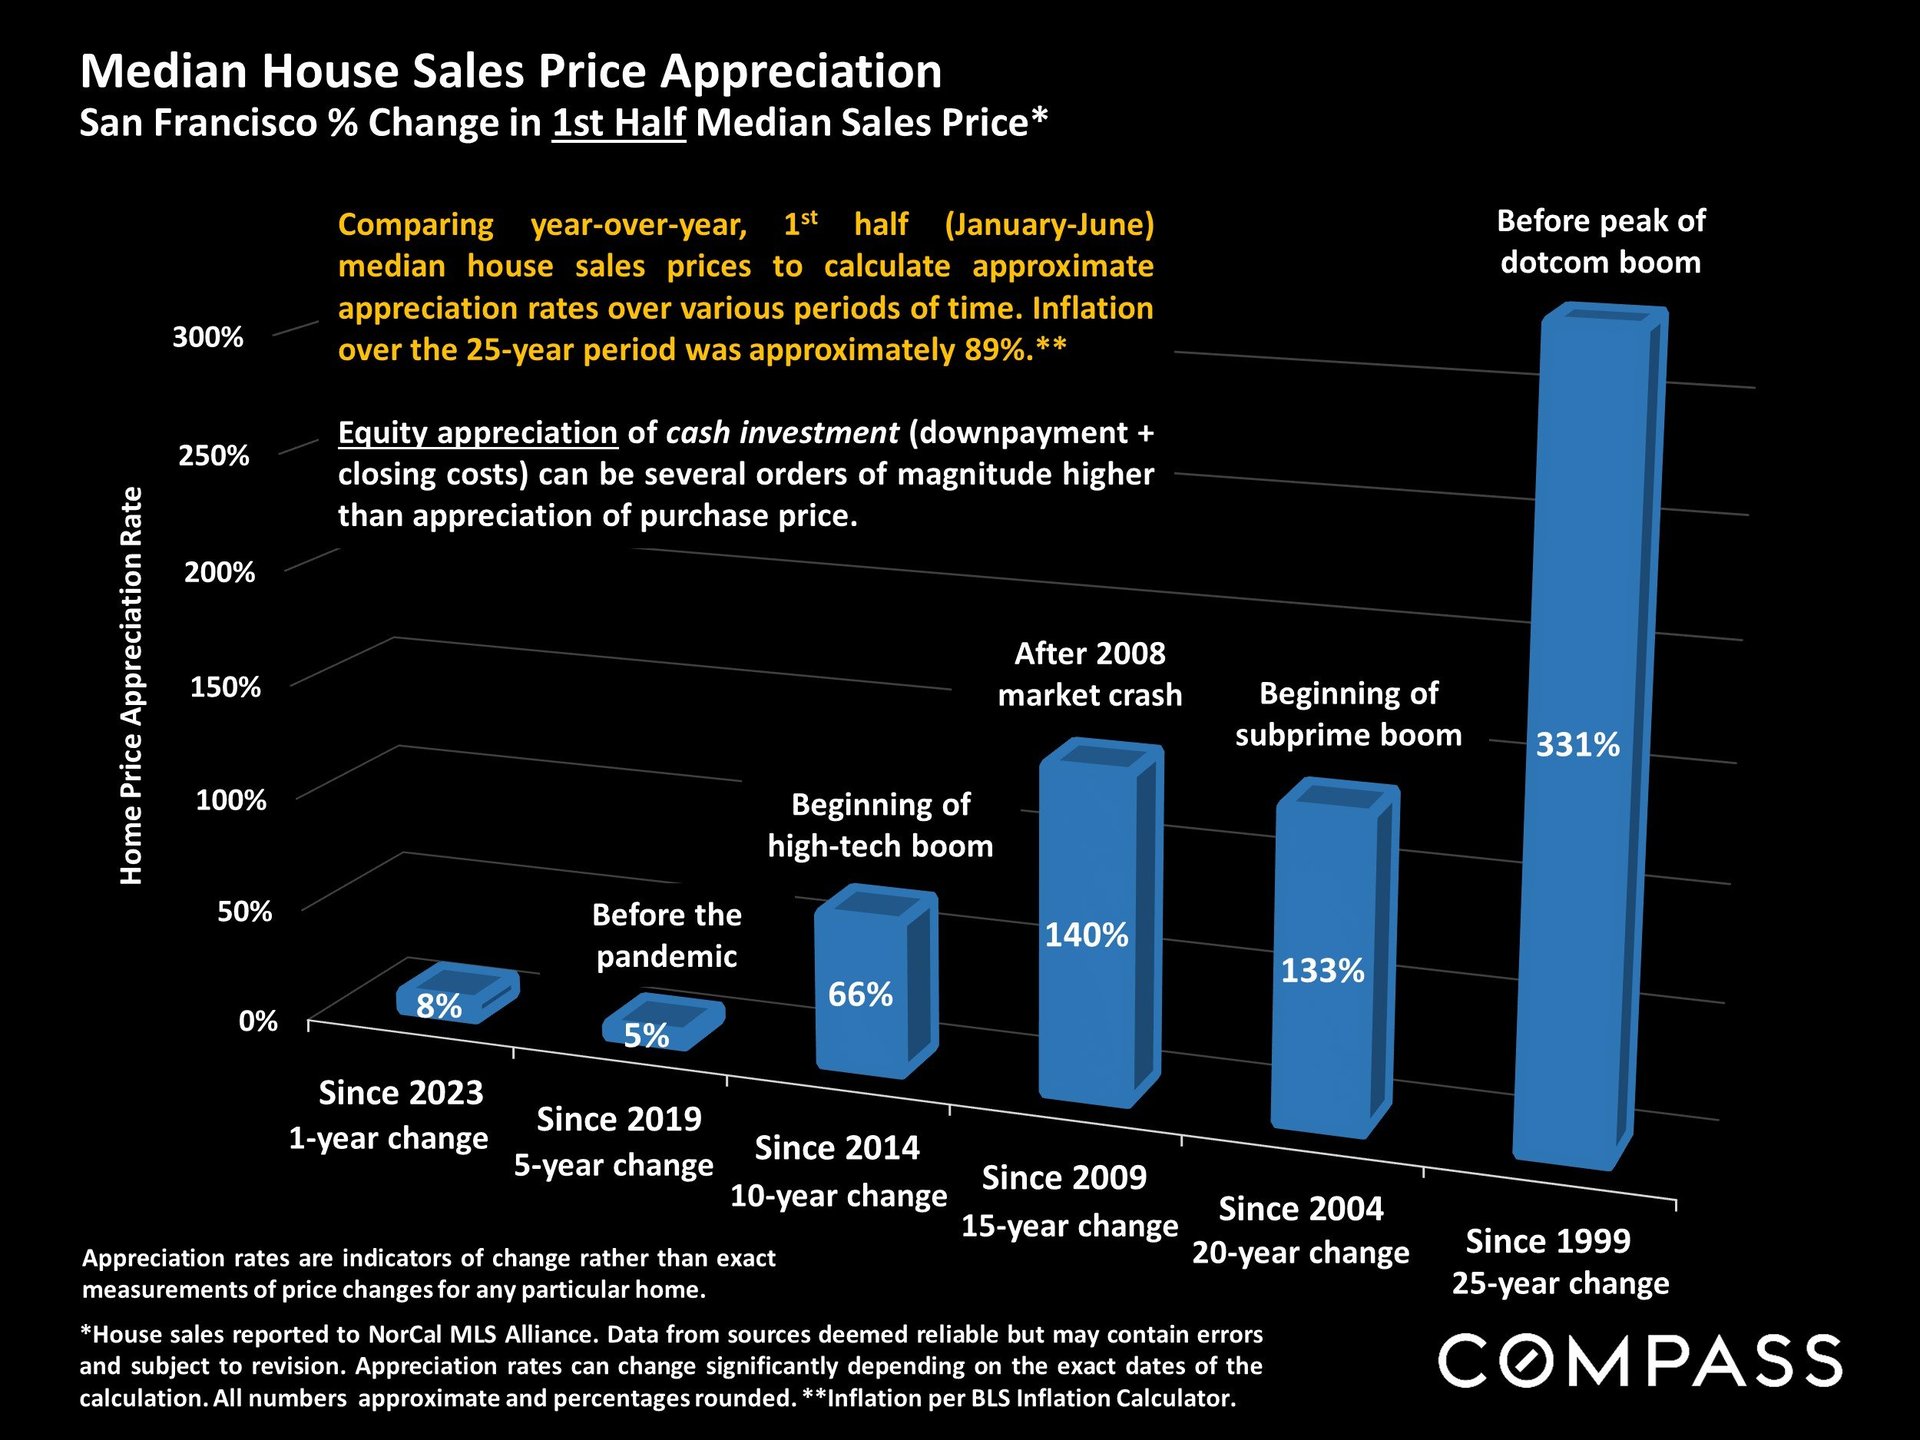
Chart of San Francisco home price appreciation, from 8% over one year to 331% over 25 years.
 
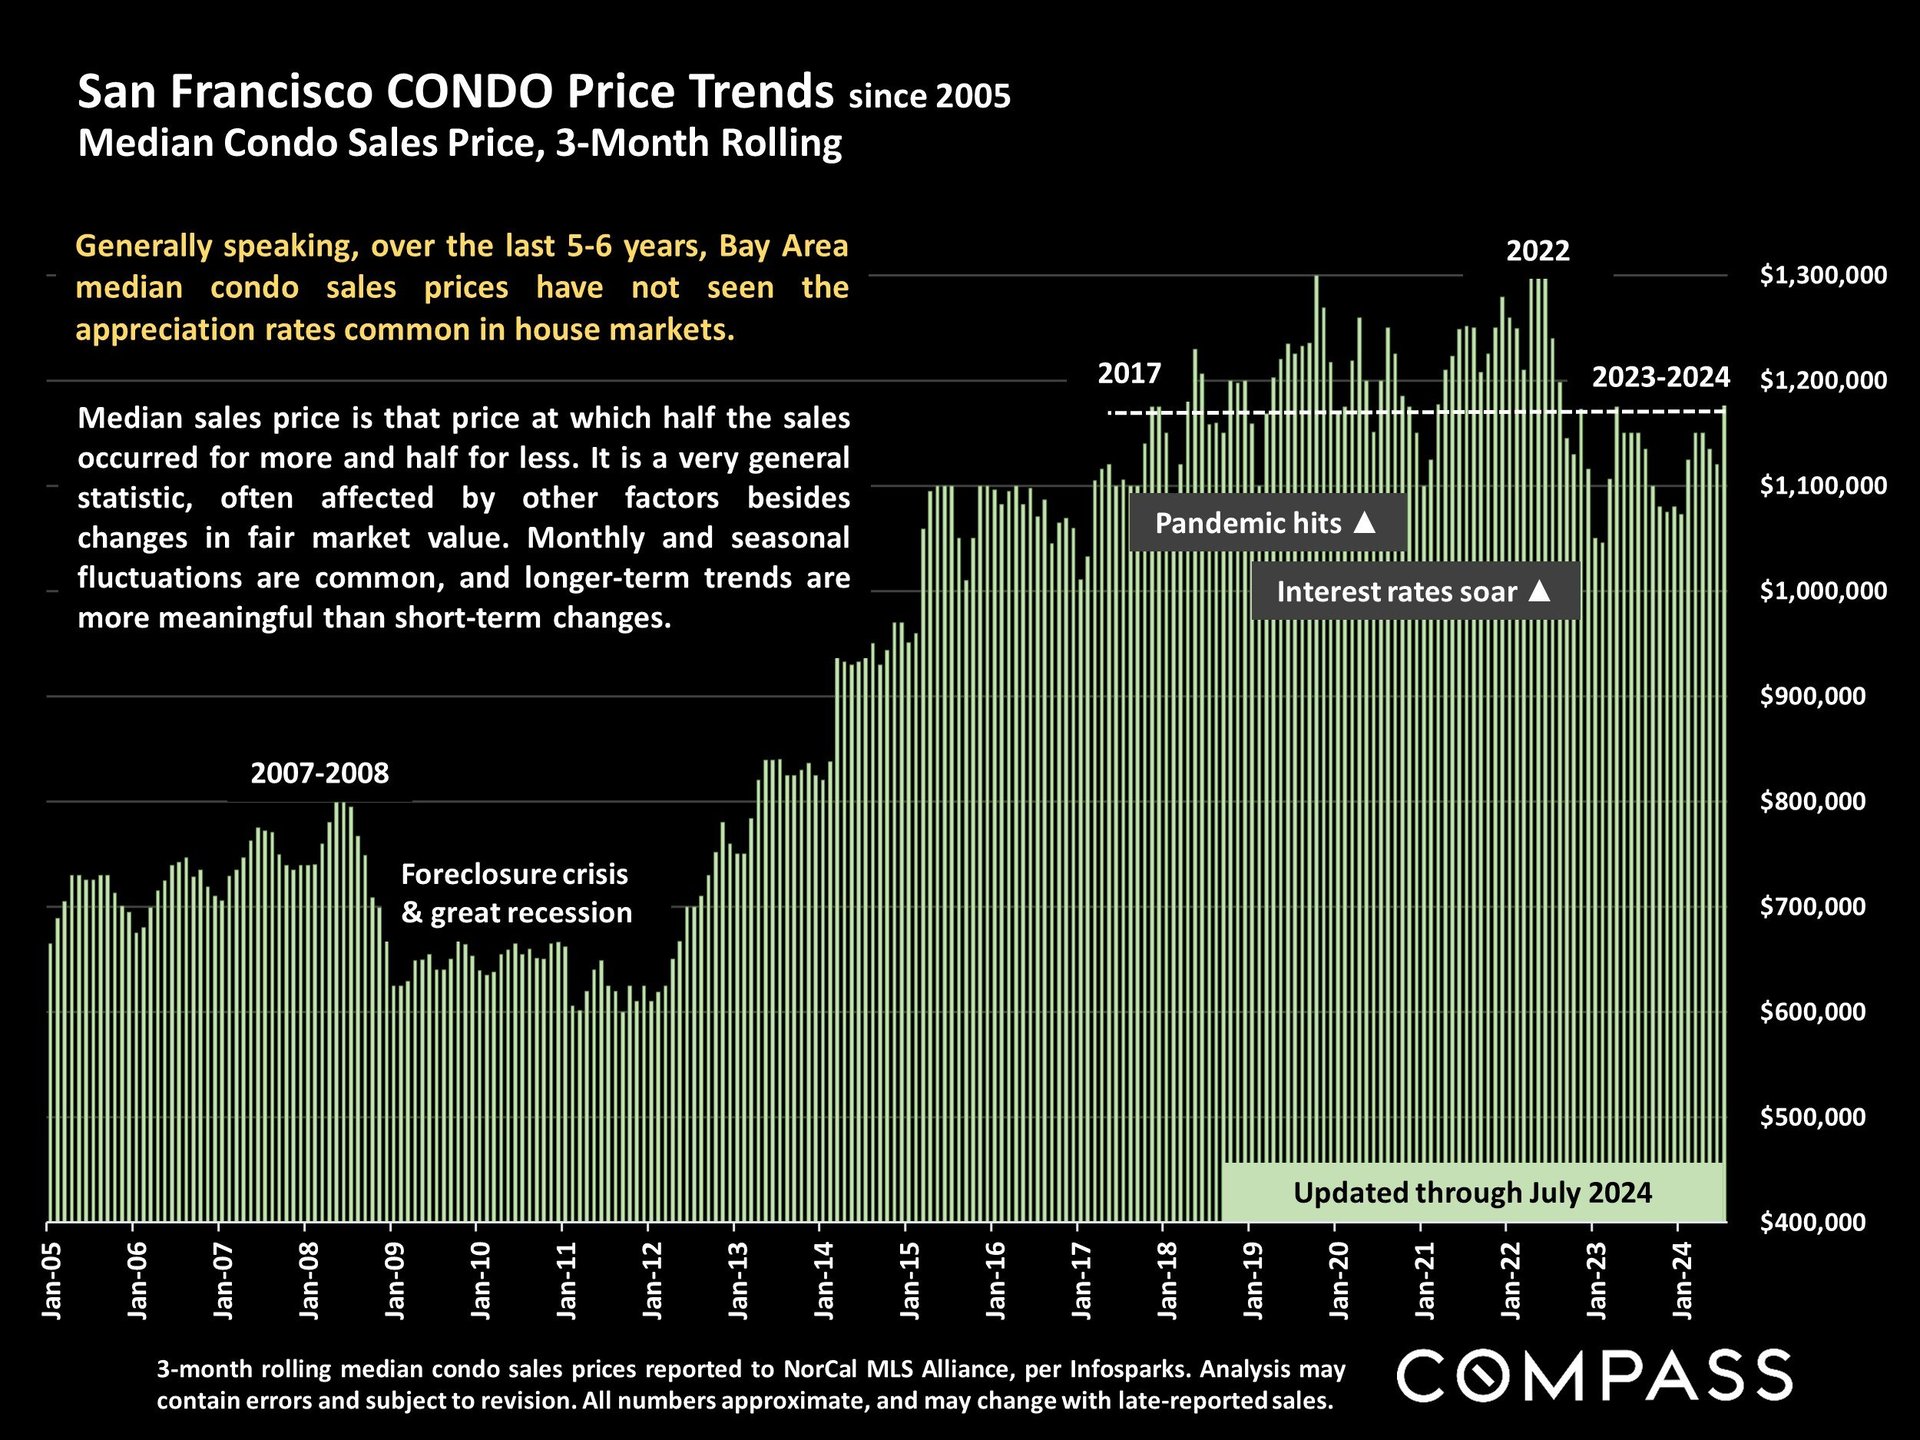
Chart of San Francisco condo prices from 2005 to July 2024, with a 2022 peak near $1.3 million.
 
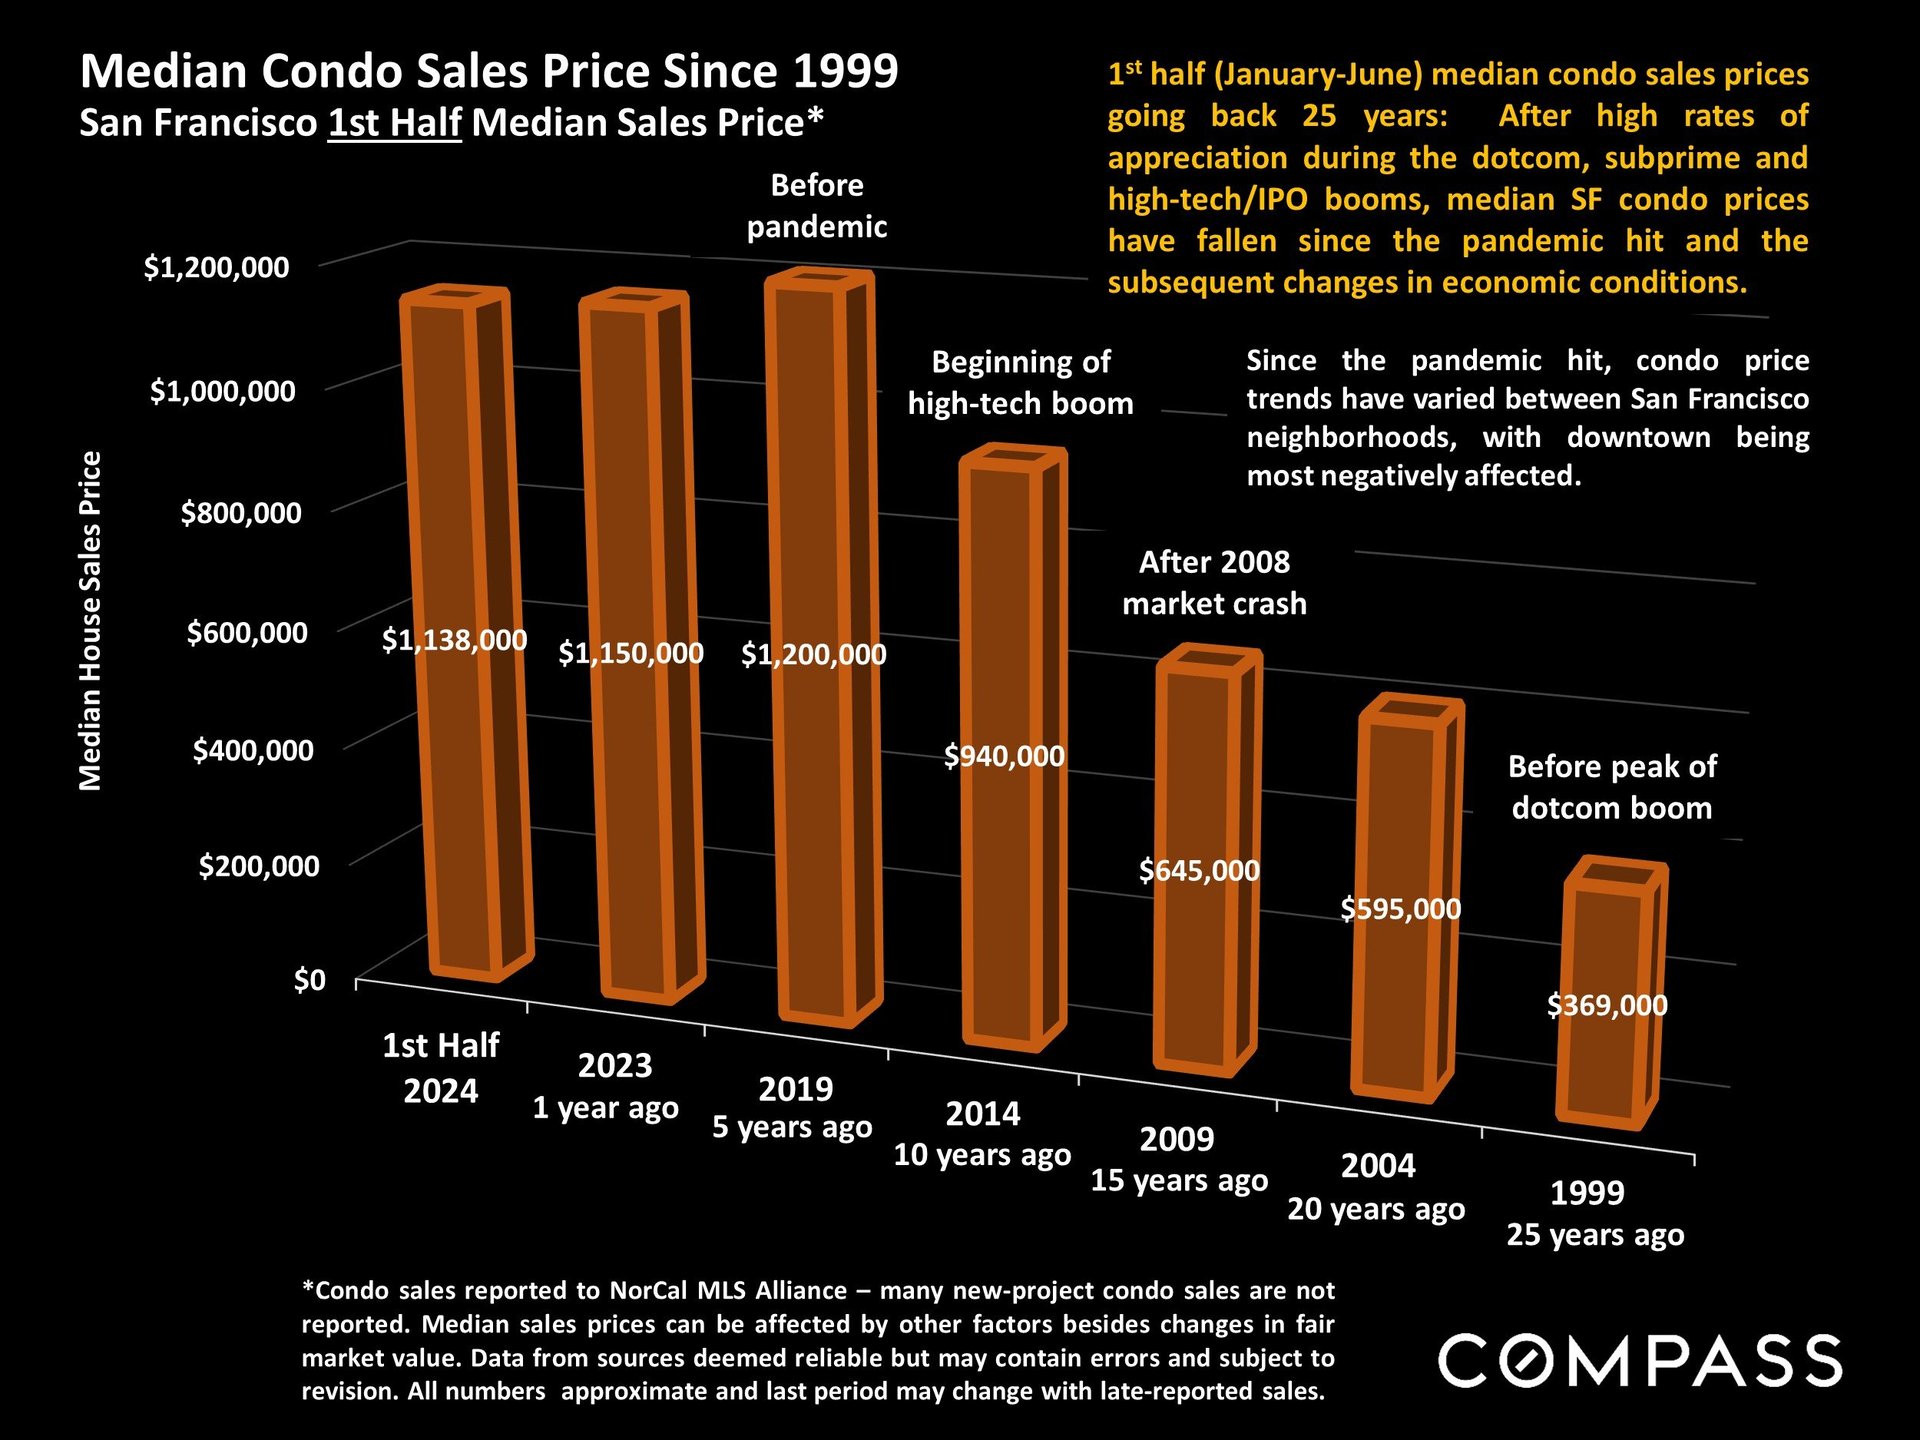
Bar chart comparing San Francisco median condo prices from 1999 to 2024, with the highest value in 2019.
 
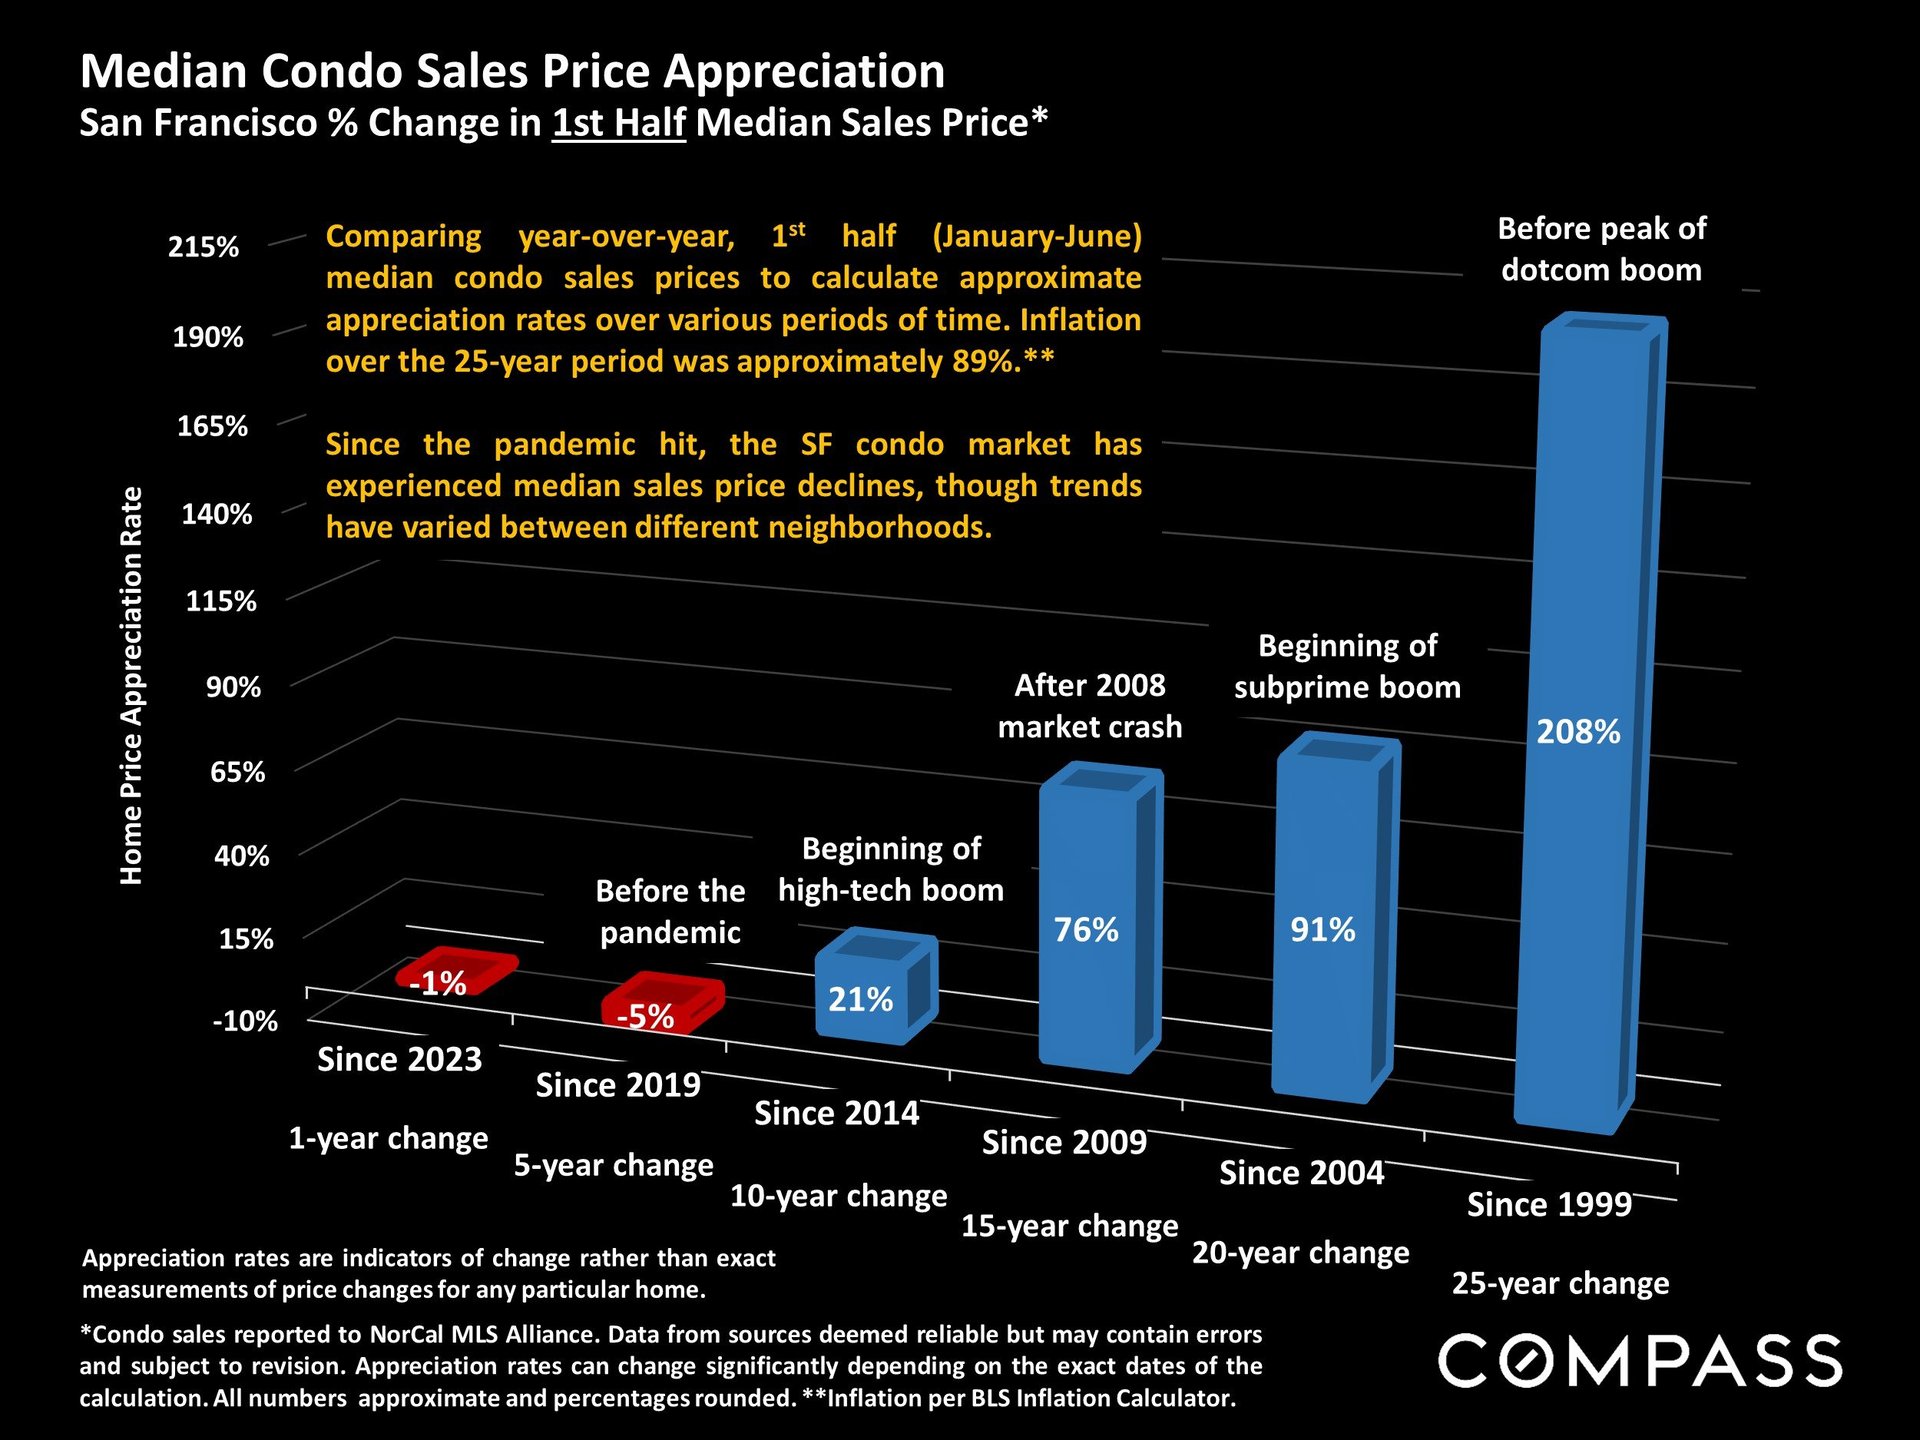
Chart of San Francisco condo price appreciation, showing a 208% increase over 25 years and recent declines.
 
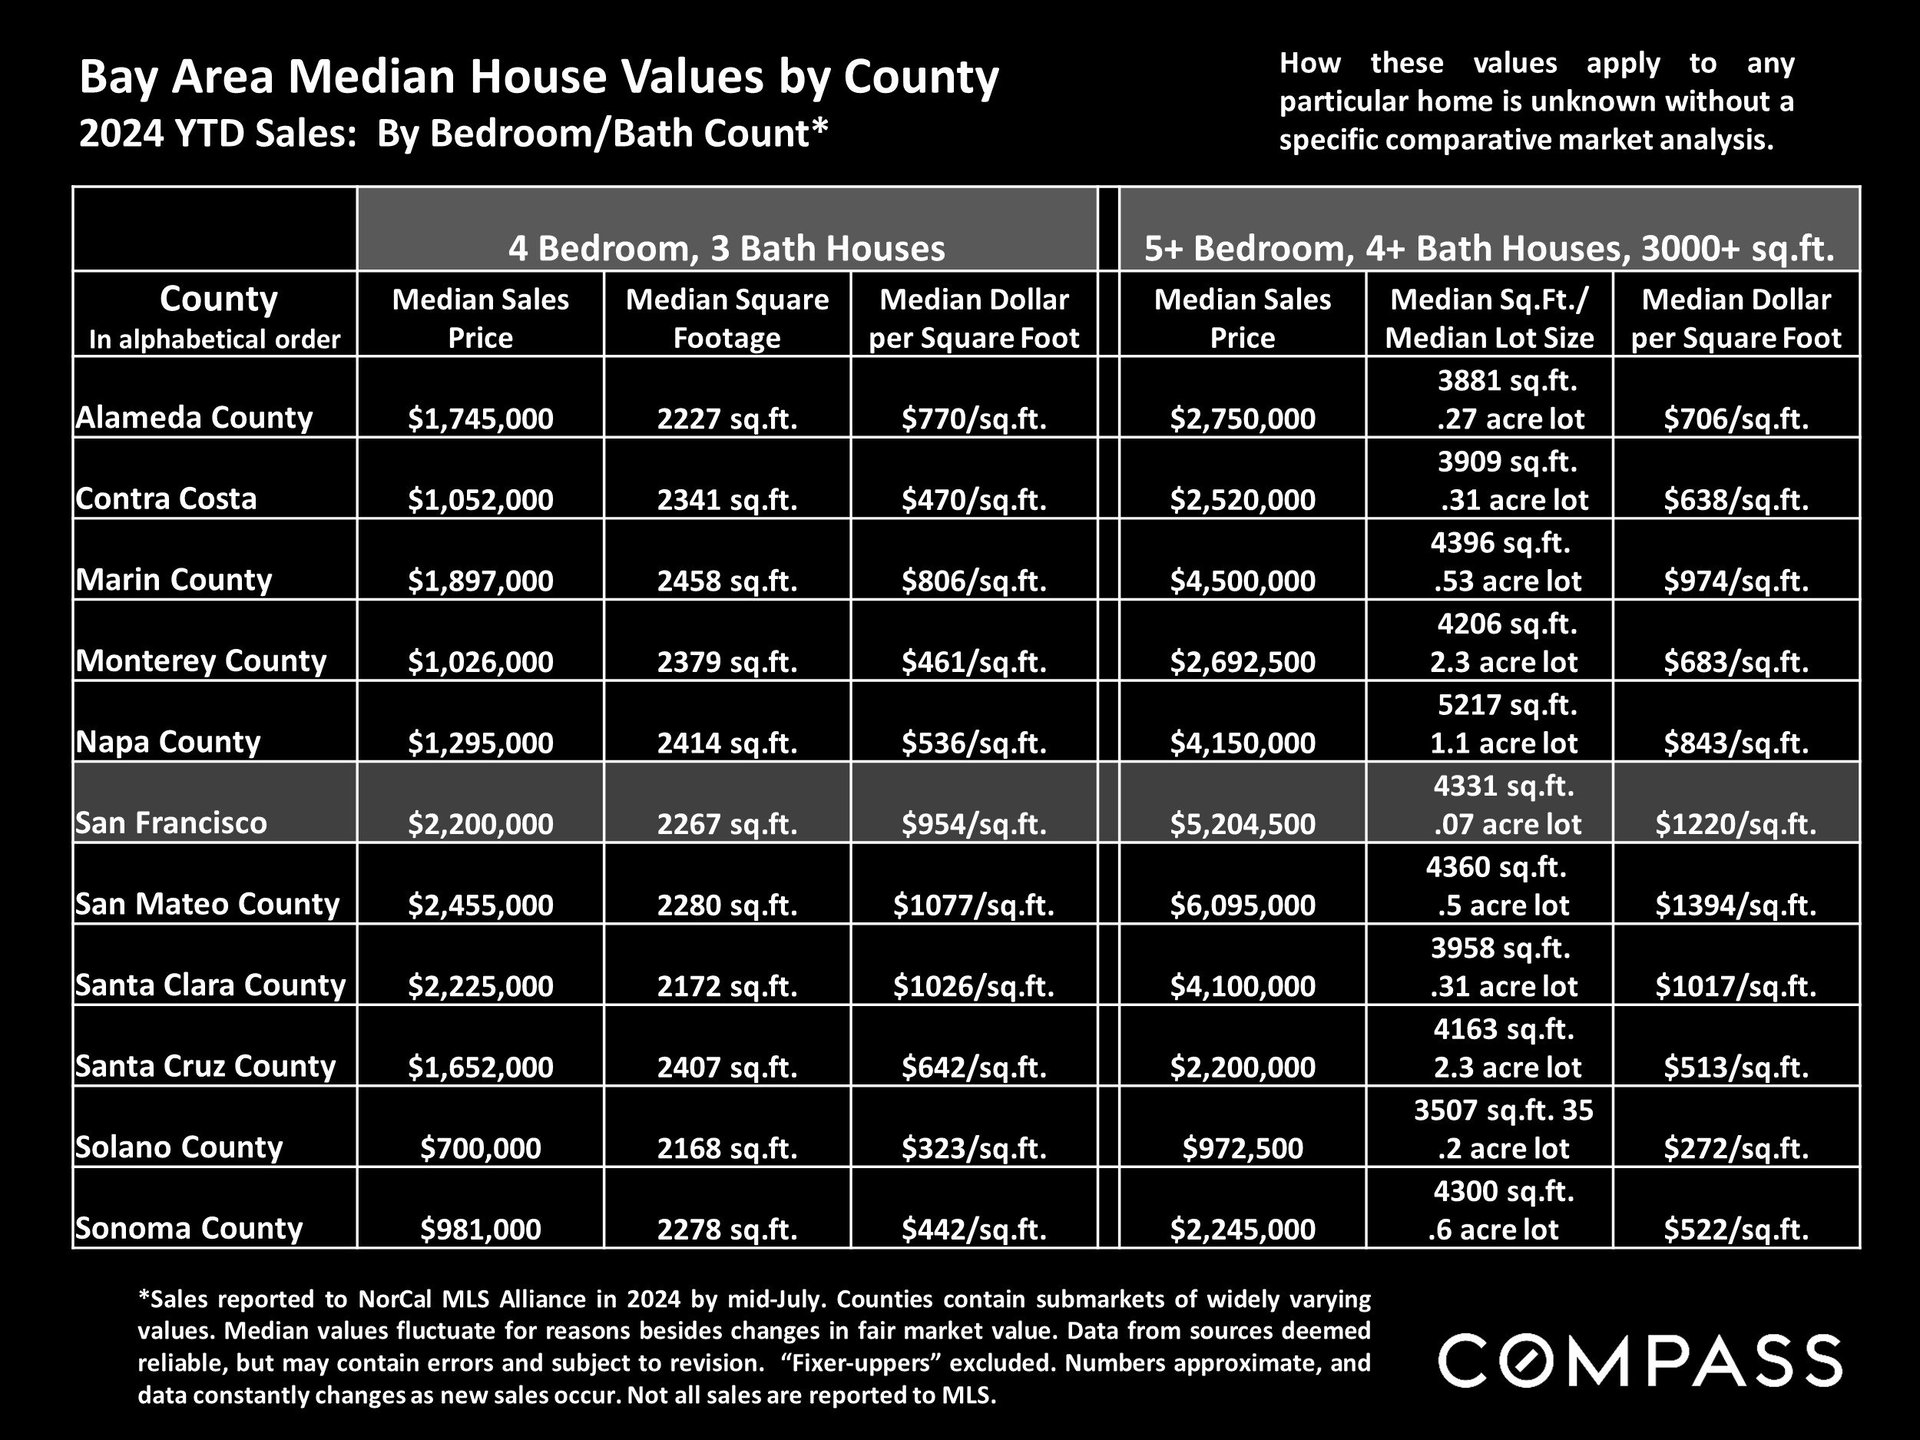
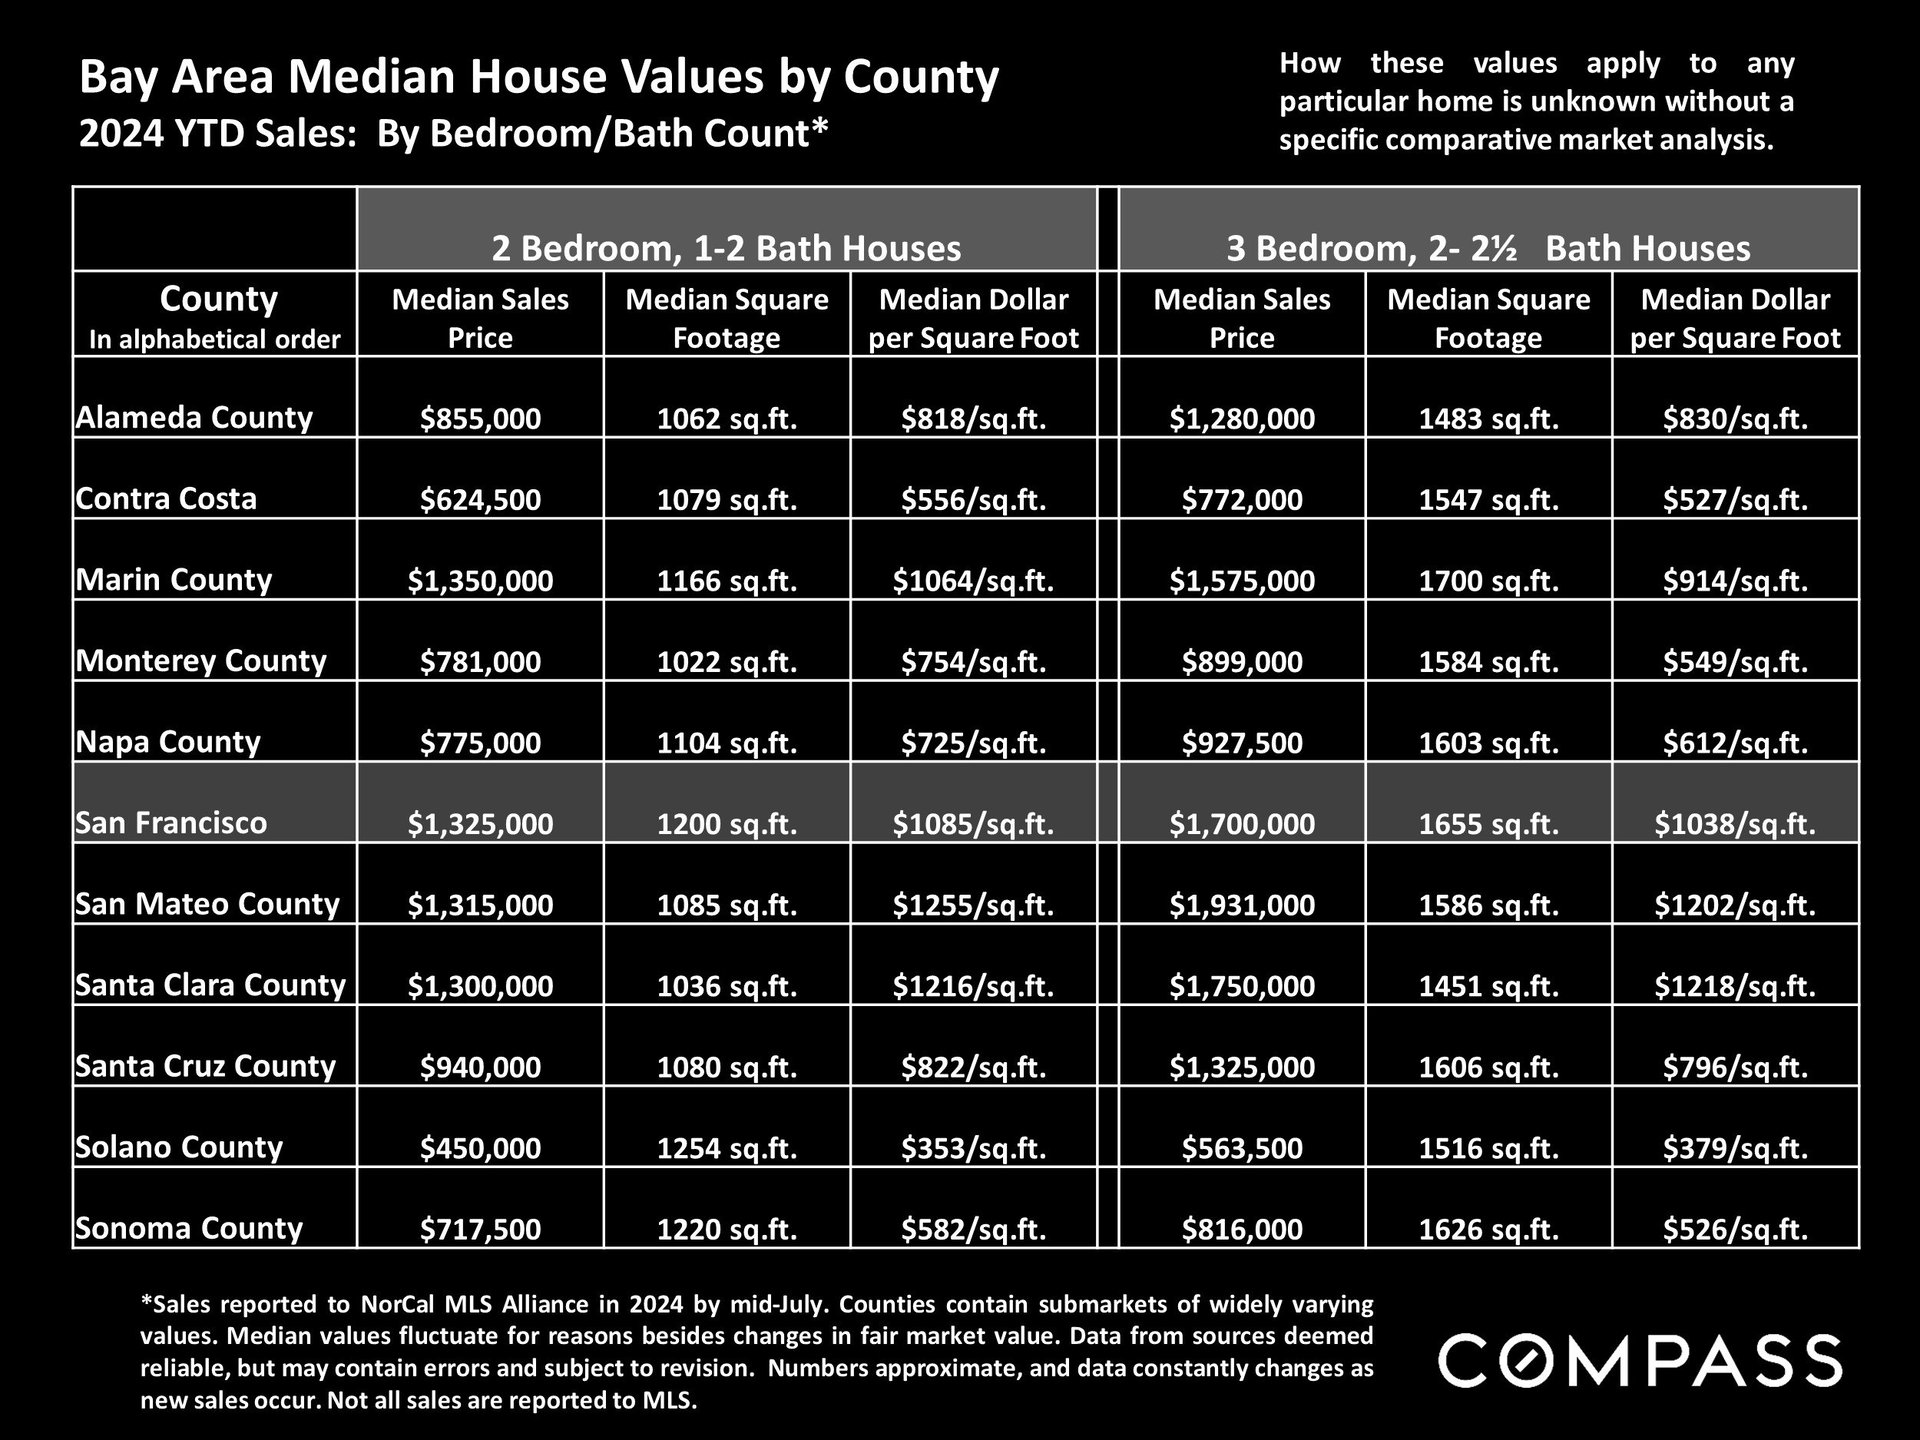
Table comparing 2024 median home prices, sizes, and price per square foot across Bay Area counties.
 
Bay Area median home values by county, comparing sale prices, square footage, and price per square foot by bedroom and bath count.
 
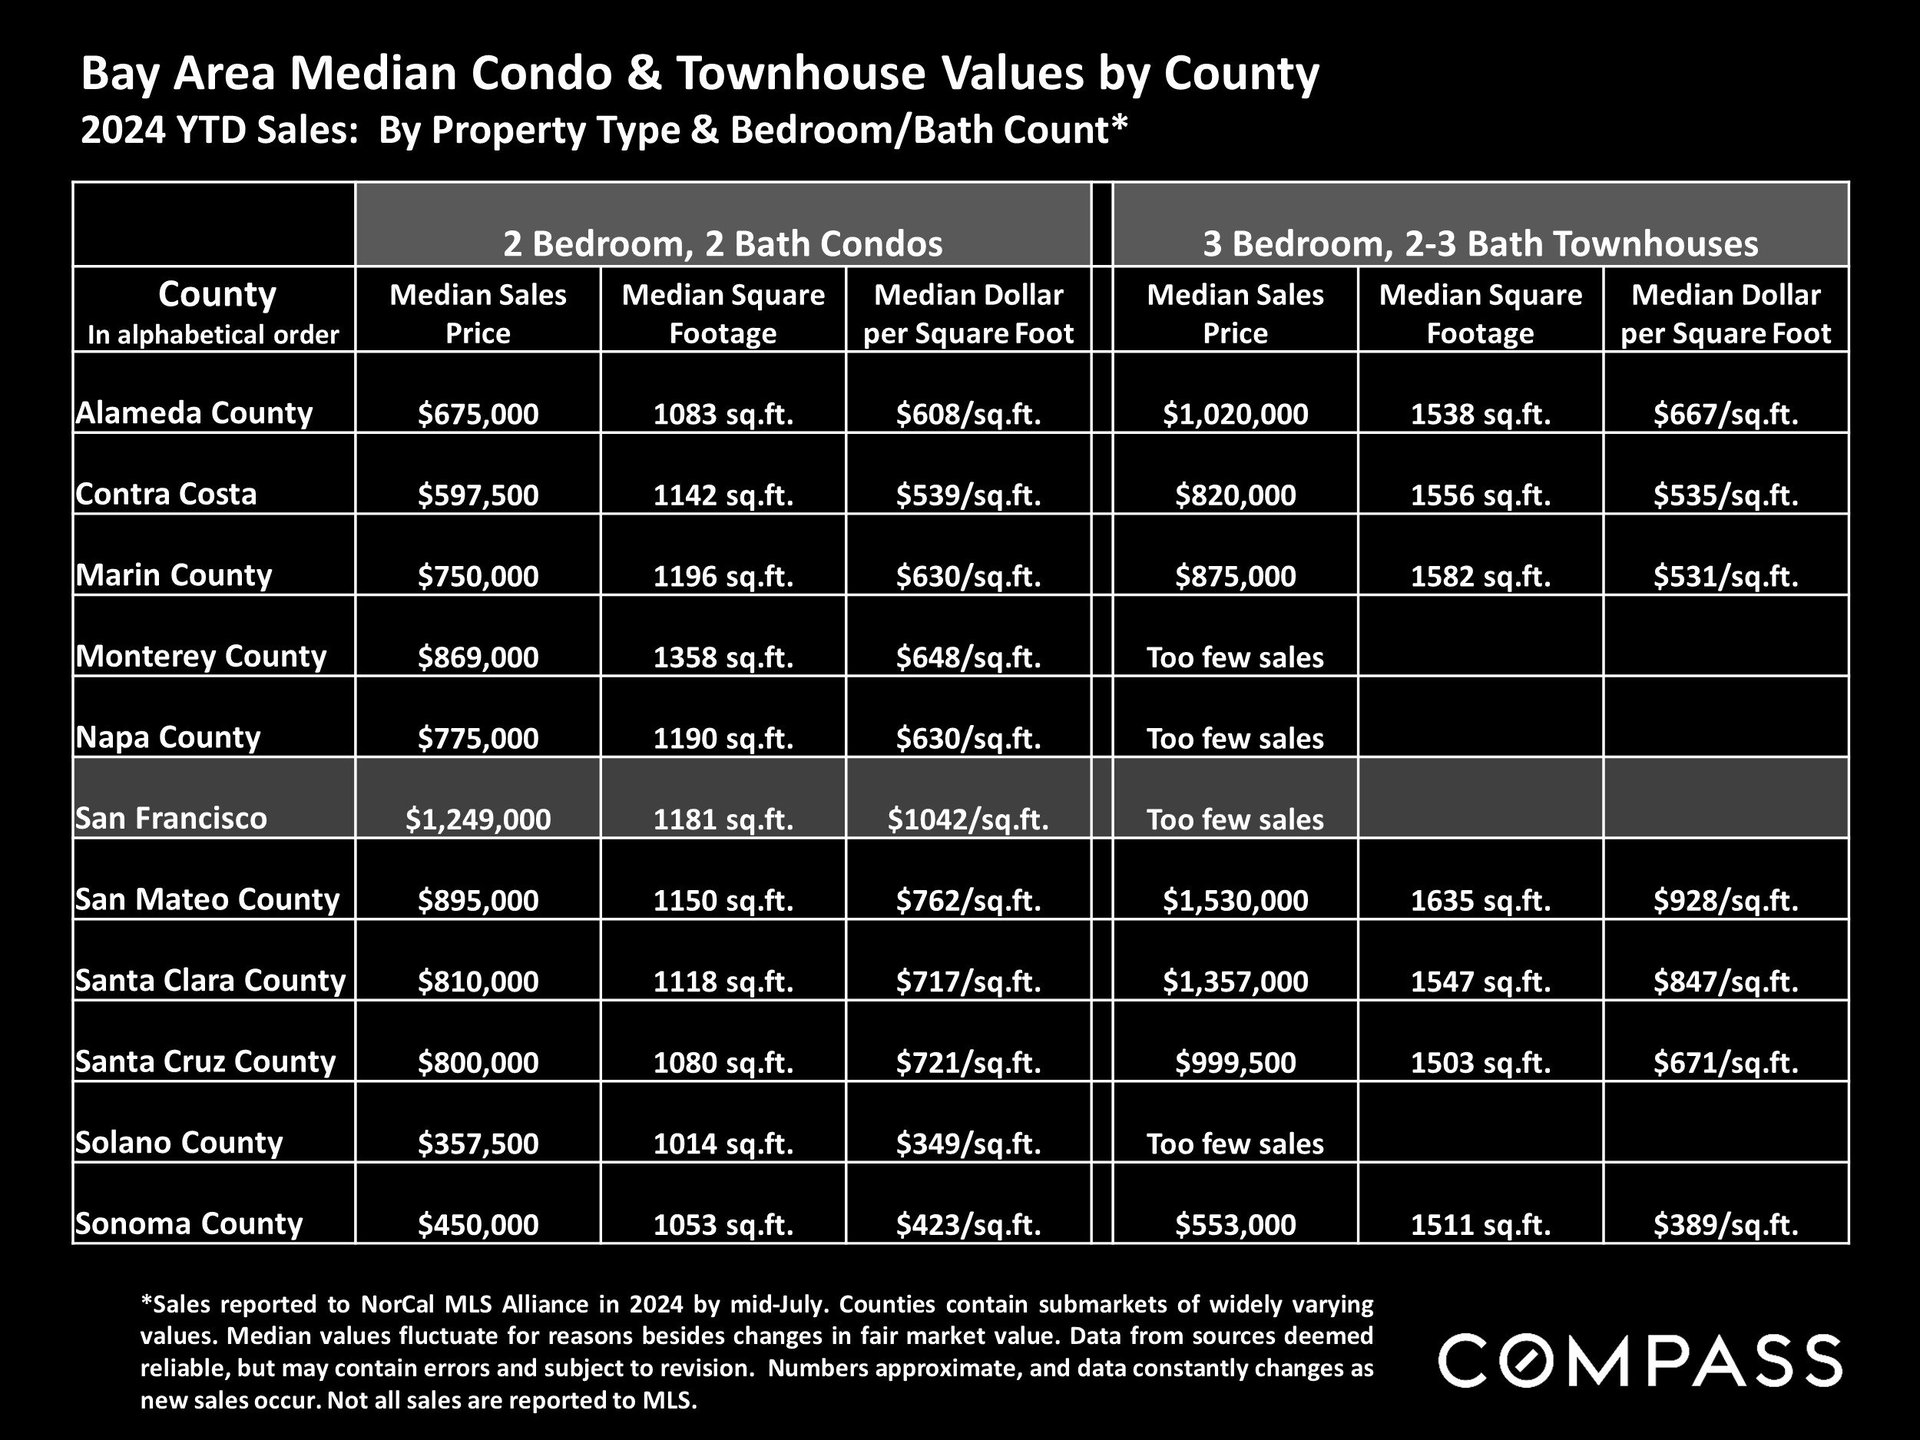
Bay Area county condo and townhouse value table for 2024, with median prices, square footage, and price per square foot.
 
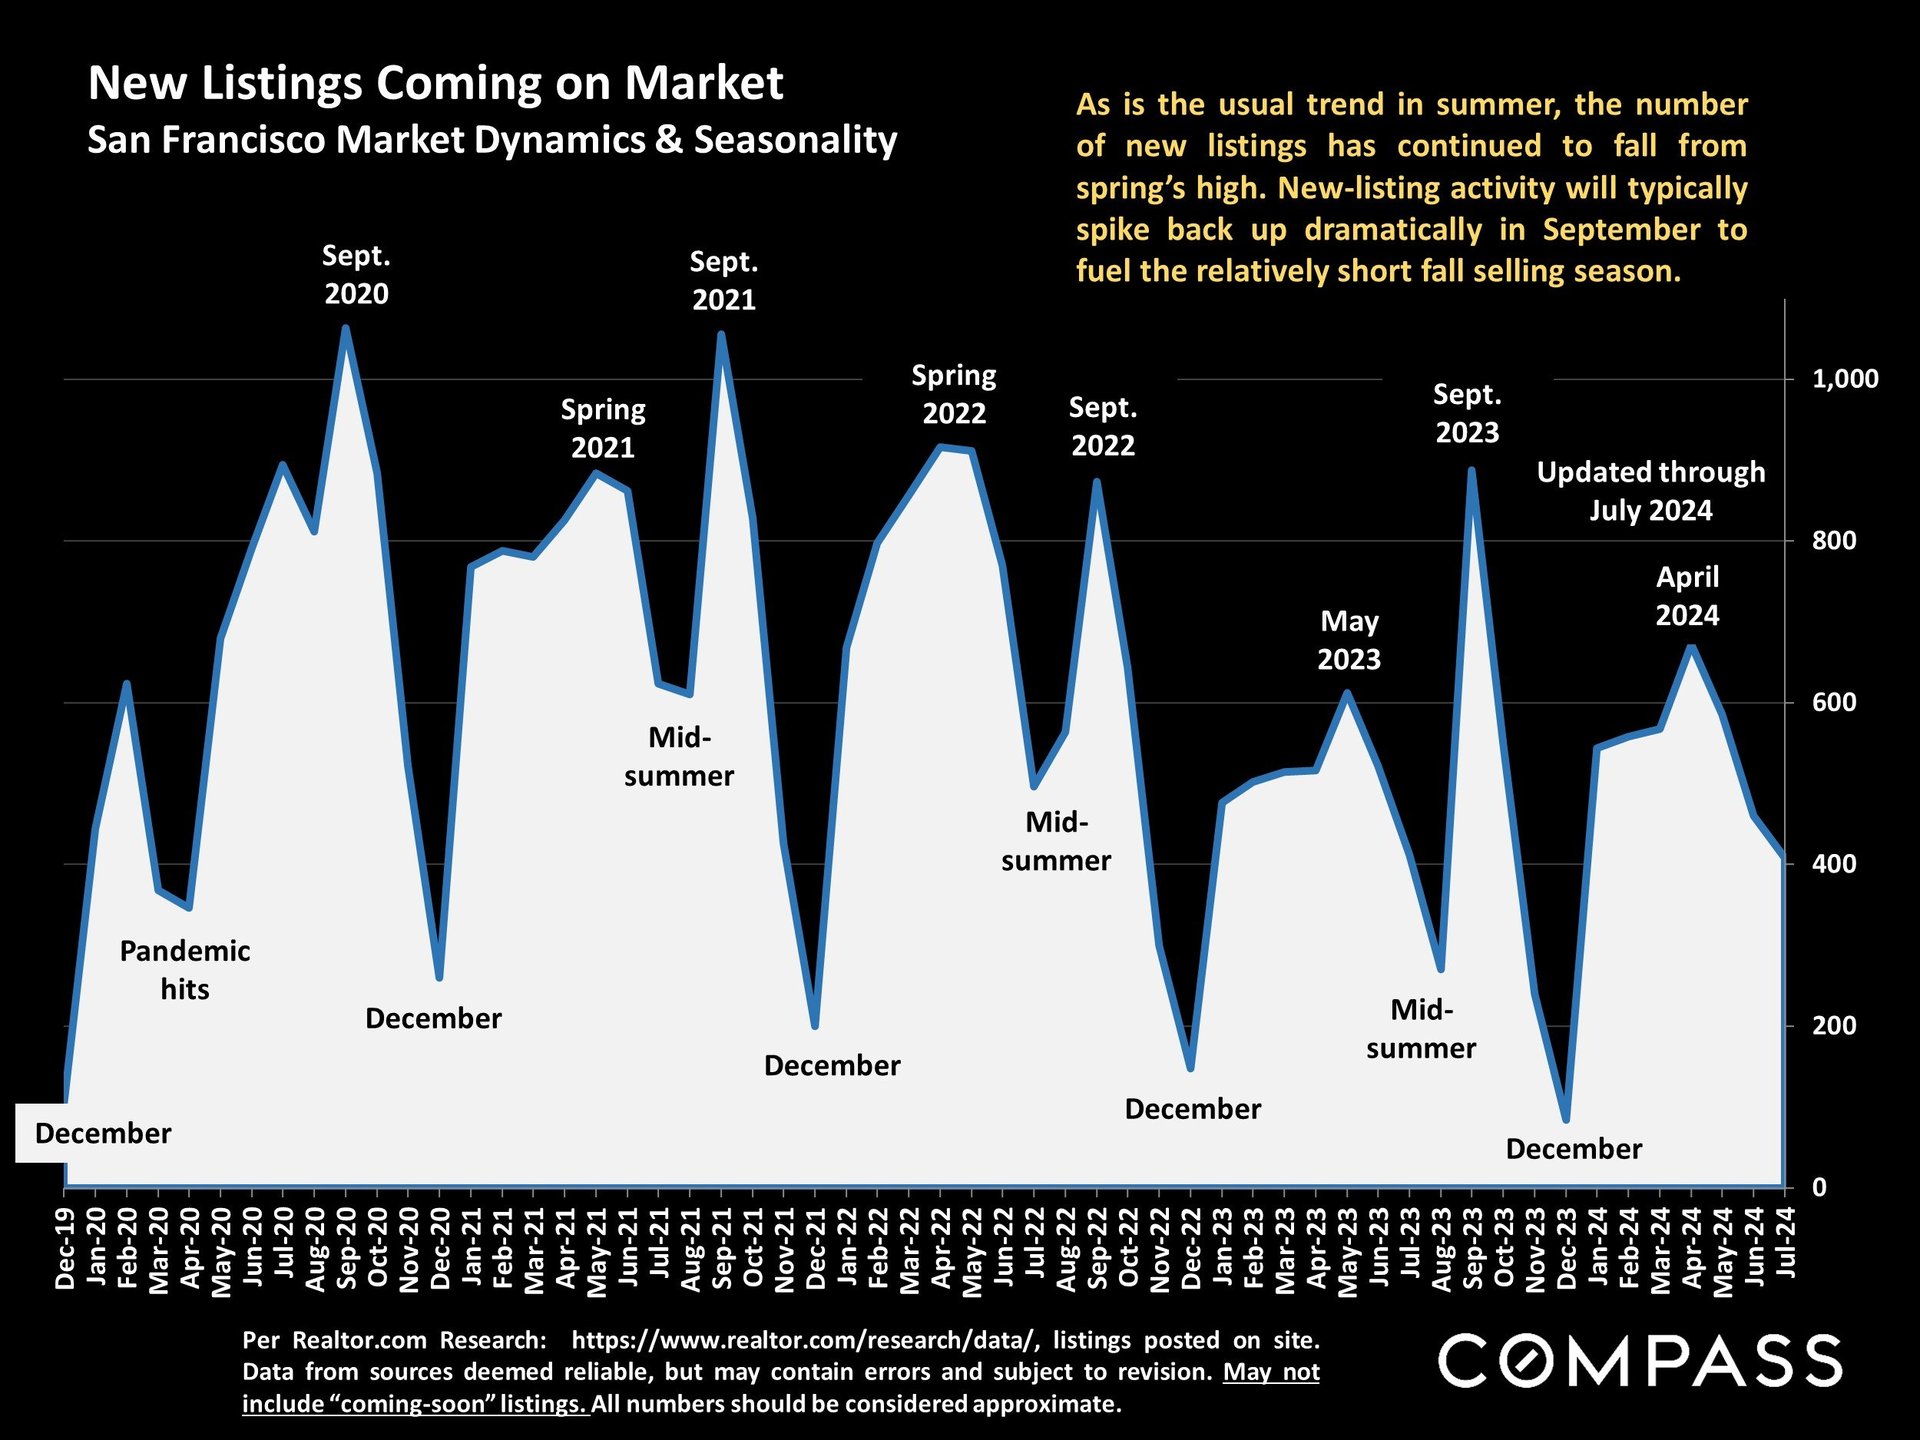
Chart of San Francisco new listings, showing seasonal peaks and December lows from December 2019 through July 2024.
 
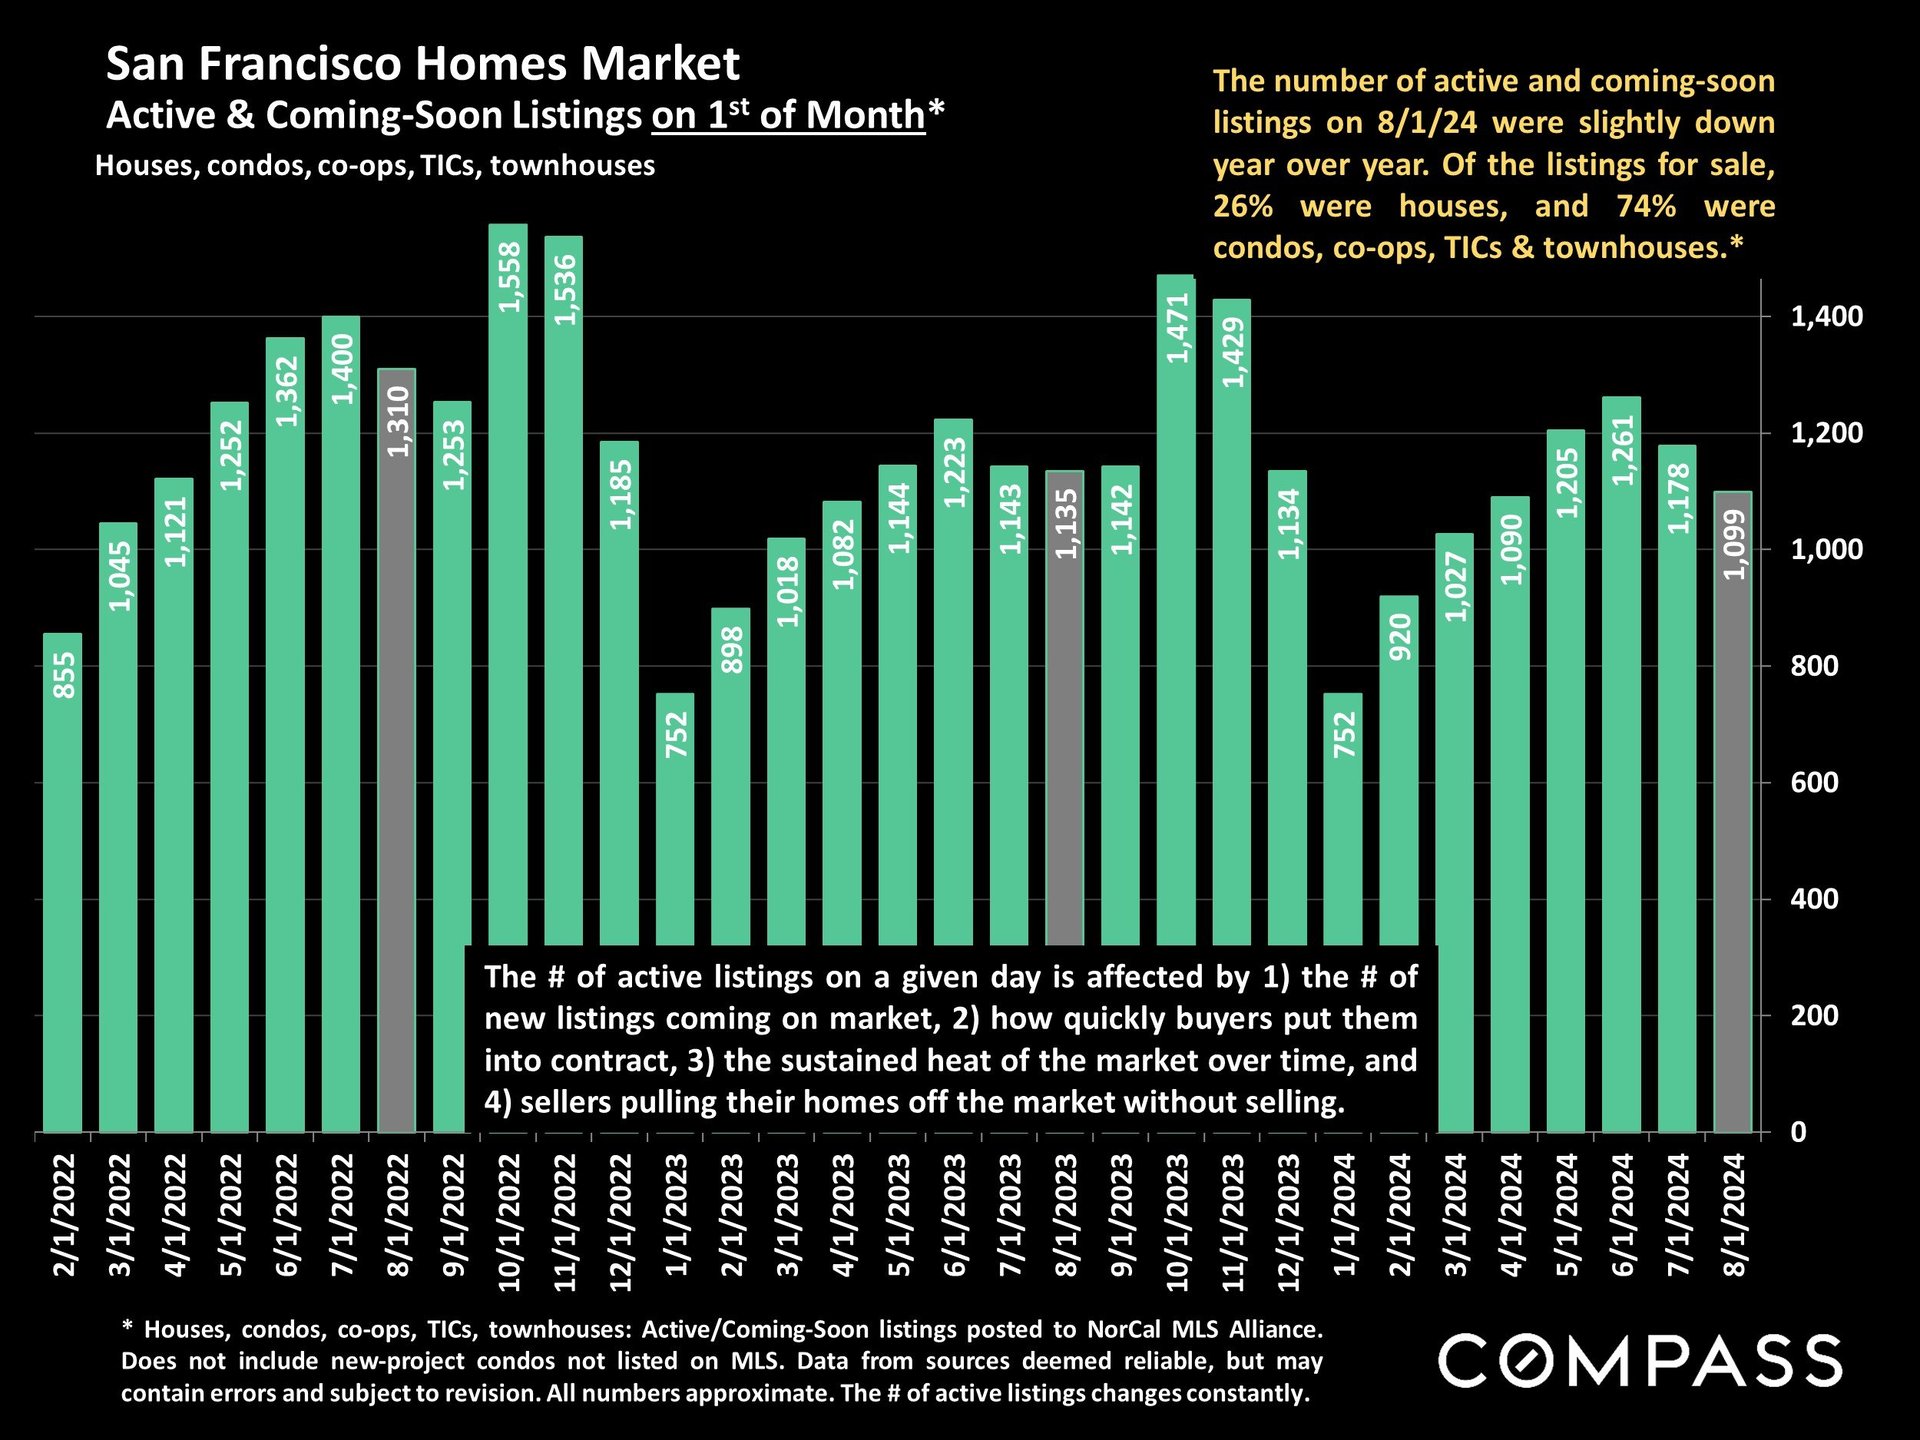
San Francisco active and coming-soon listing counts by month, February 2022 to August 2024.
 
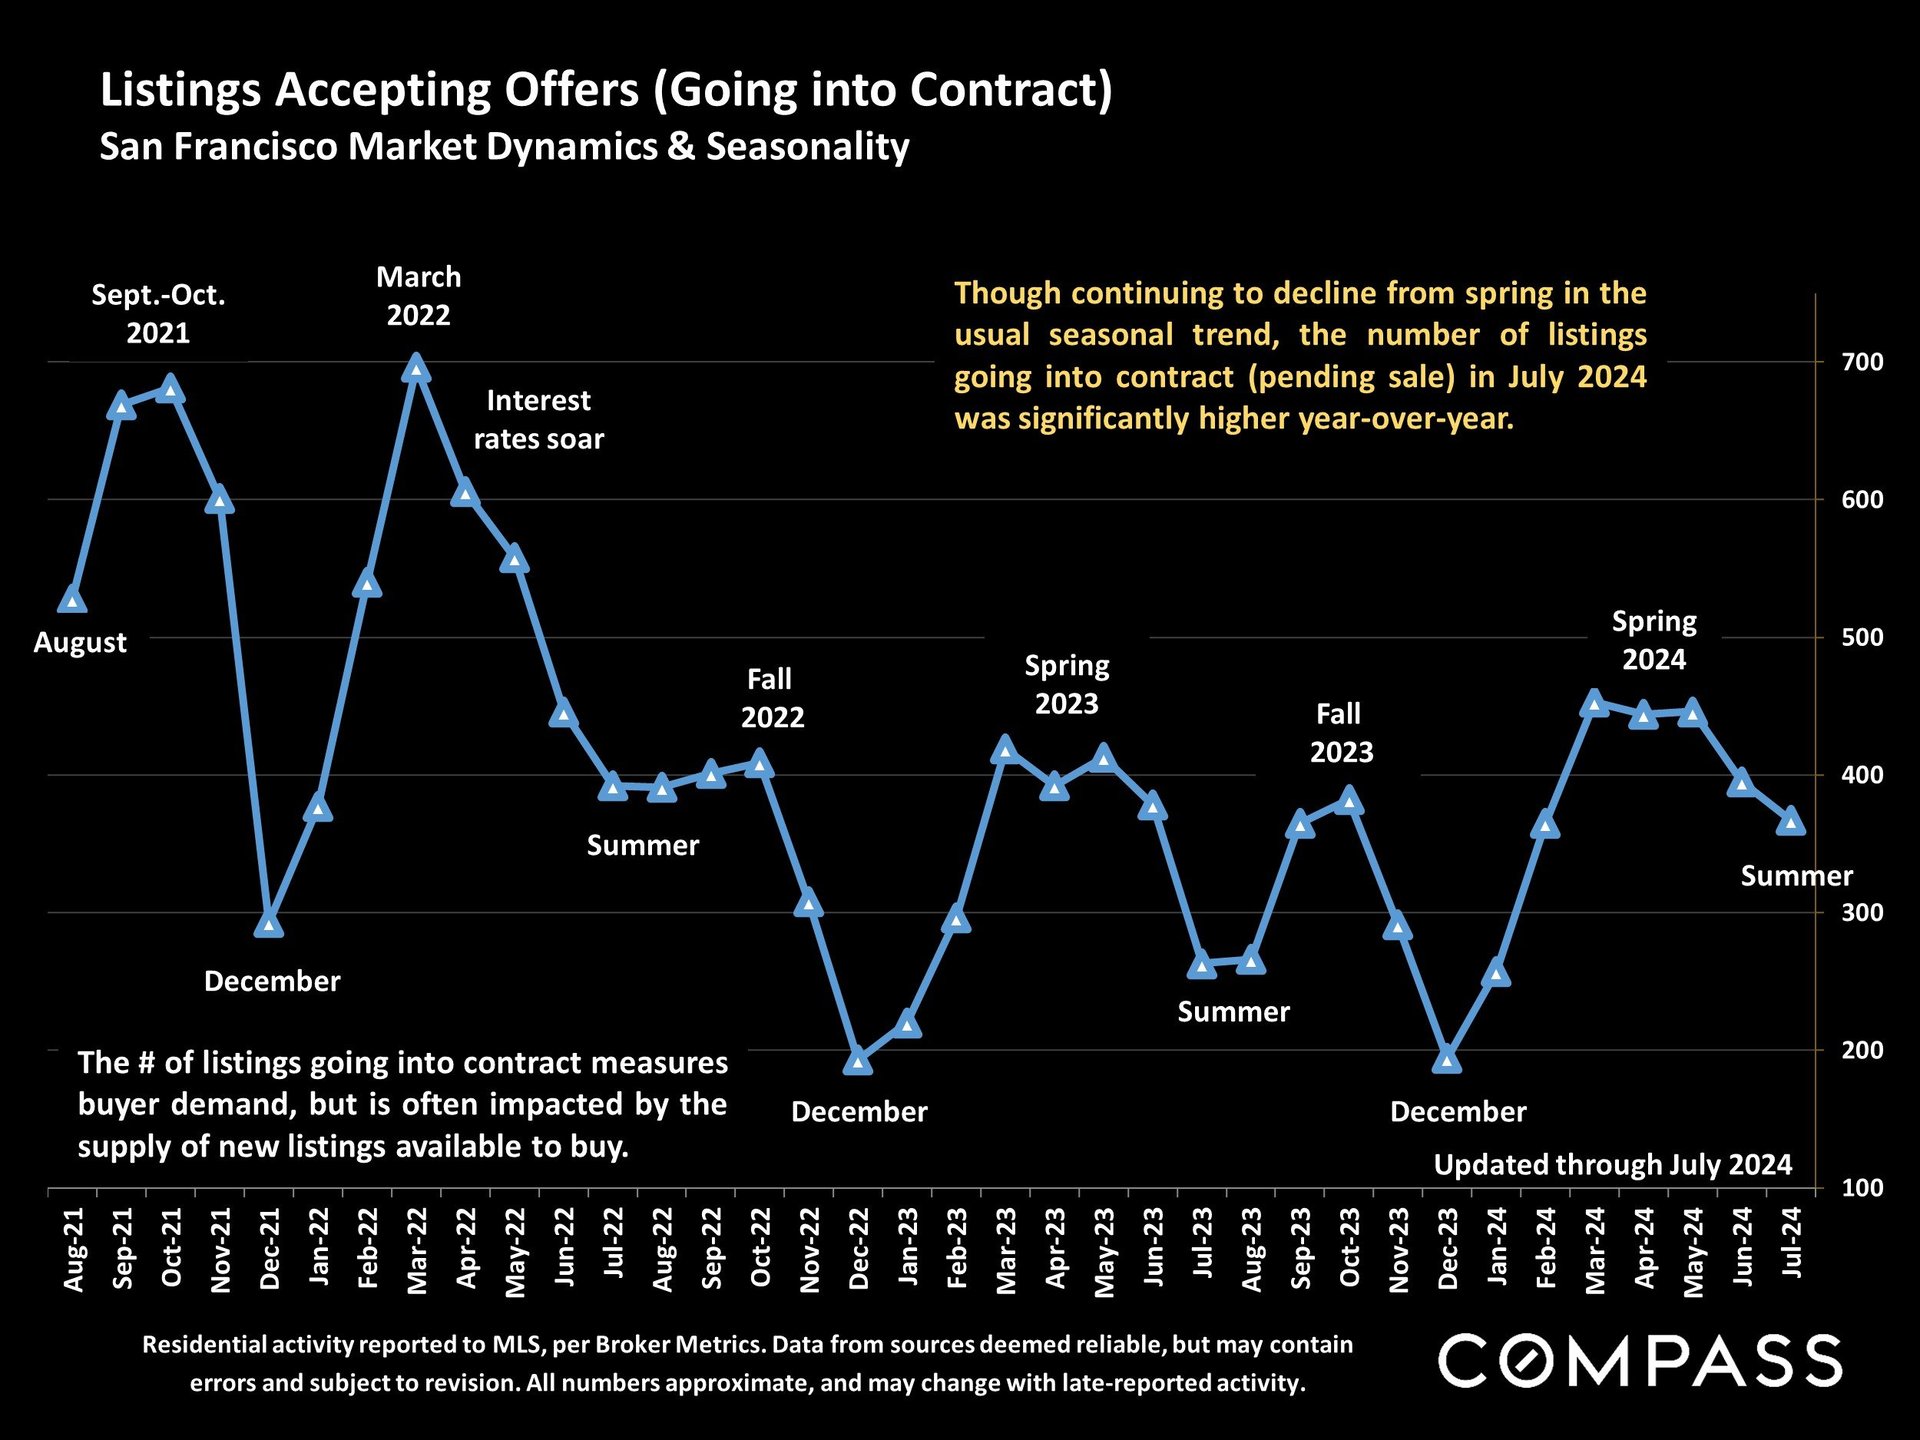
Chart of San Francisco listings going into contract, showing monthly counts from August 2021 through July 2024.
 
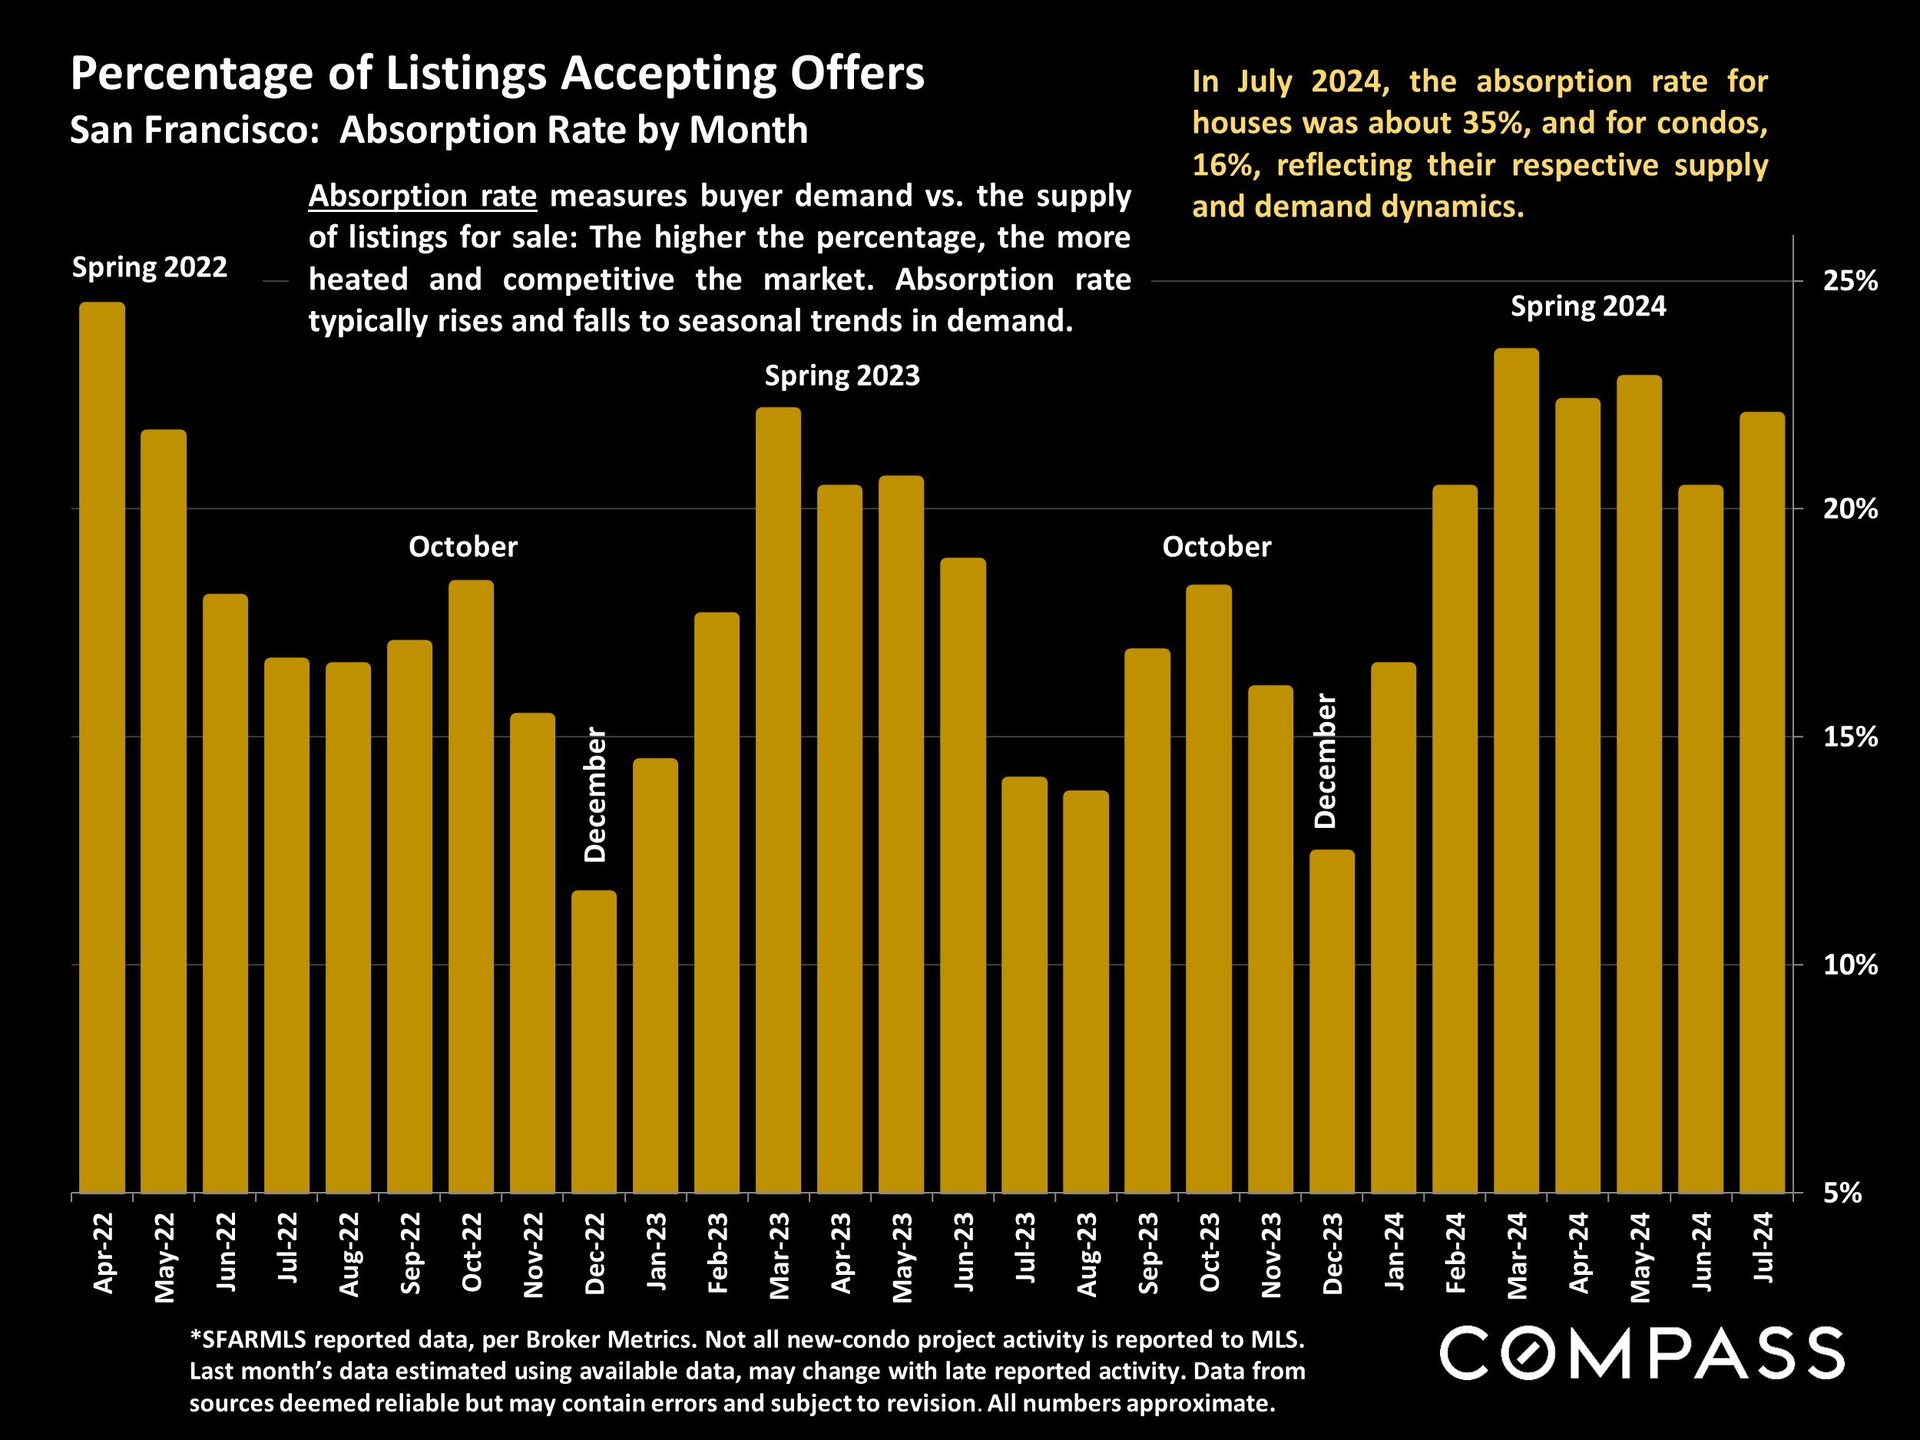
Bar chart of San Francisco monthly absorption rates, with spring peaks from 2022 to 2024 and July 2024 housing figures.
 
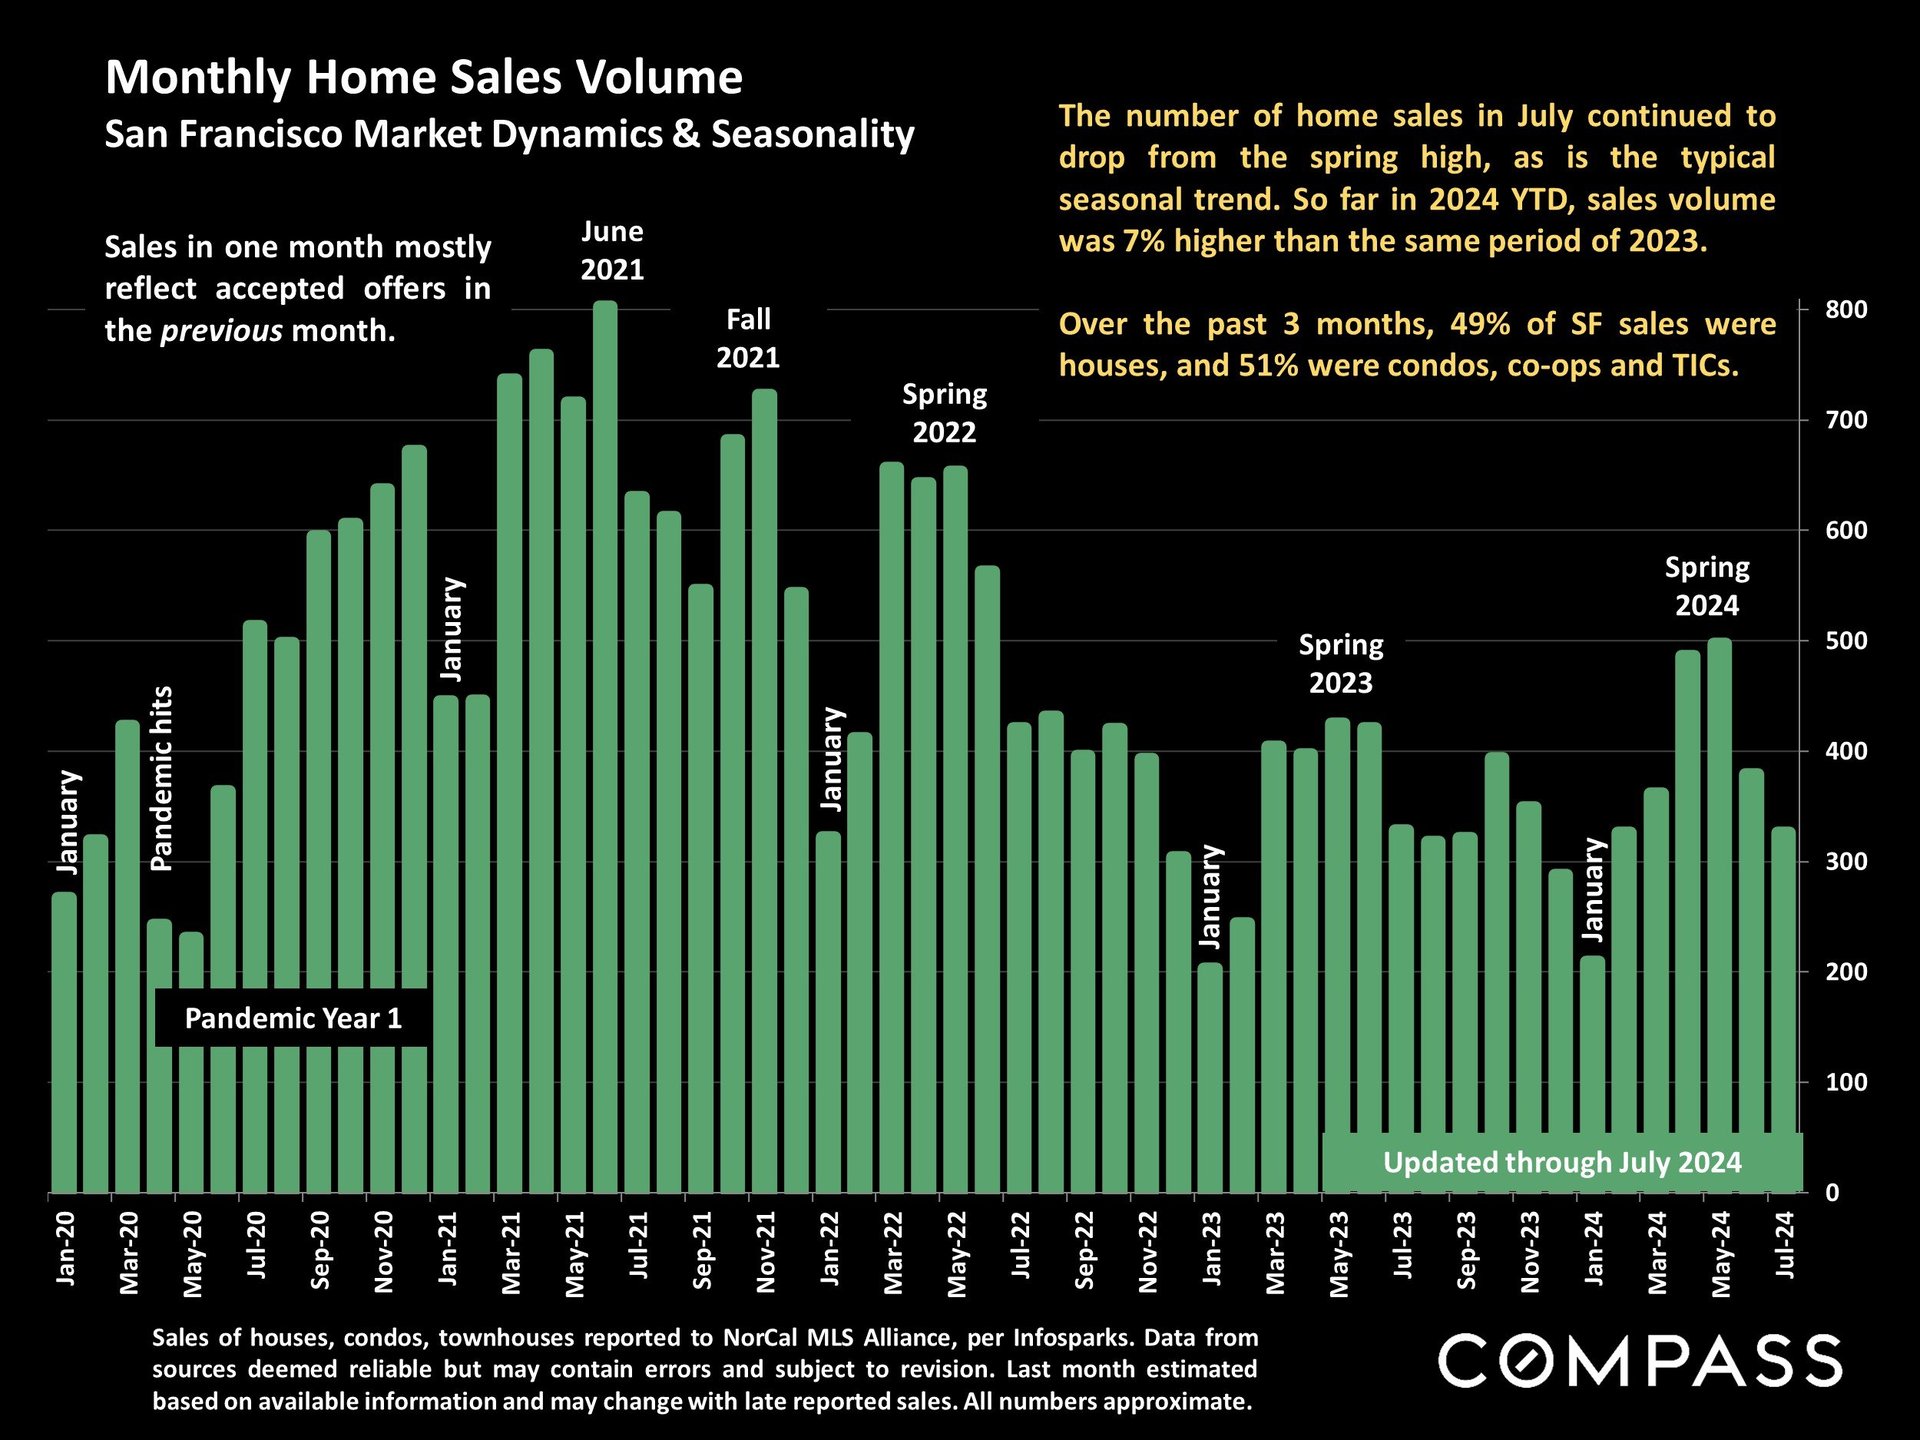
Chart of monthly San Francisco home sales from January 2020 to July 2024, with seasonal peaks and market notes.
 
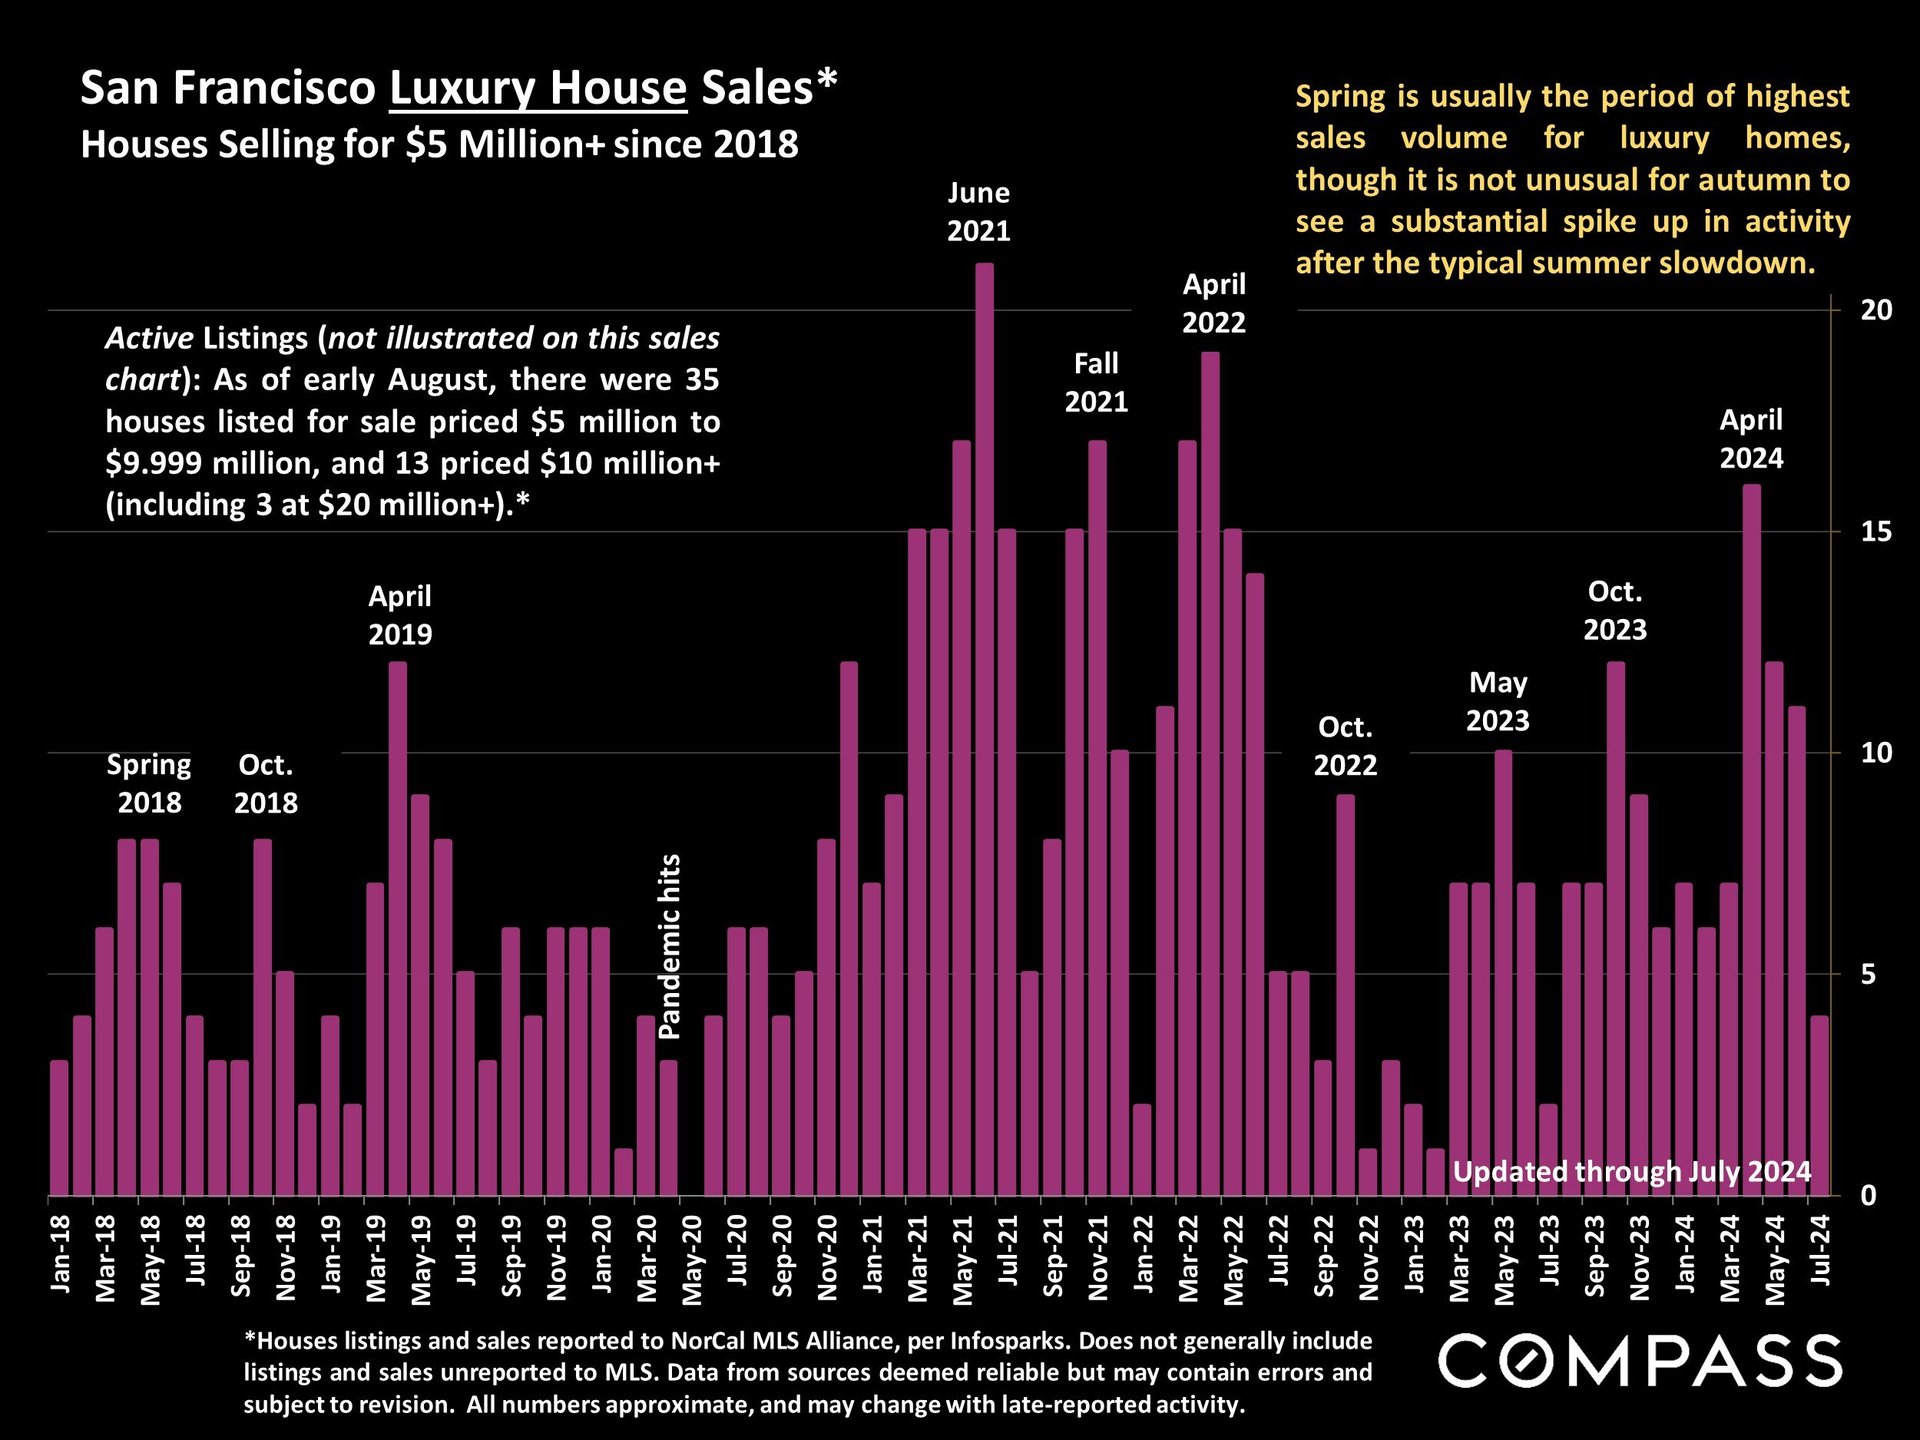
Chart of monthly San Francisco sales of houses priced at $5 million or more, January 2018–July 2024.
 
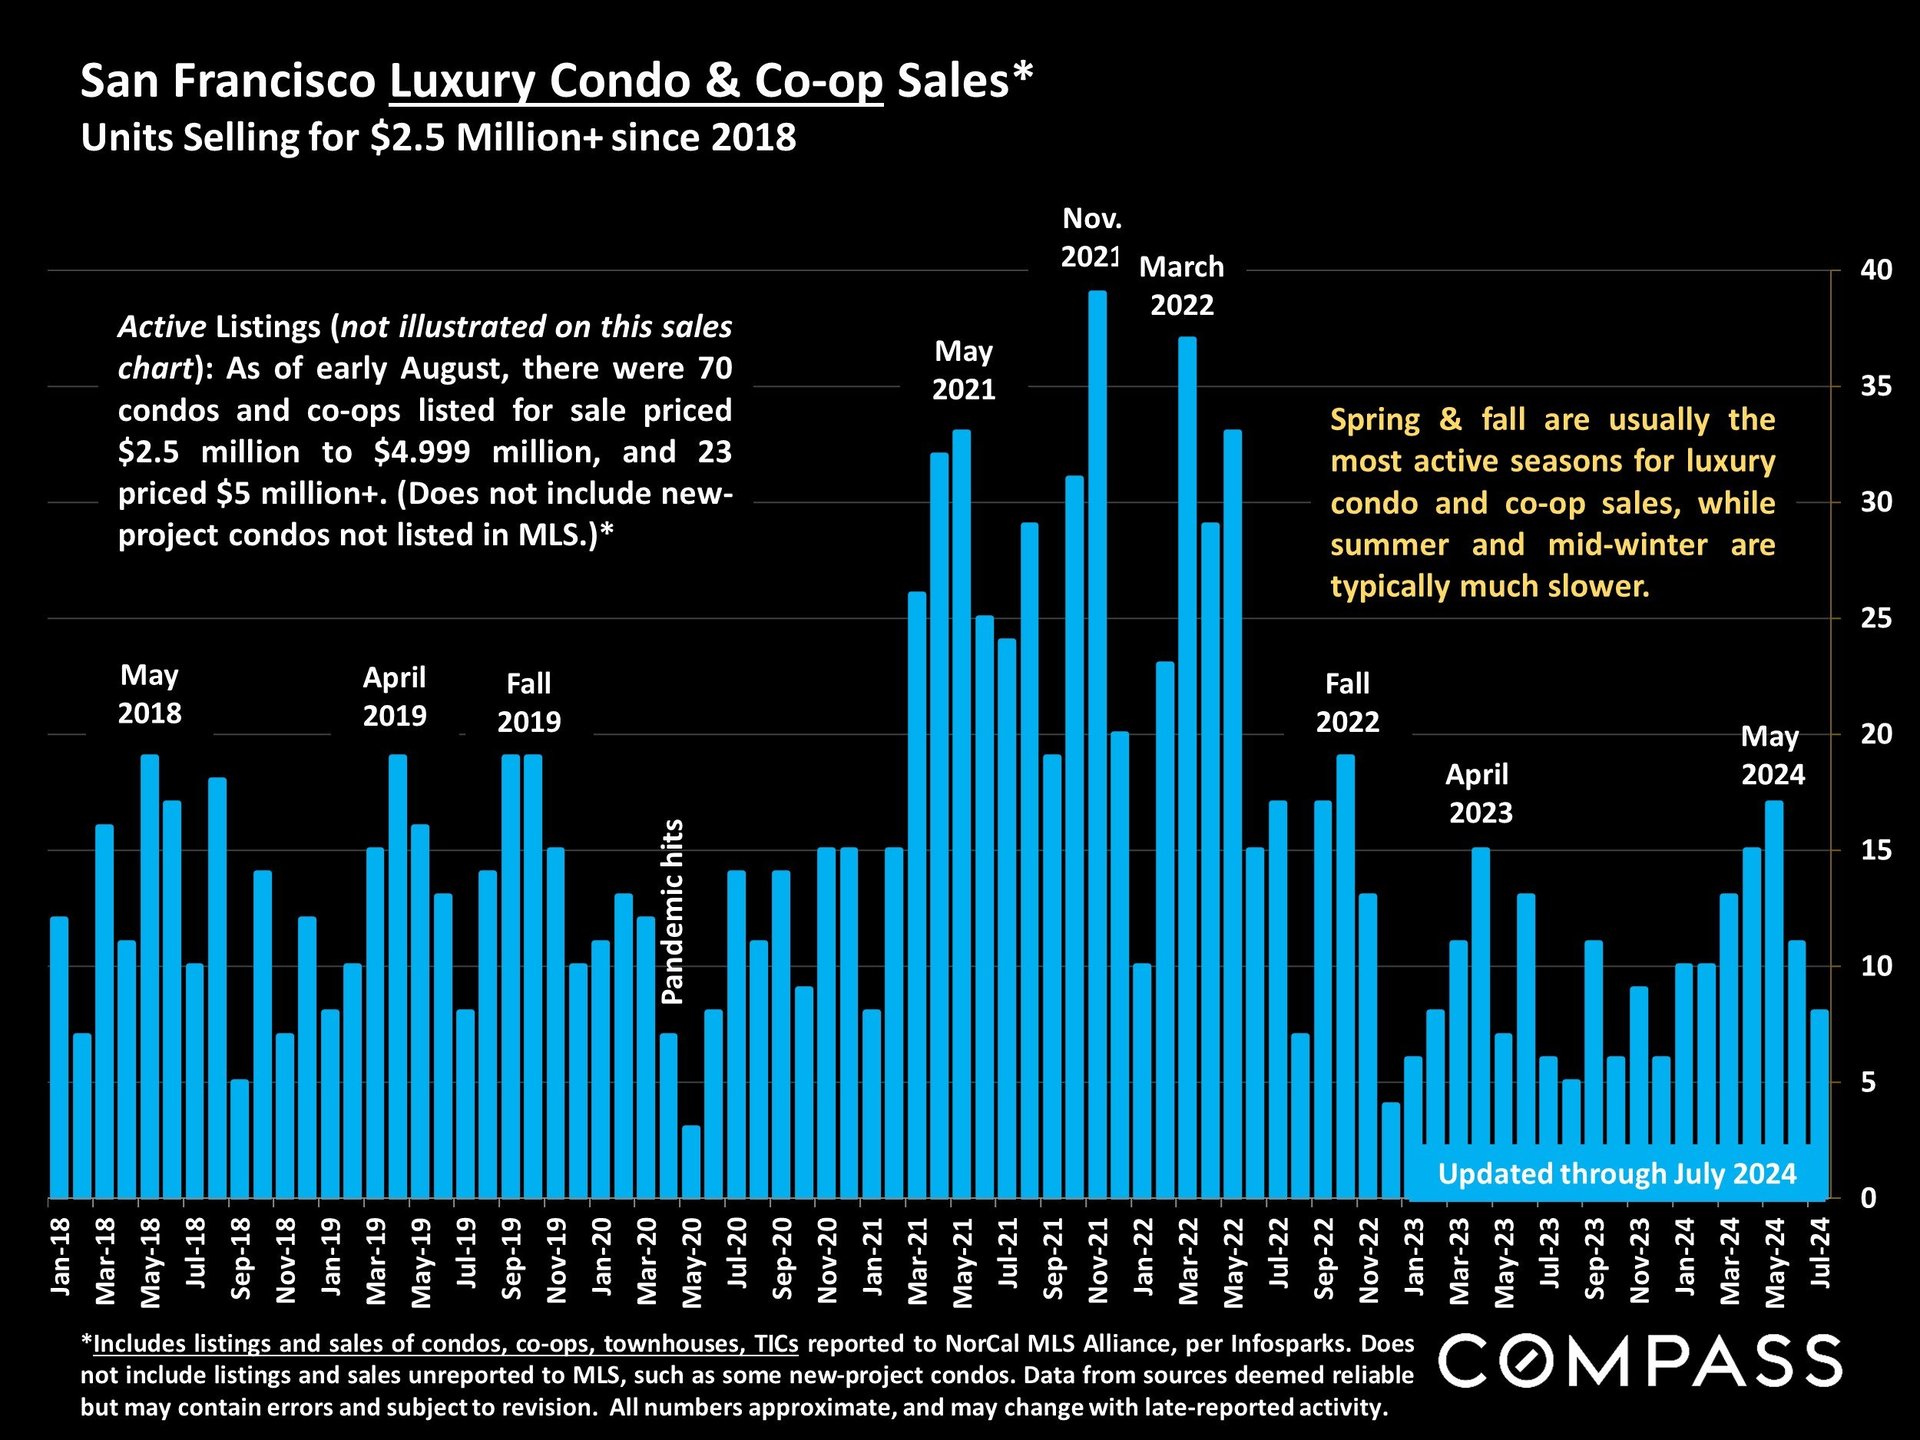
Chart of San Francisco luxury condo and co-op sales above $2.5 million, January 2018–July 2024; spring and fall are busiest.
 
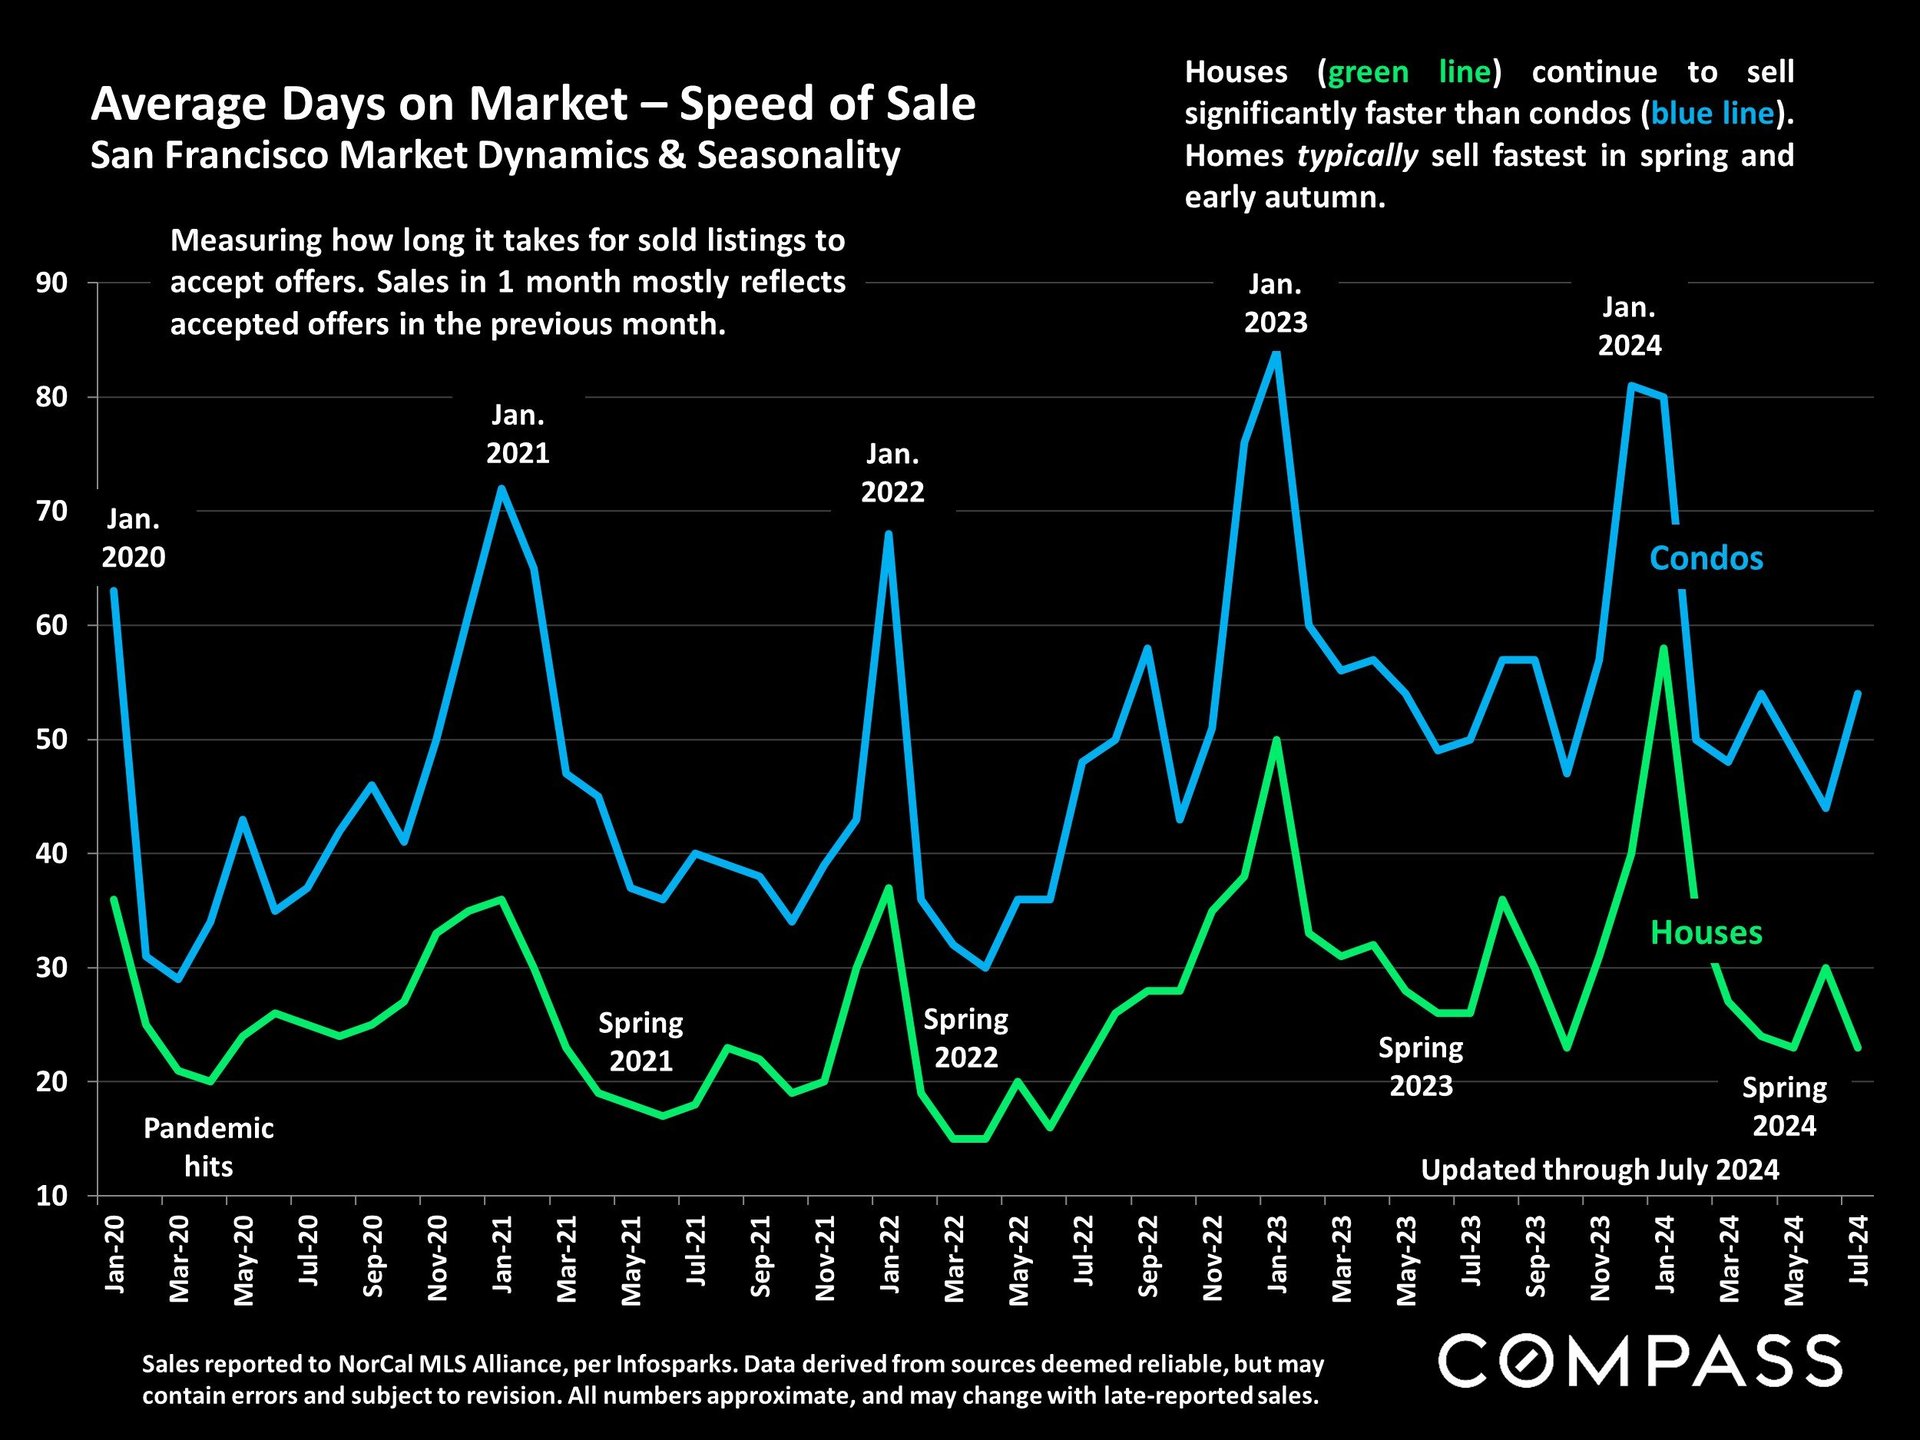
San Francisco average days on market chart comparing houses and condos, January 2020–July 2024.
 
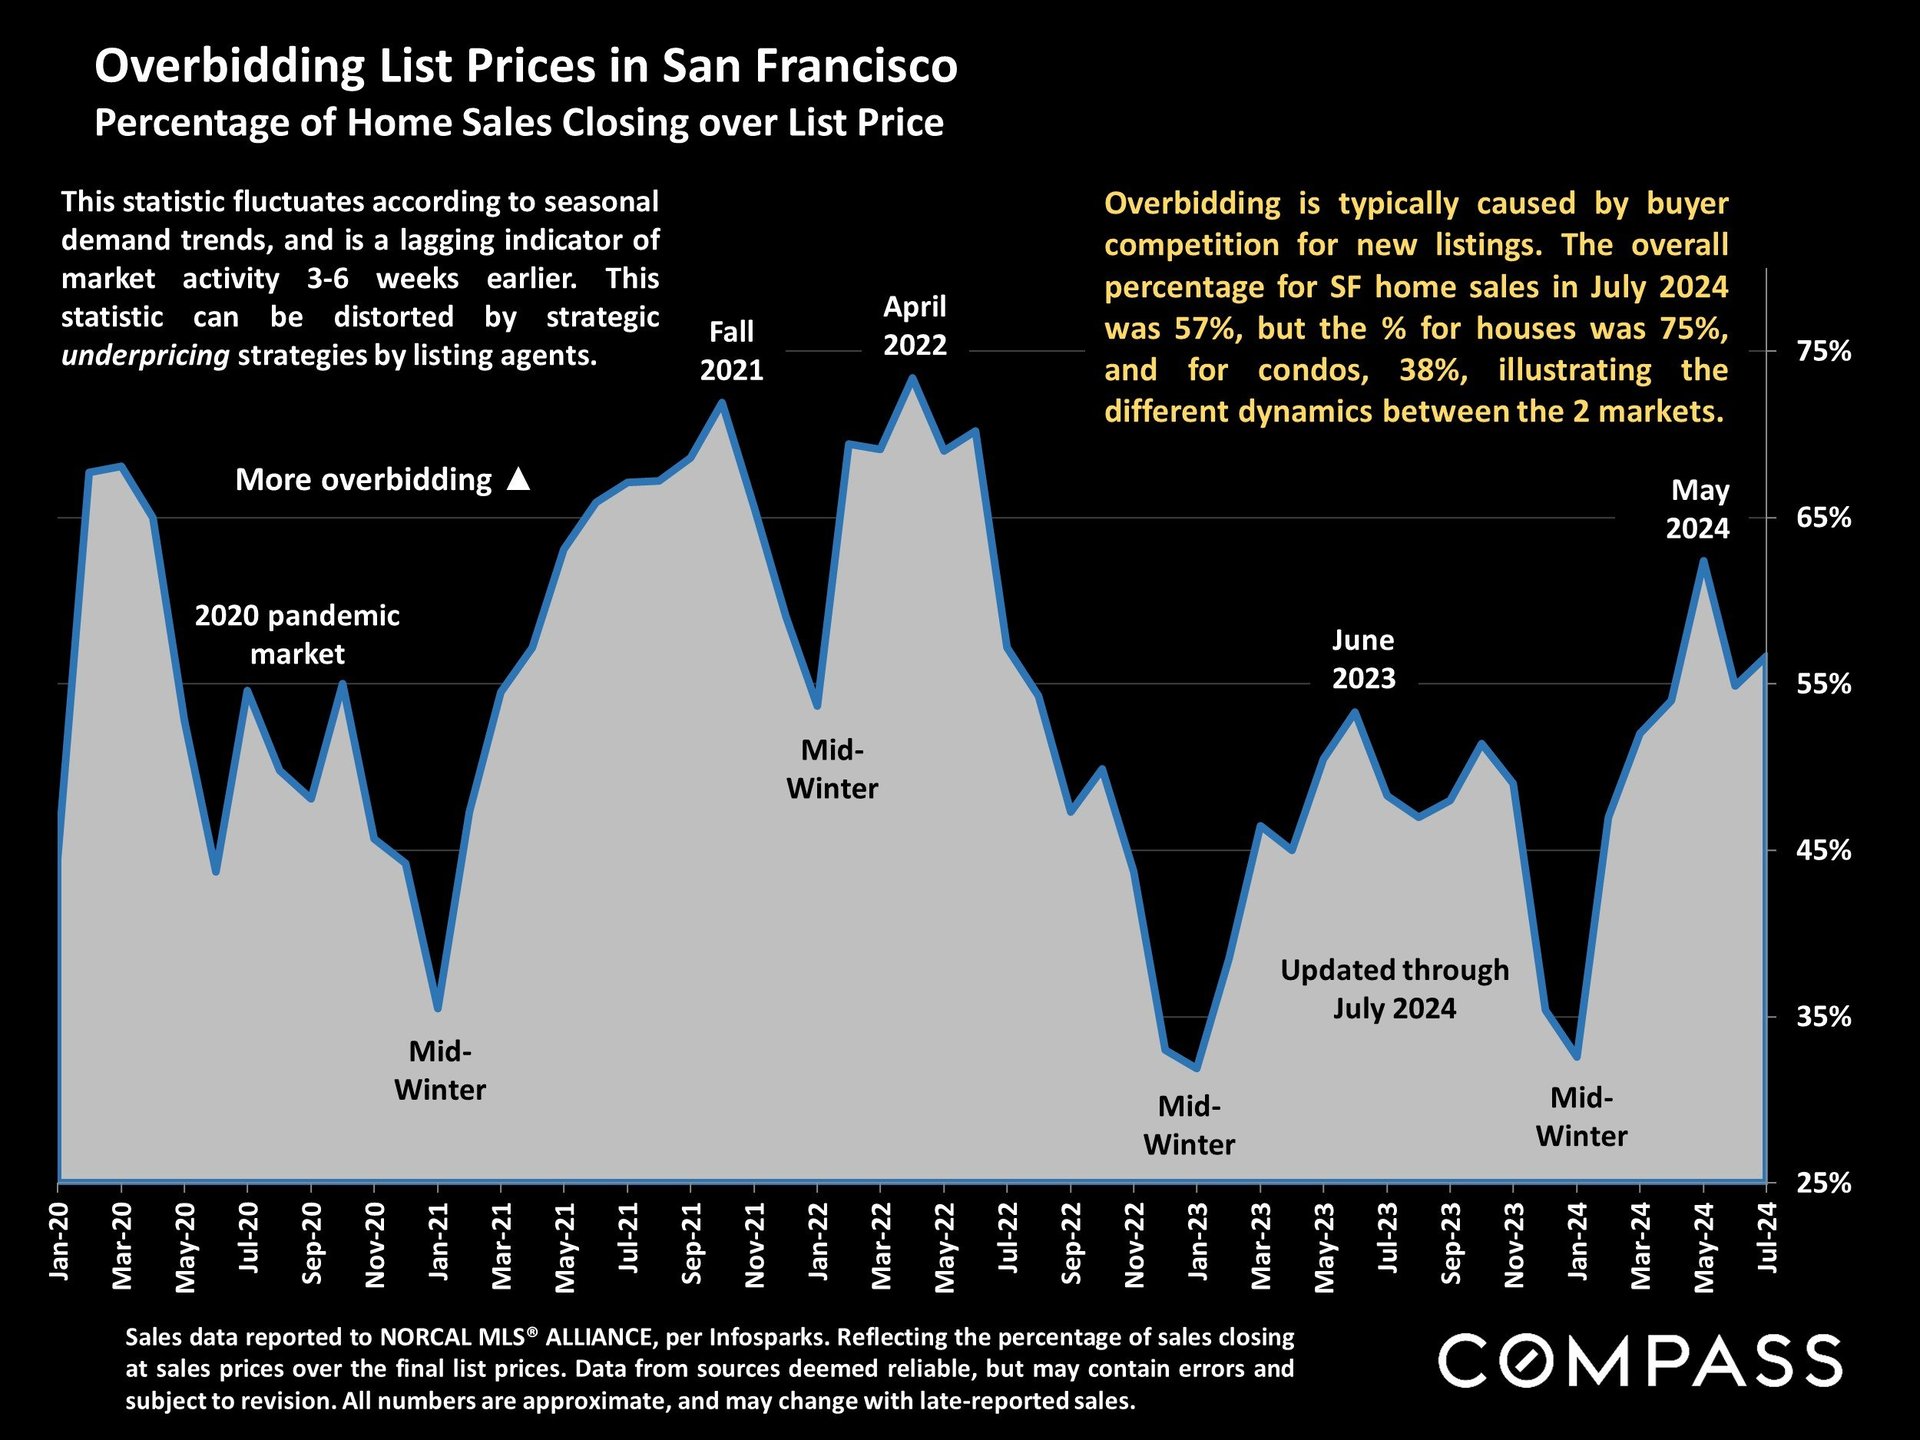
San Francisco over-list-price home sales chart, showing seasonal fluctuations and 57% of sales over list price in July 2024.
 
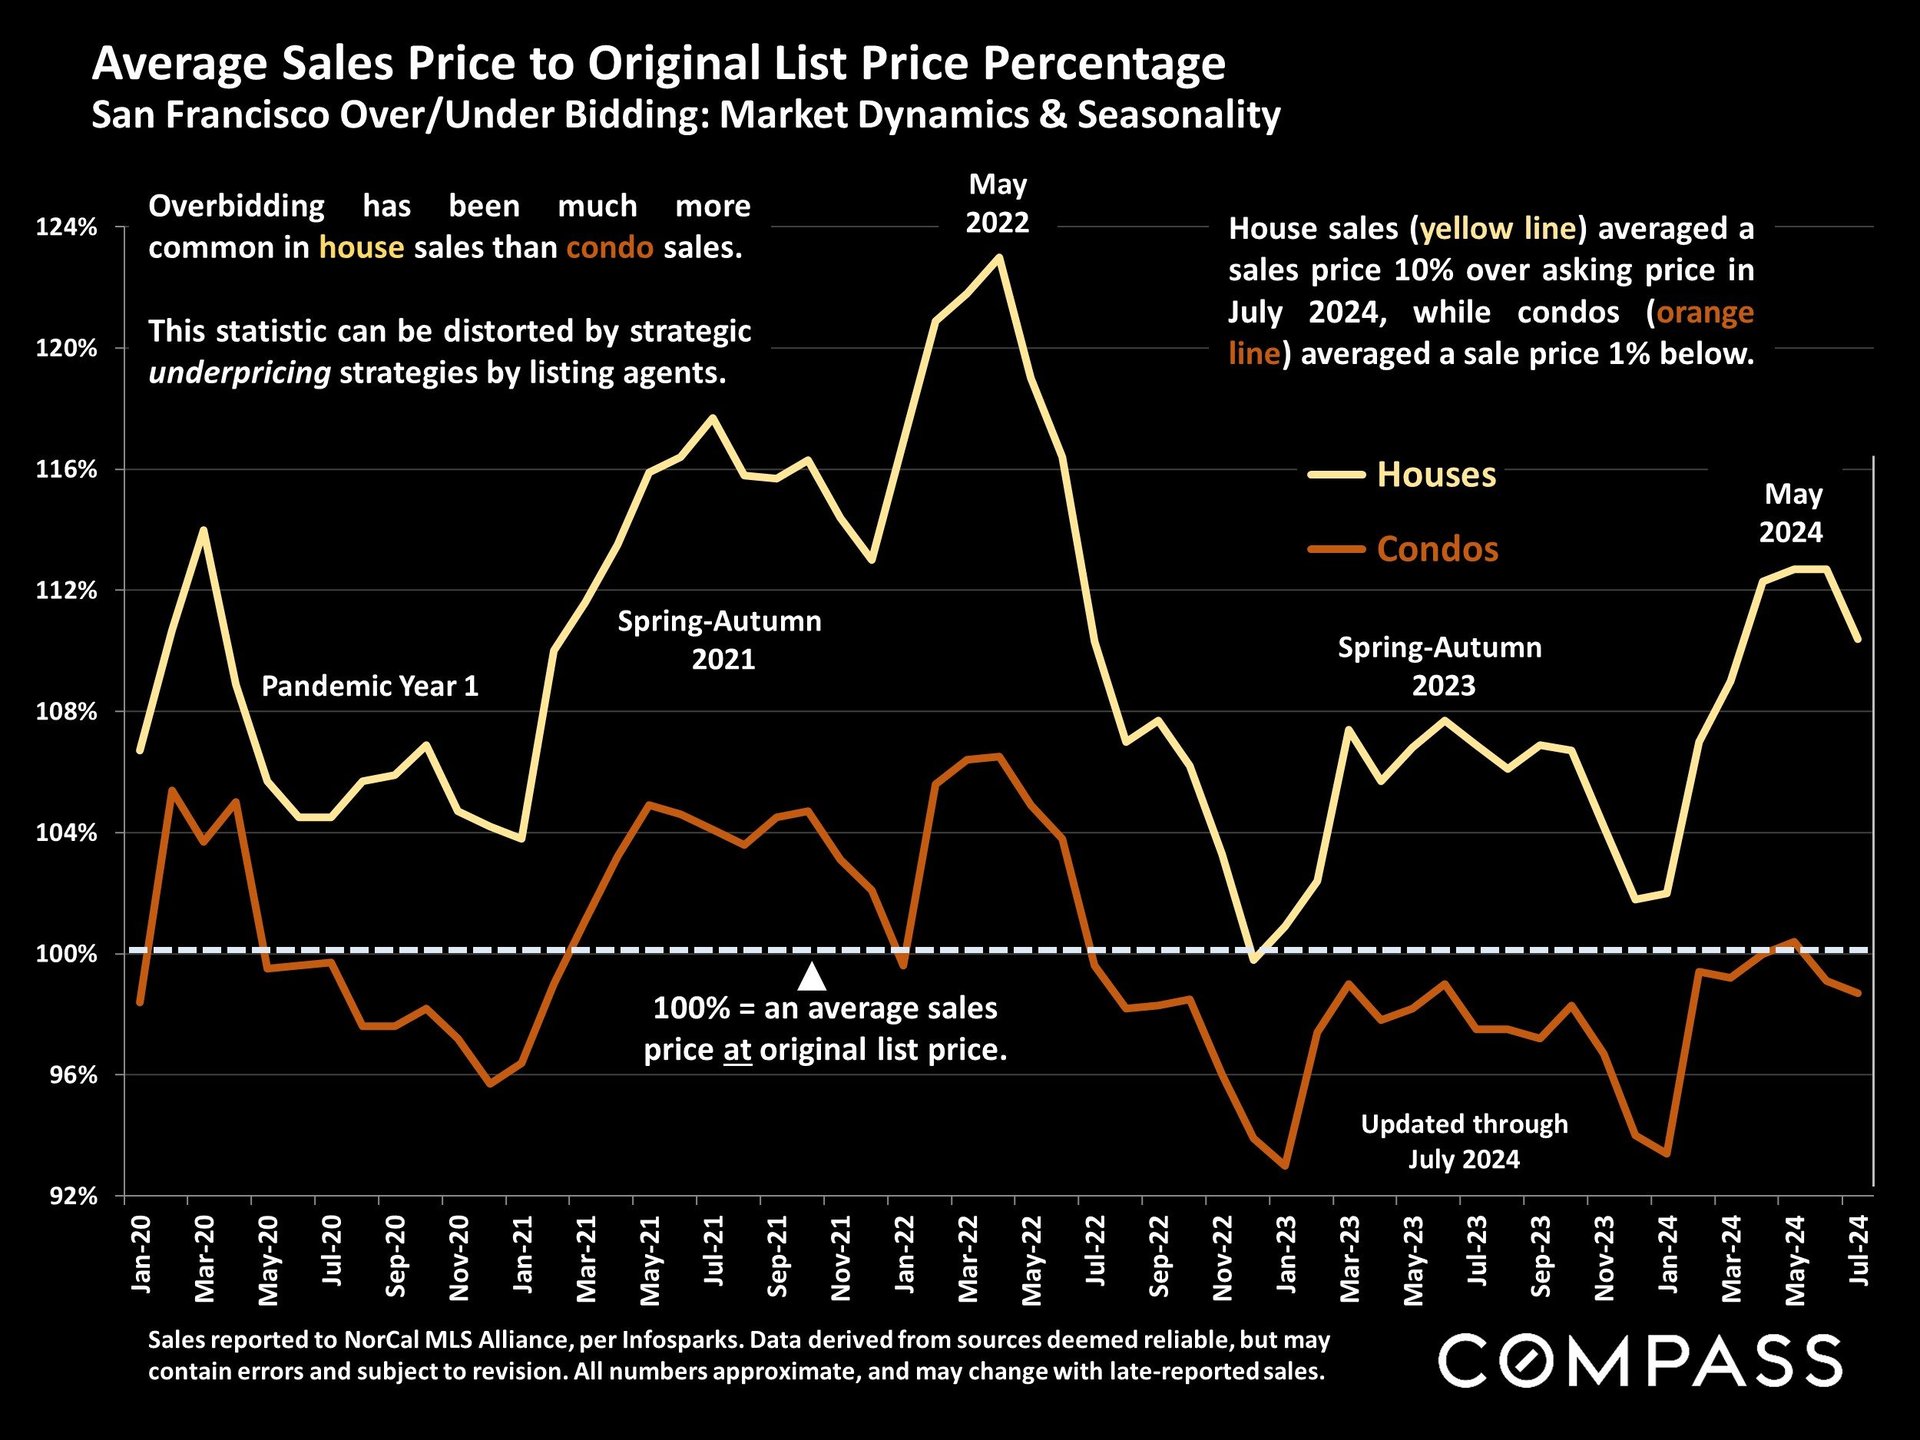
Chart of San Francisco house and condo sale prices versus original list price, January 2020–July 2024; houses averaged 10% over asking in July 2024, condos 1% below.
 
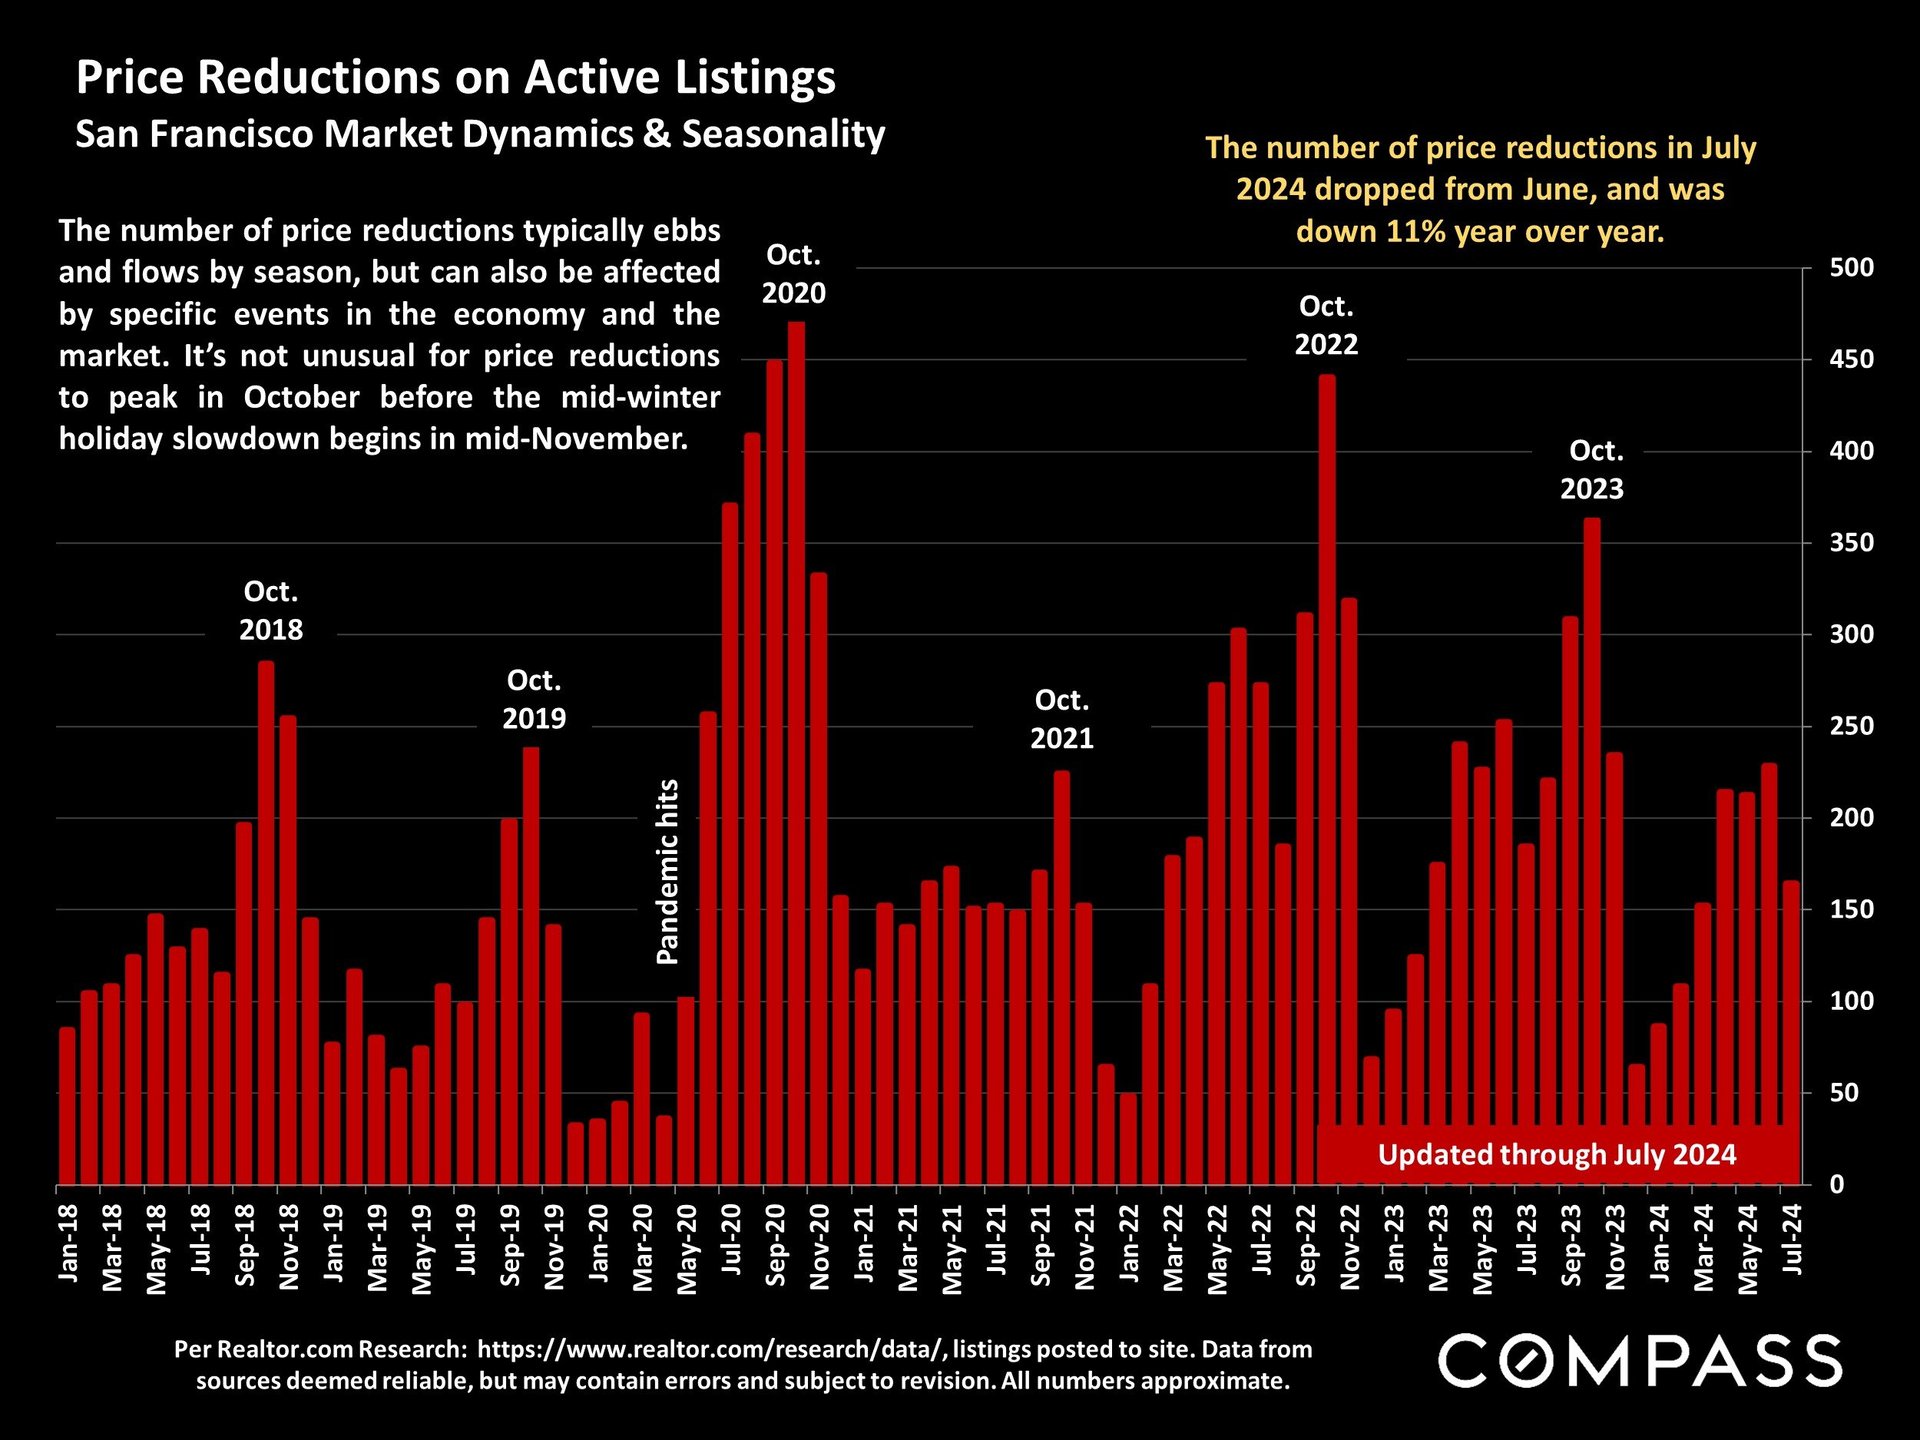
Chart of San Francisco active-listing price reductions, January 2018–July 2024, with October peaks and a record surge in 2020.
 
Real estate market statistics notes explain data limitations, home values, square-foot calculations, and report disclaimers.

Work With Jane

Get assistance in determining the current property value, crafting a competitive offer, writing and negotiating a contract, and much more. Contact me today.

Follow Me on Instagram