San Francisco Real Estate August 2025 Report, with market data through July.

San Francisco Home Prices, Market Conditions & Trends August 2025

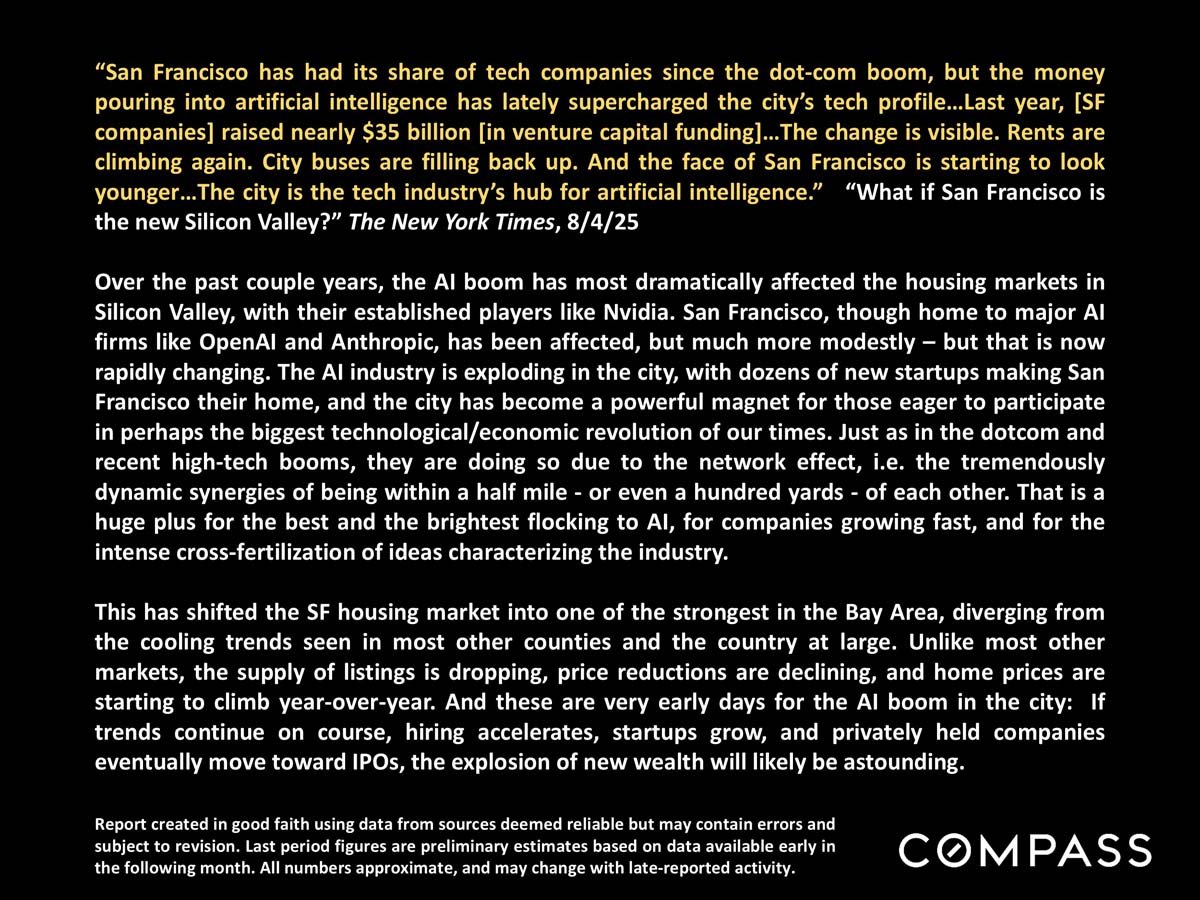
Over the past couple years, the AI boom has most dramatically affected the housing markets in Silicon Valley, with their established players like Nvidia.
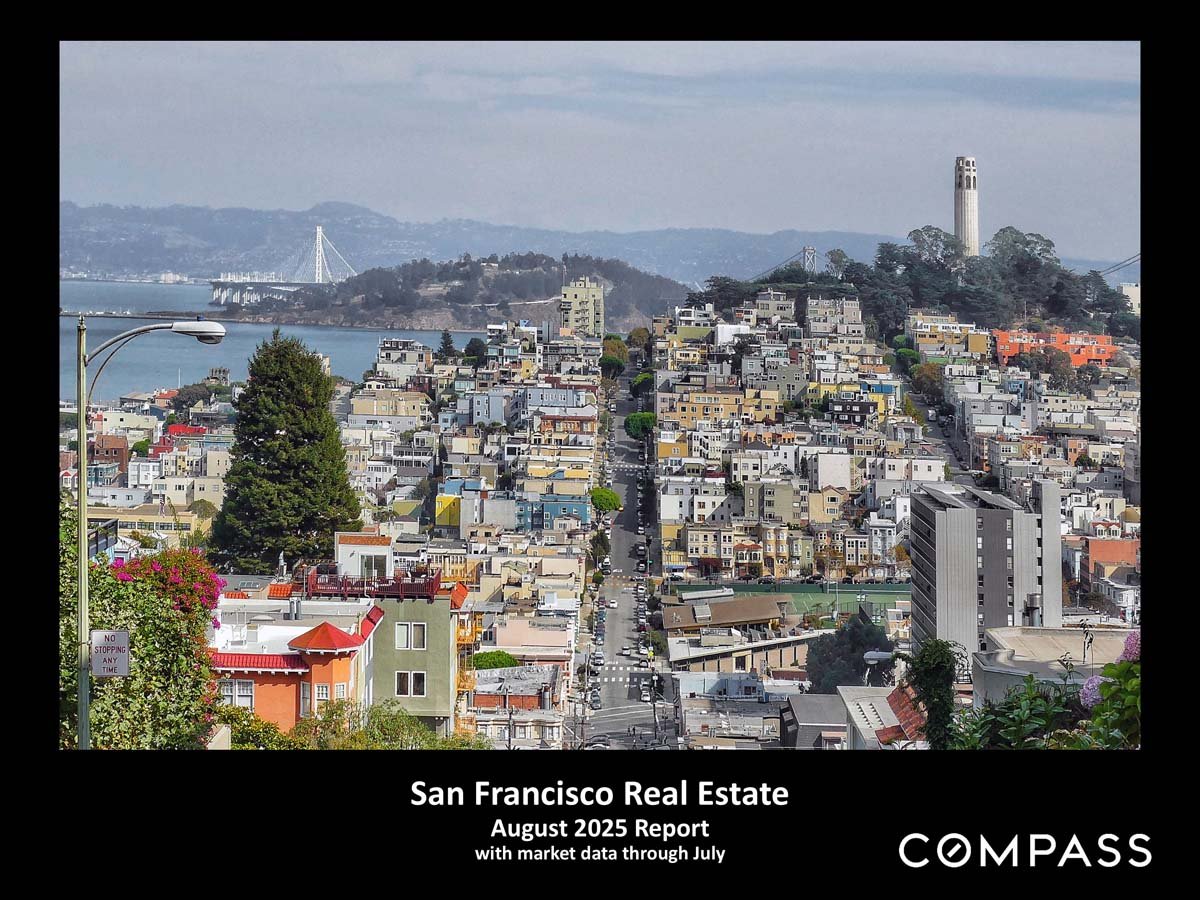
San Francisco Real Estate August 2025 Report, with market data through July.

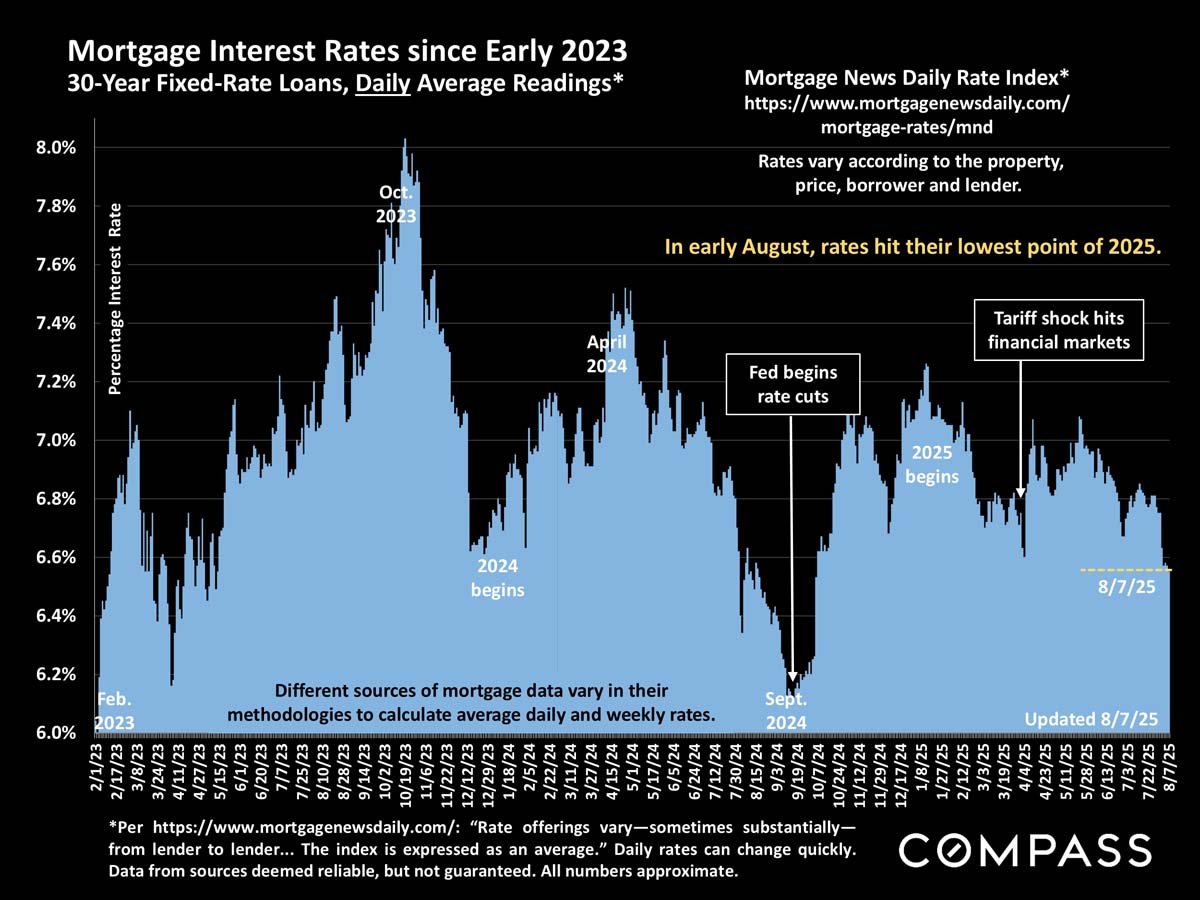
San Francisco housing market report discussing AI growth, rising home prices, and Compass data disclaimer.Chart of 30-year mortgage rates since 2023, showing rates near 6.5% on August 7, 2025.

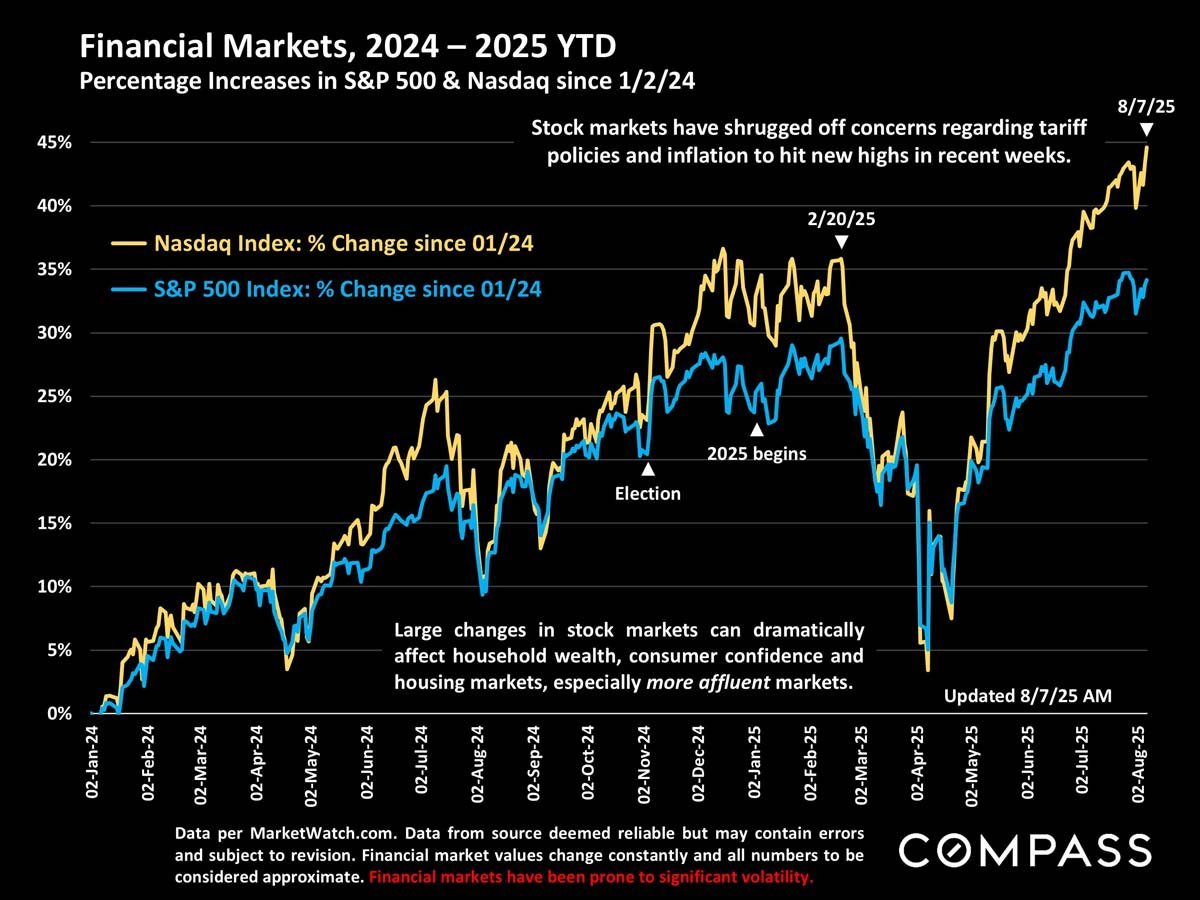
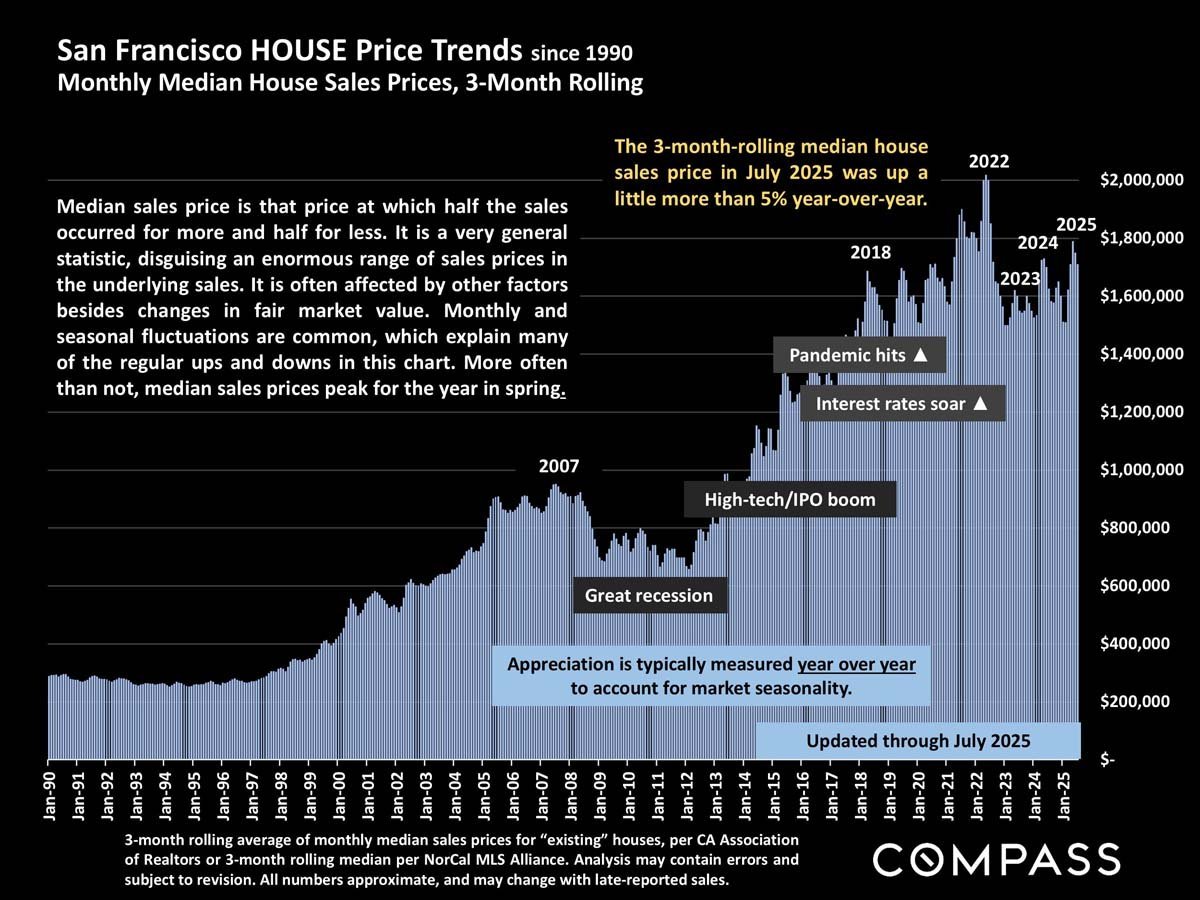
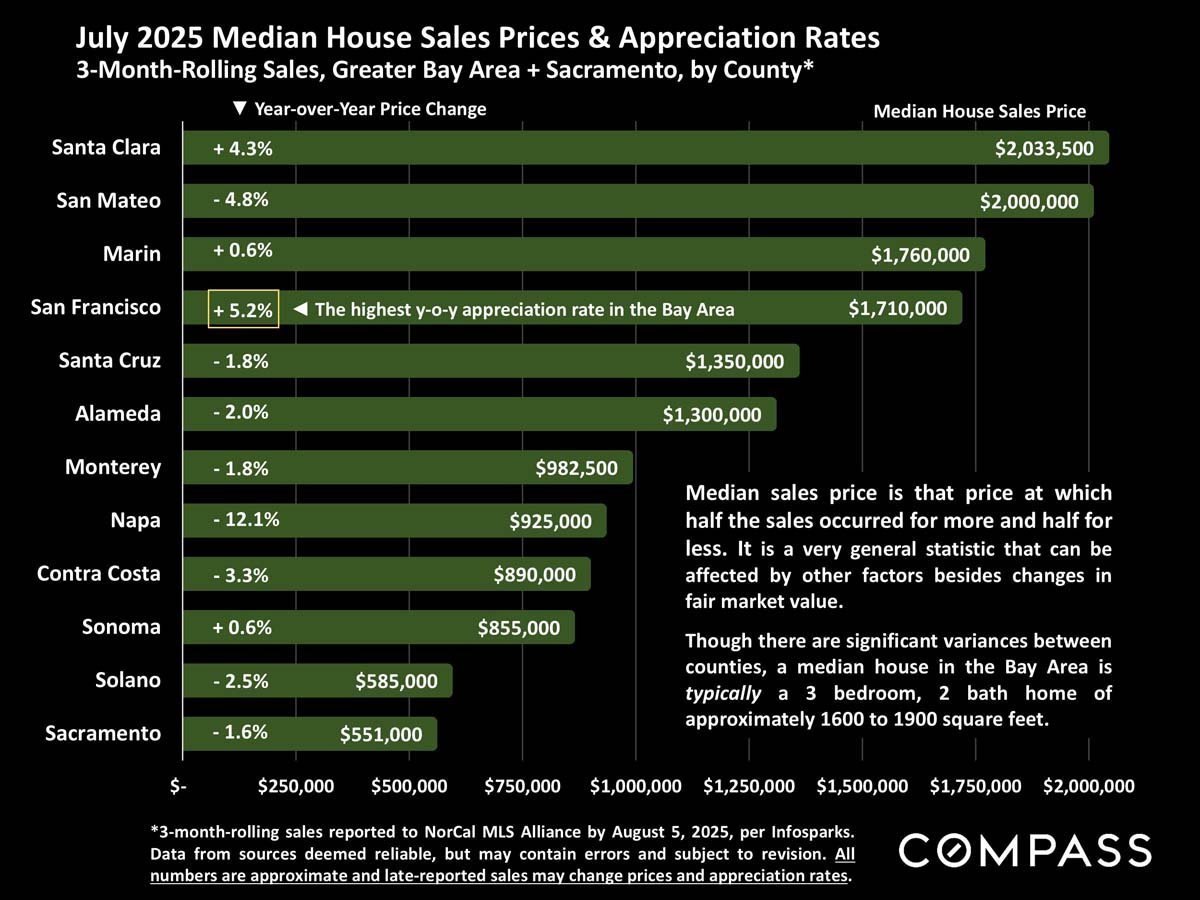
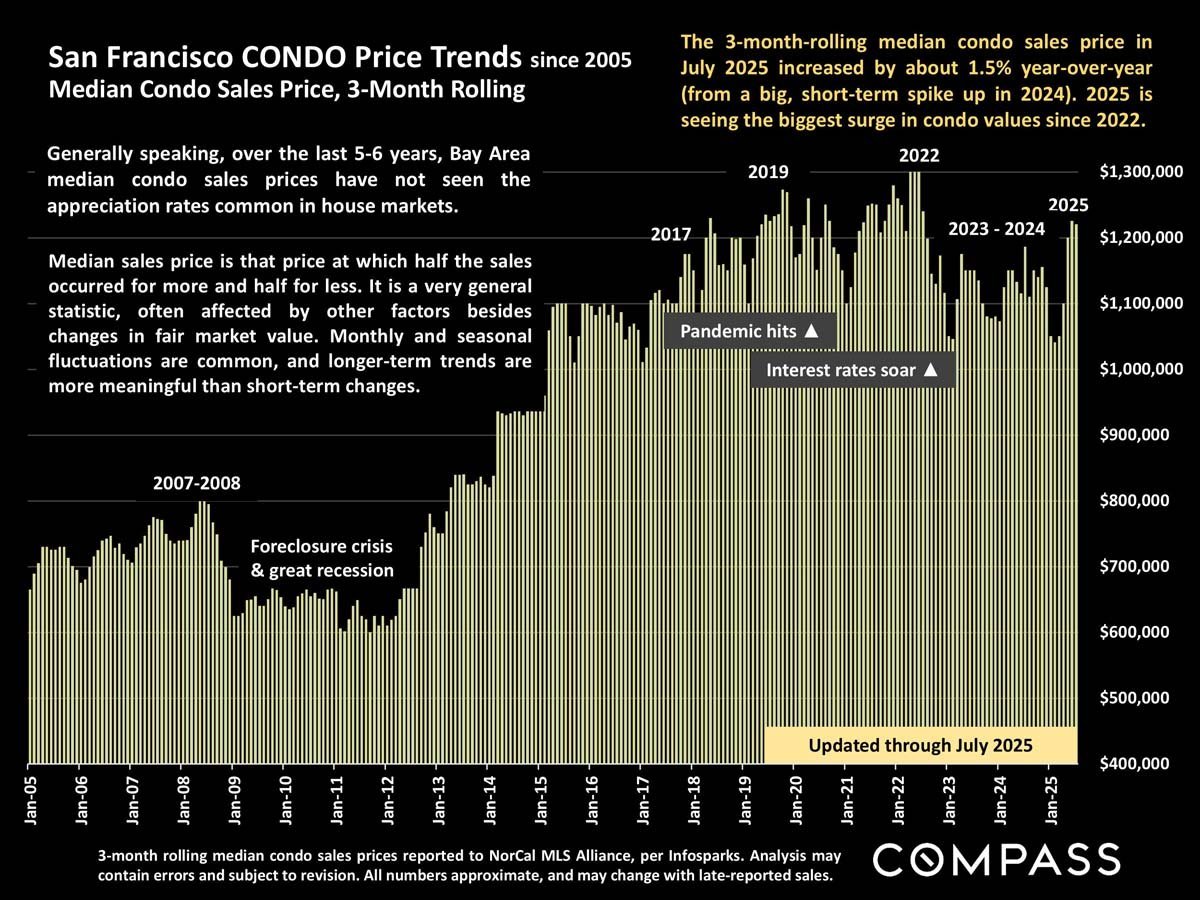
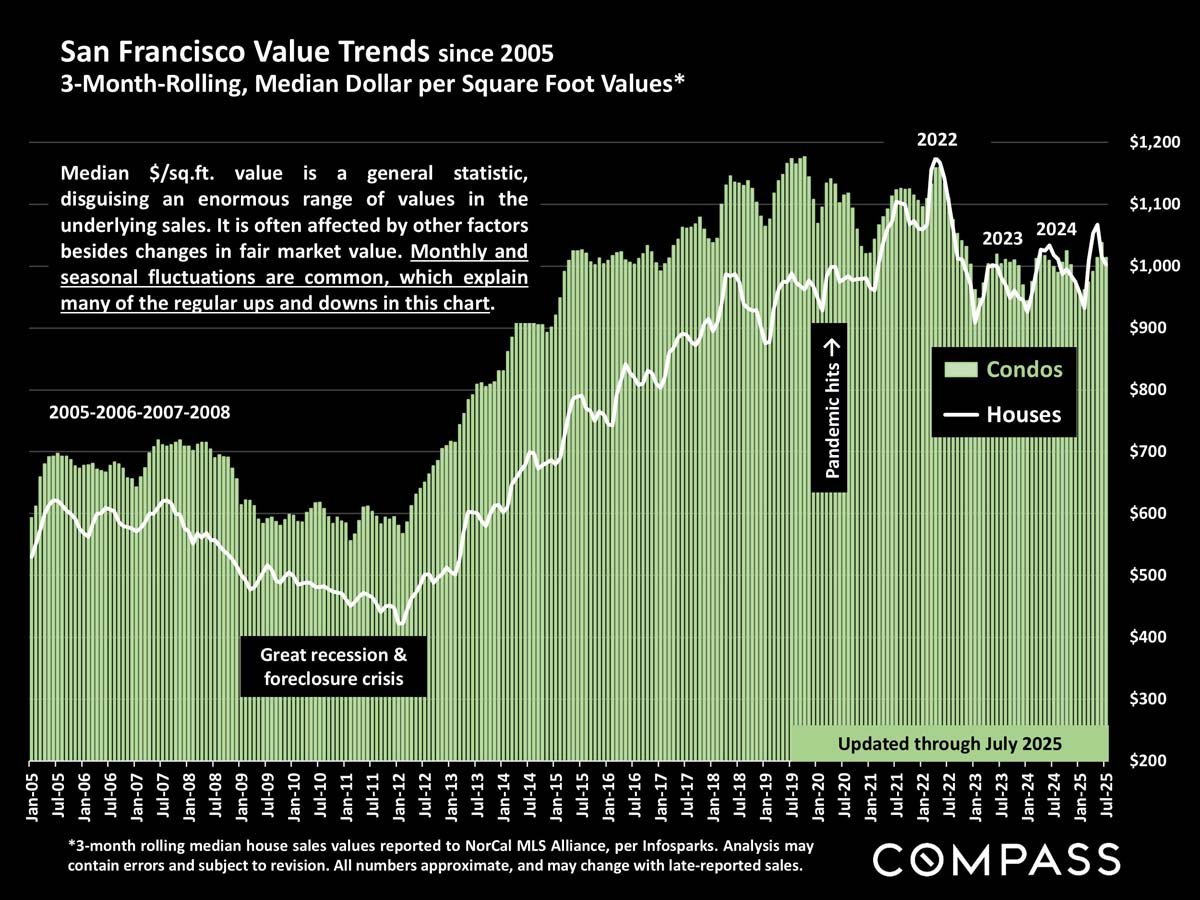
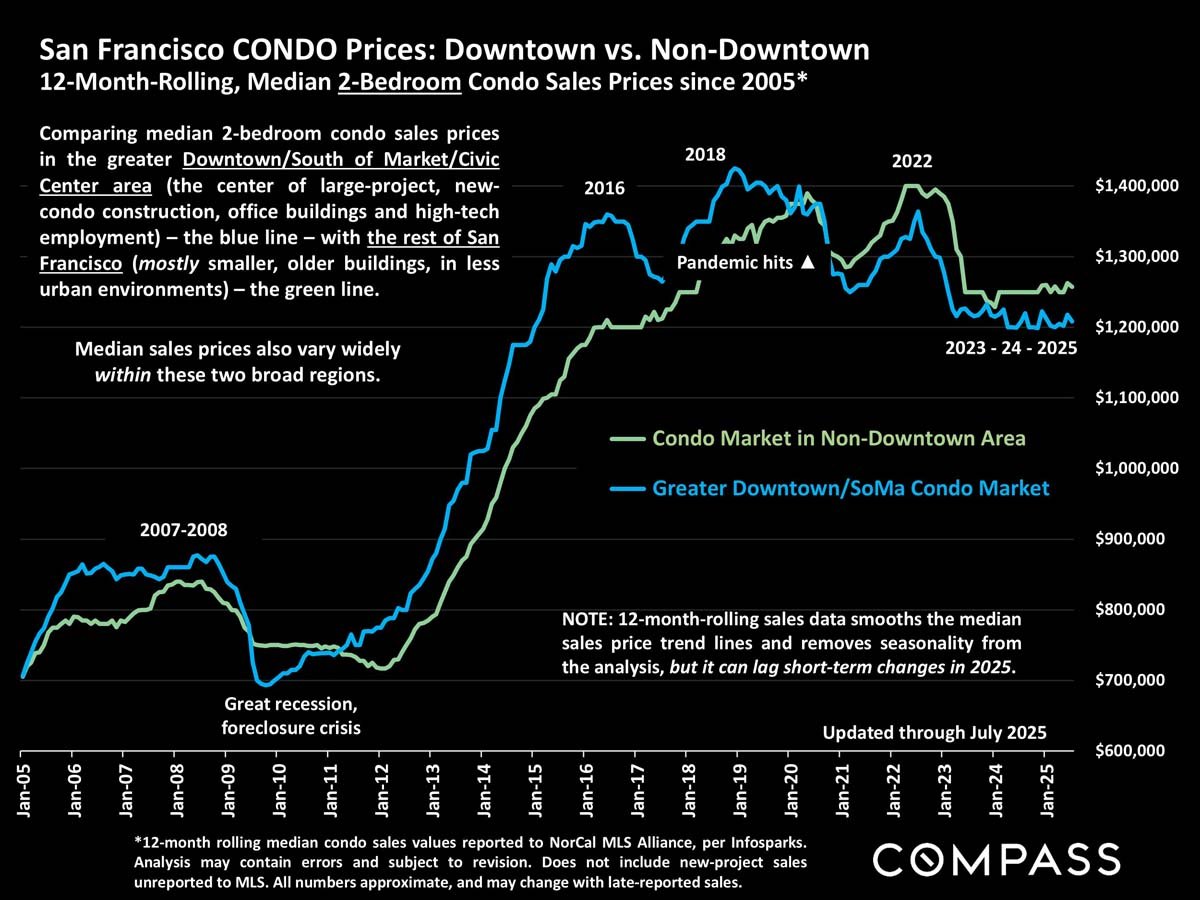
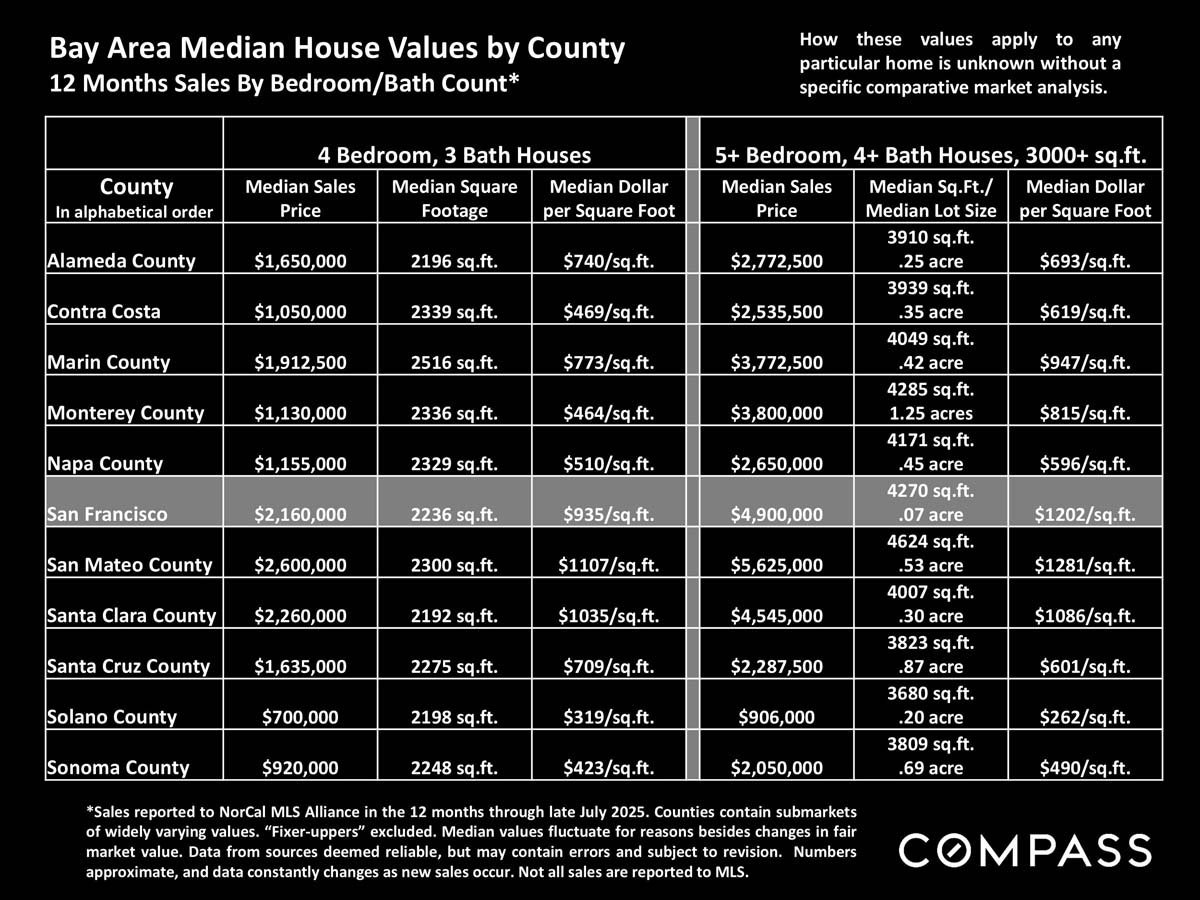
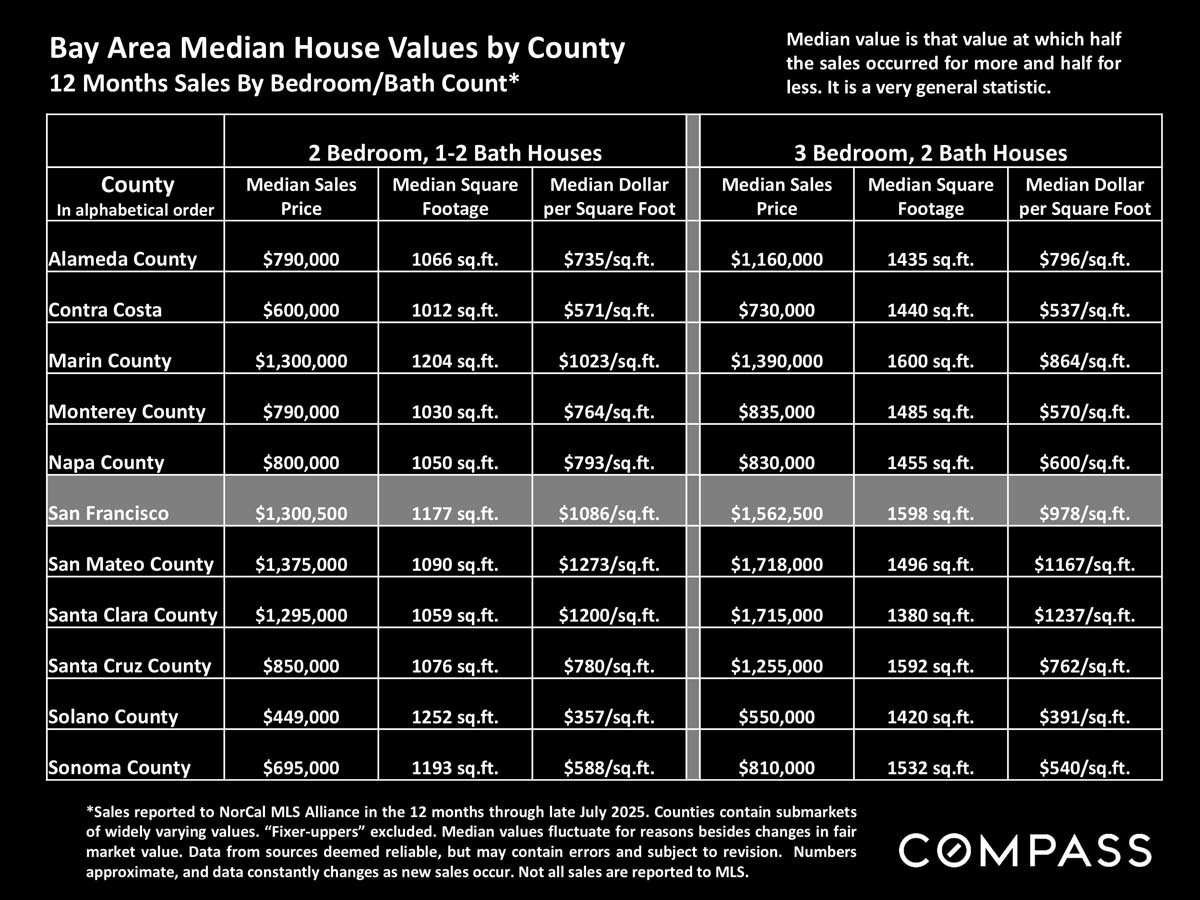
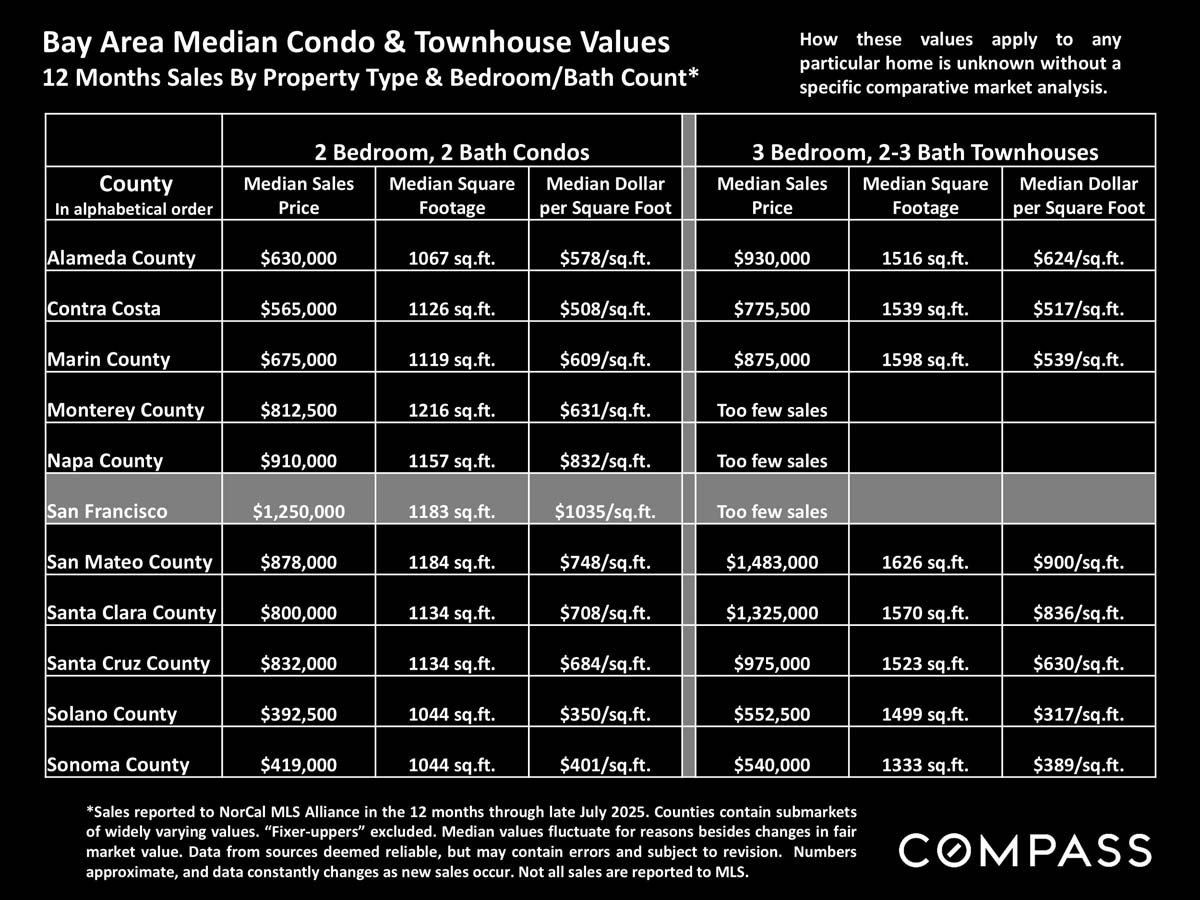
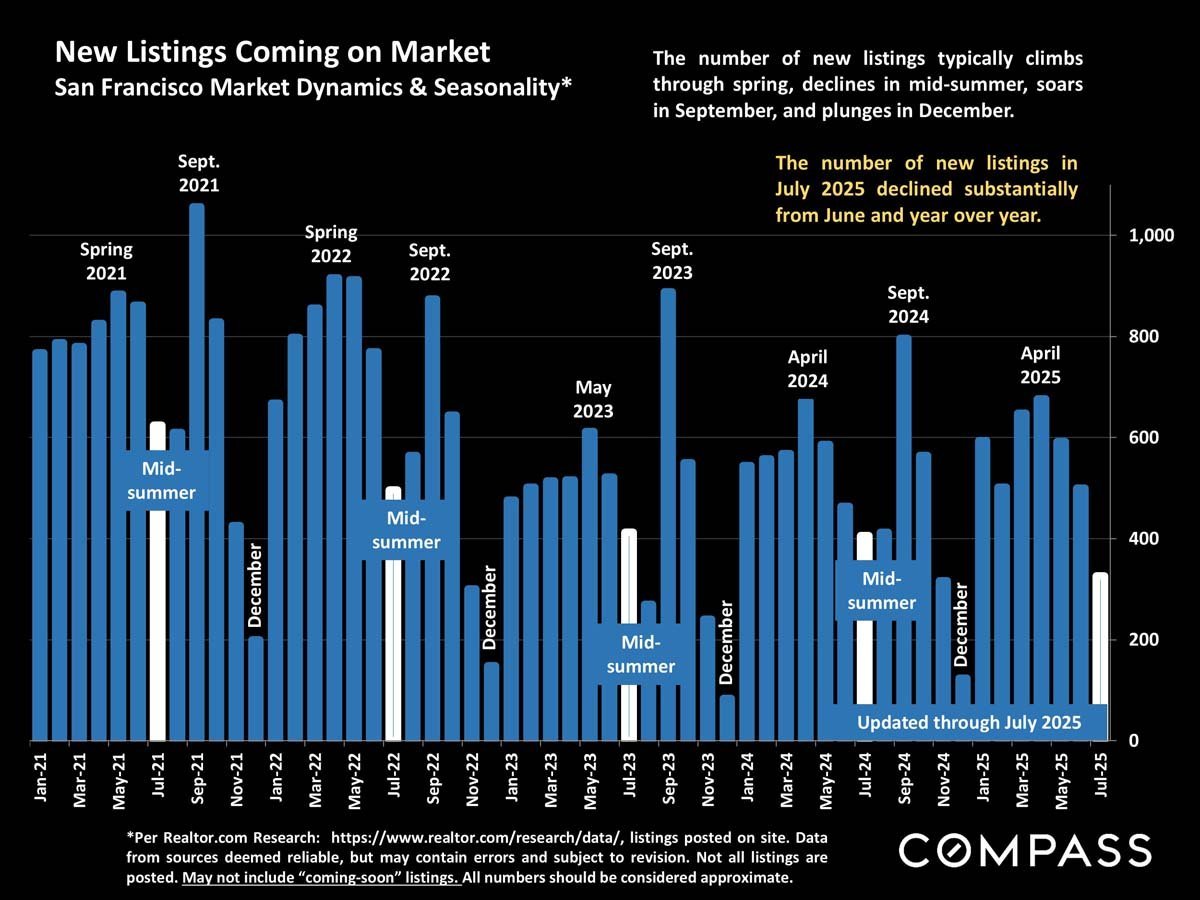
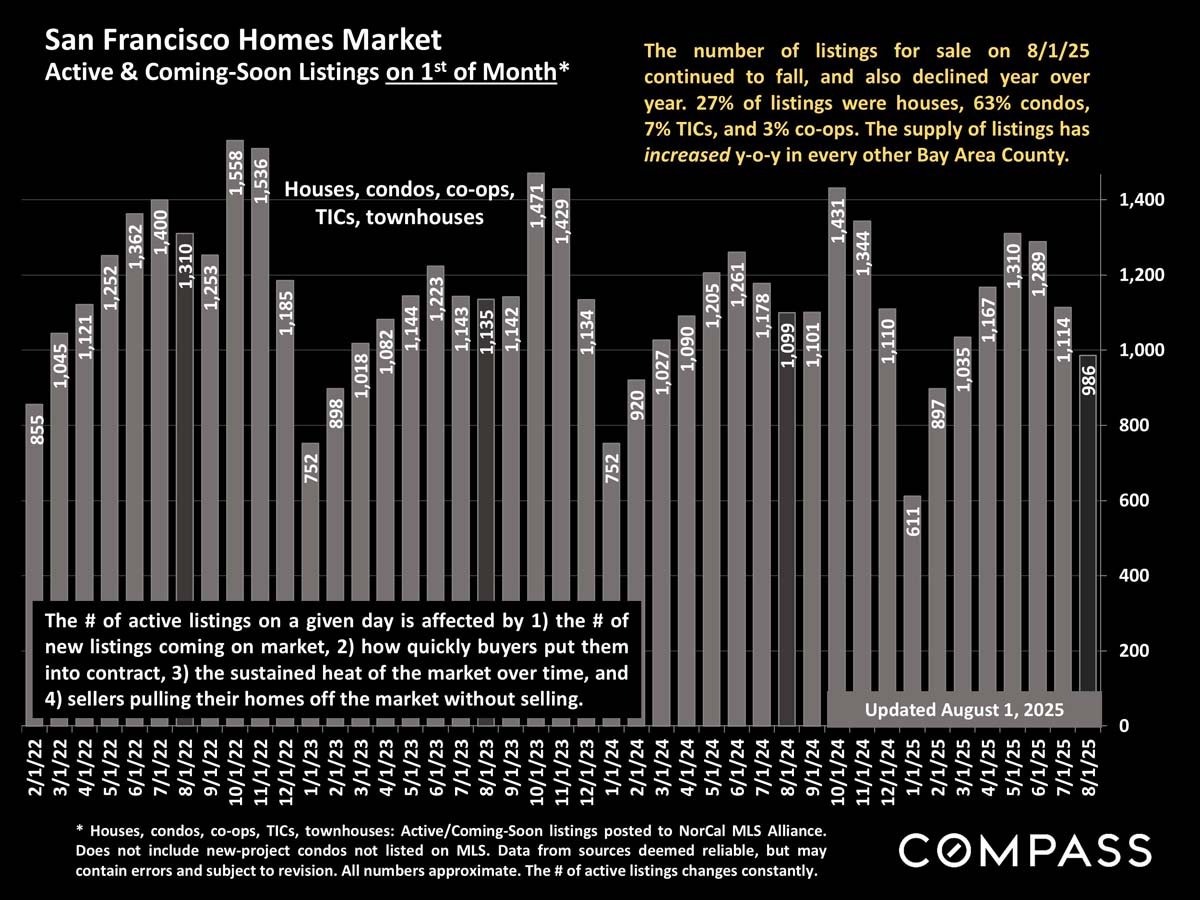
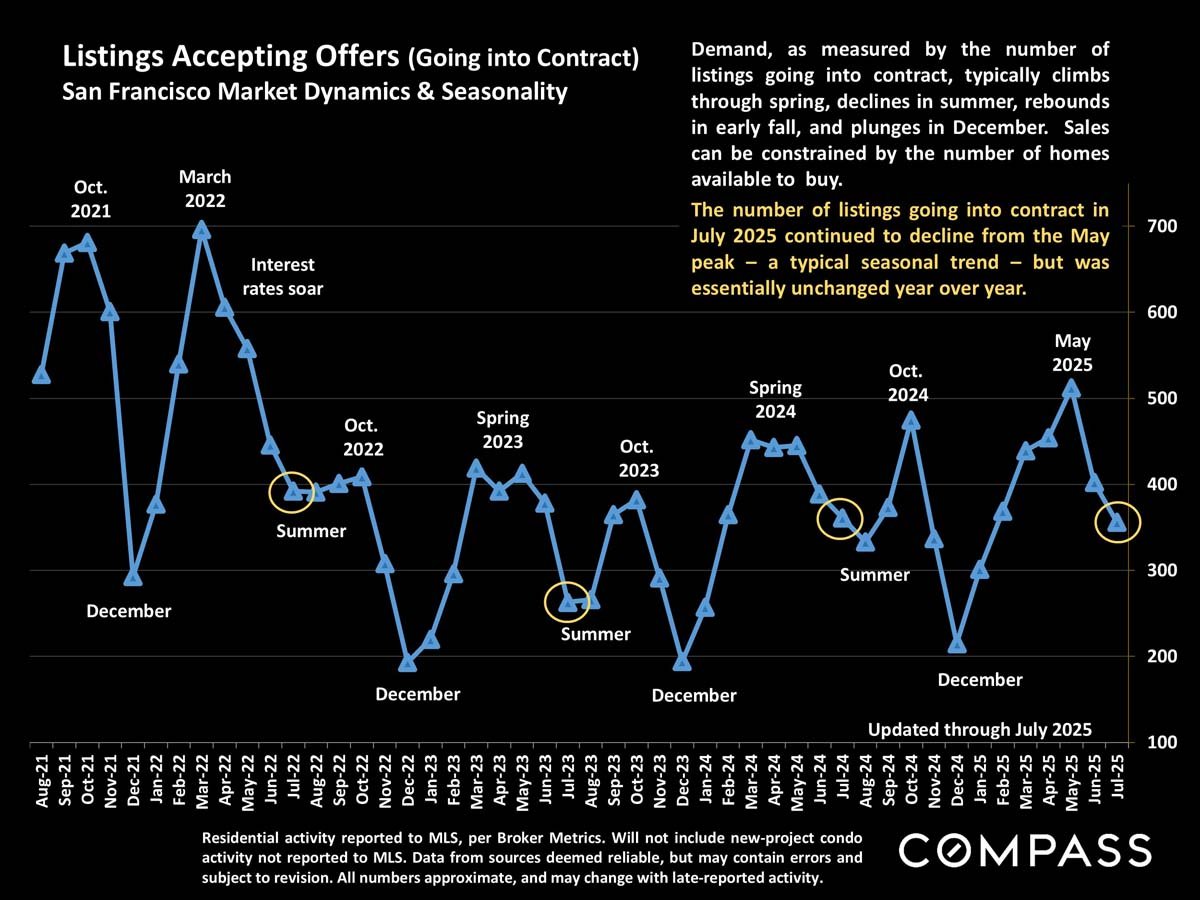
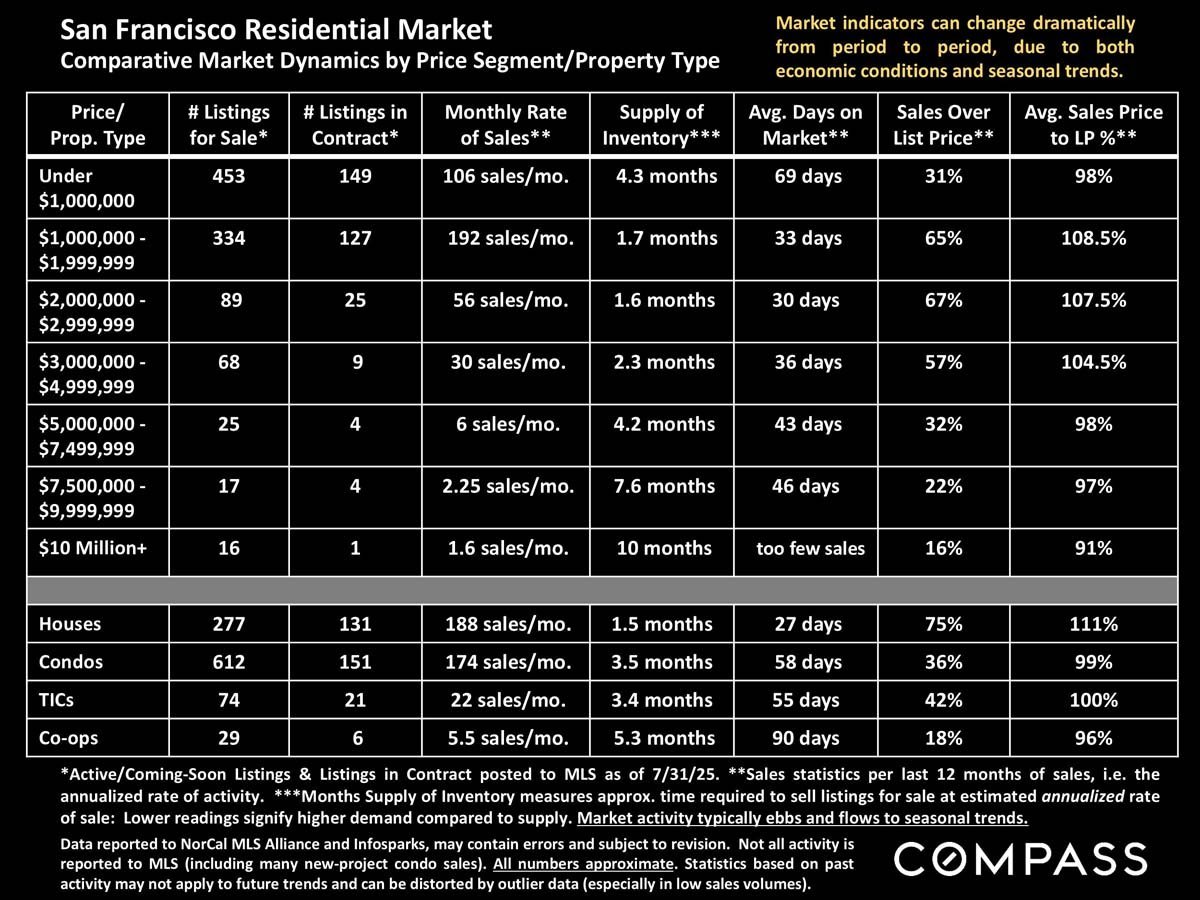
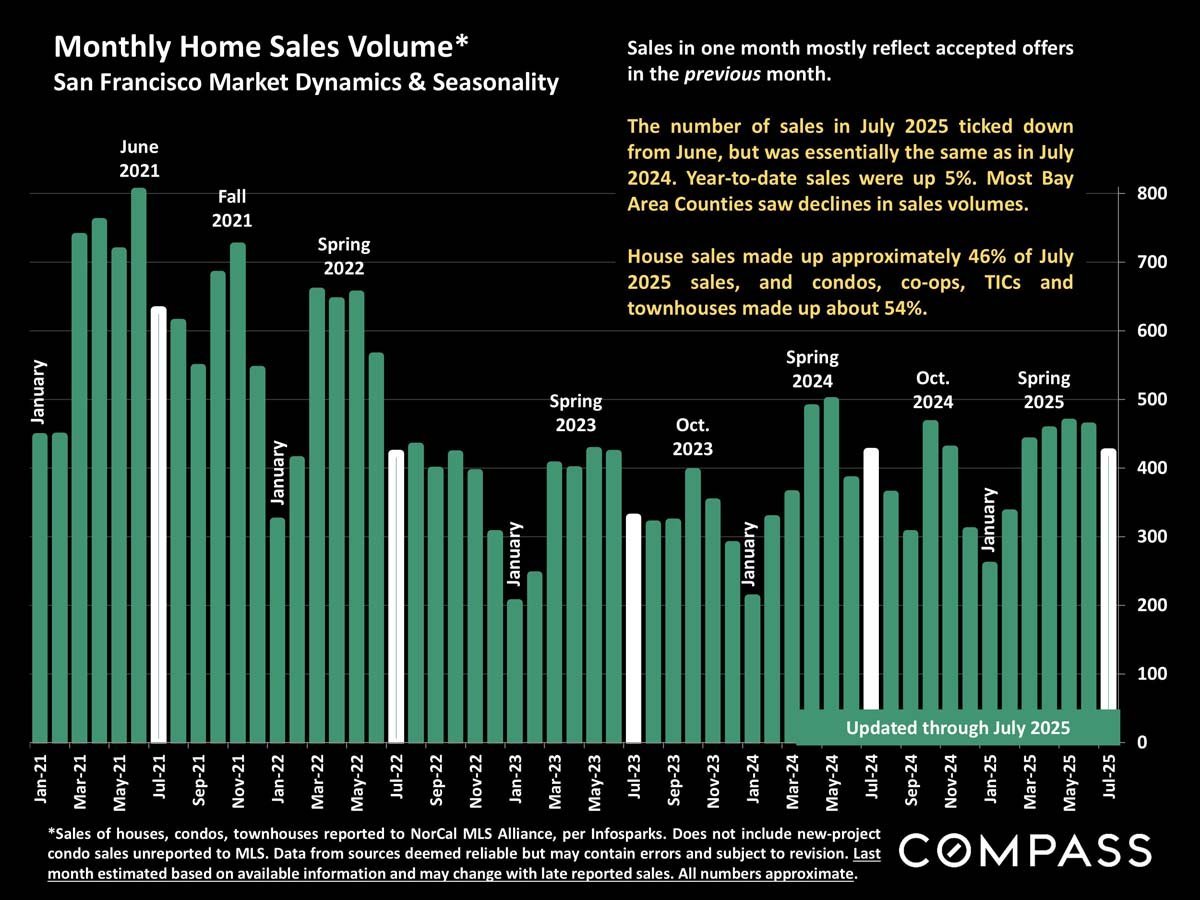
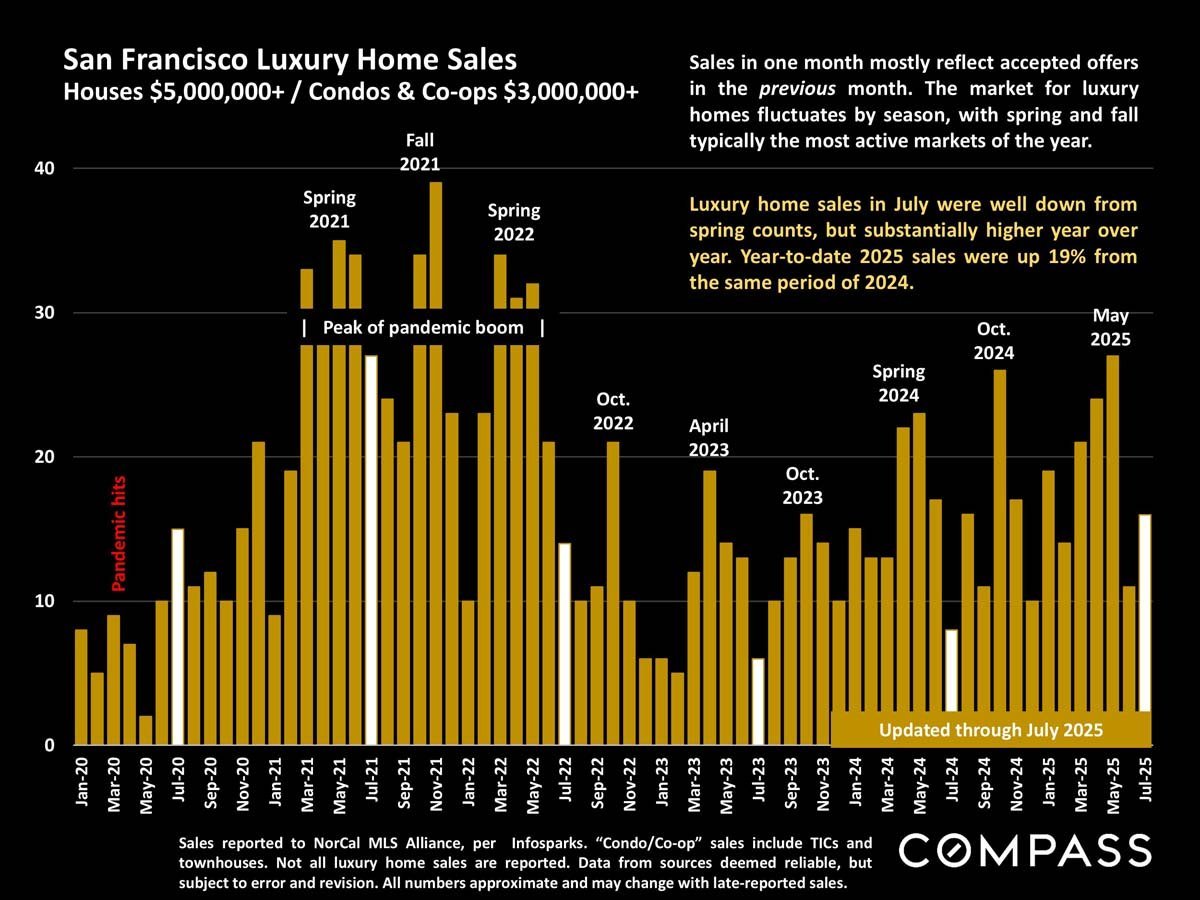
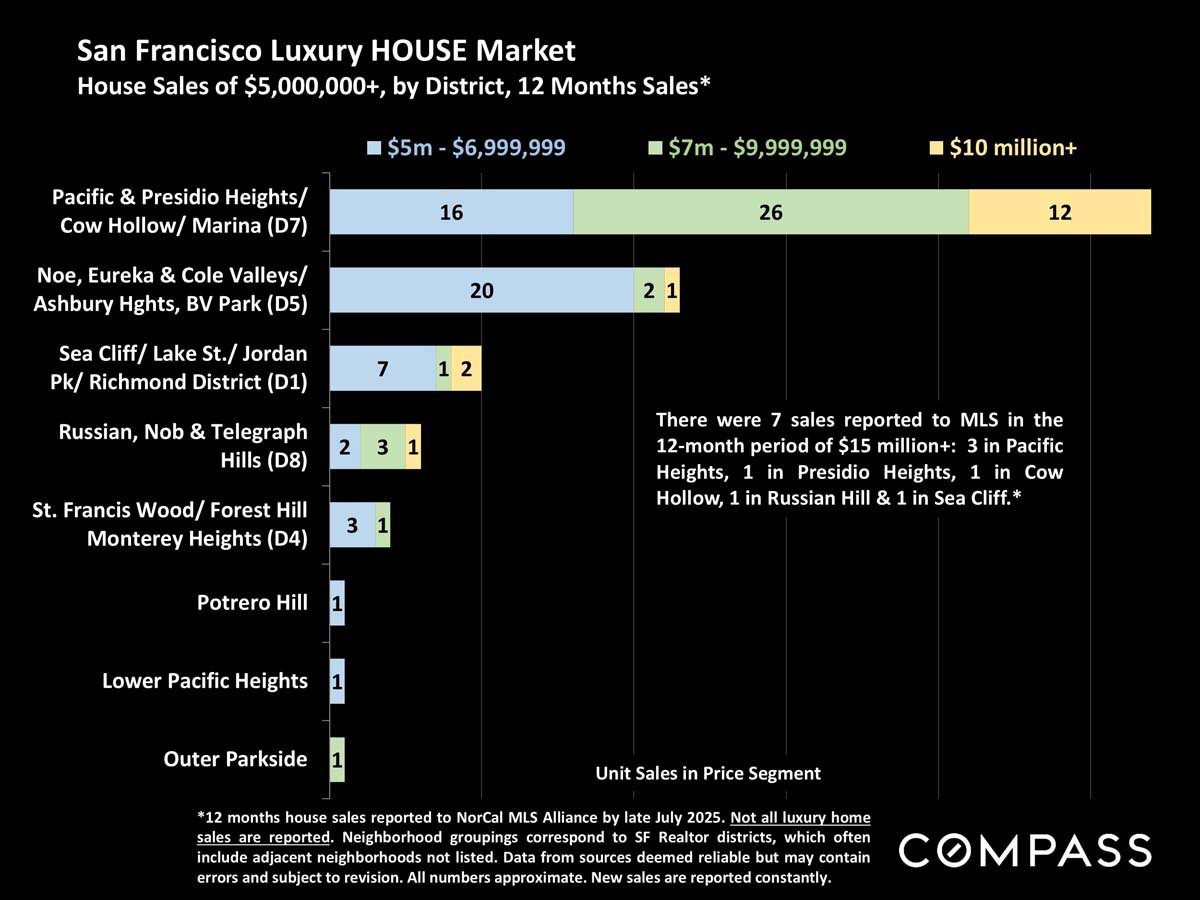
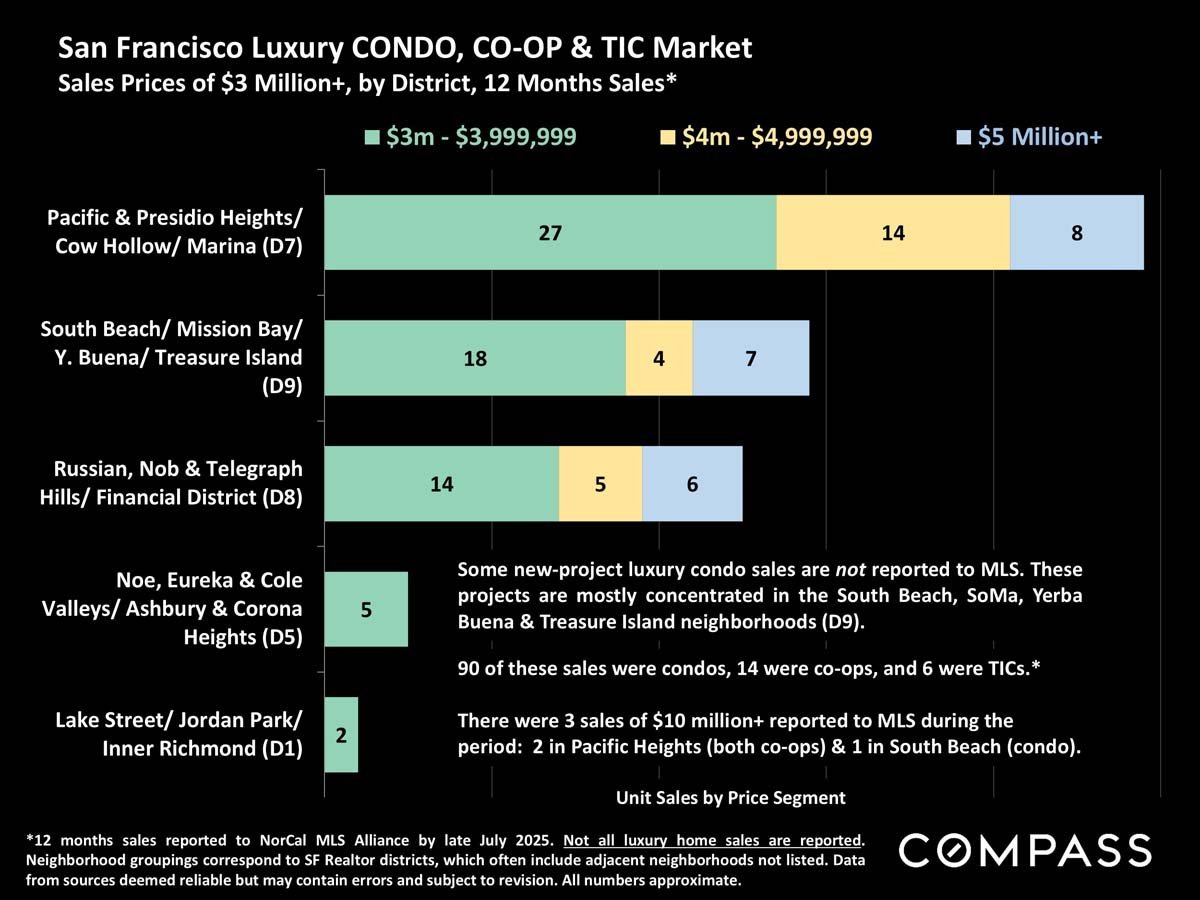
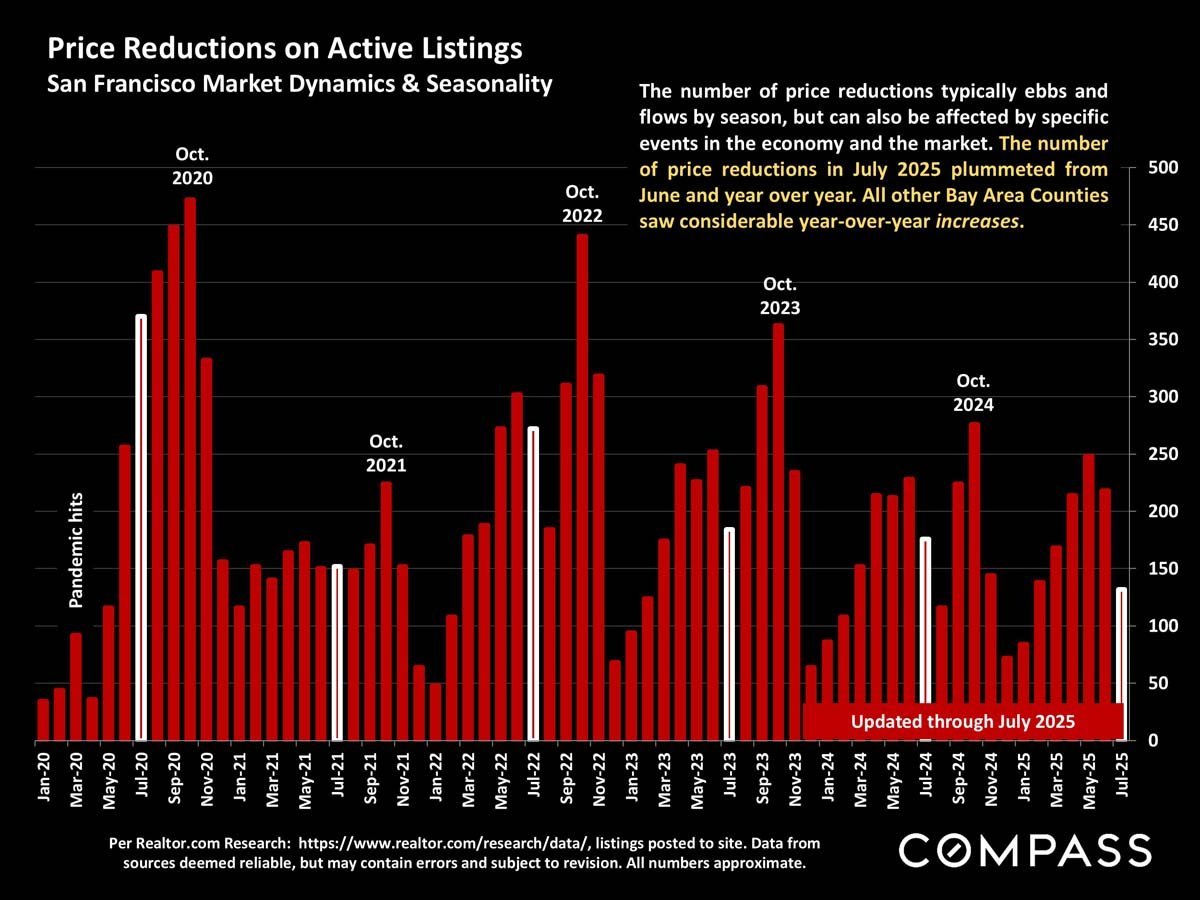
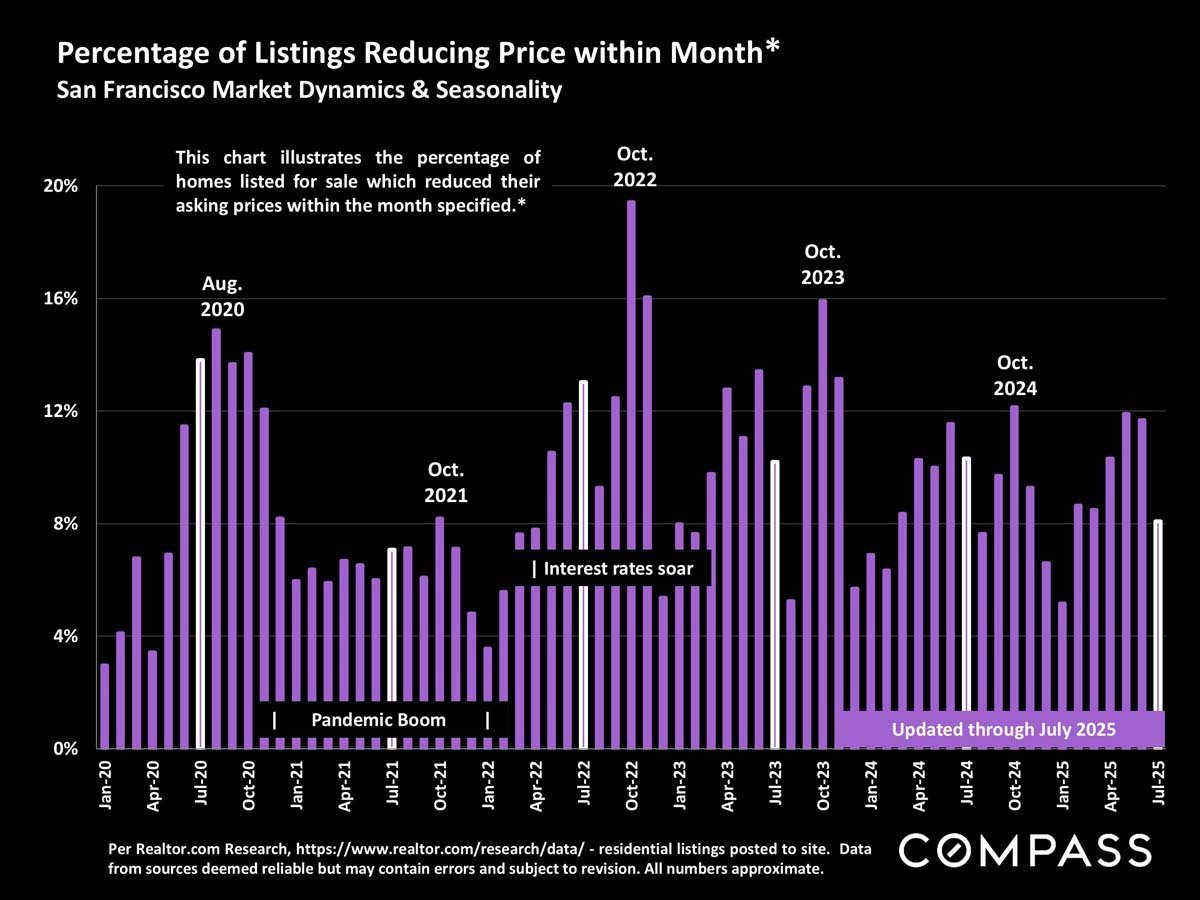
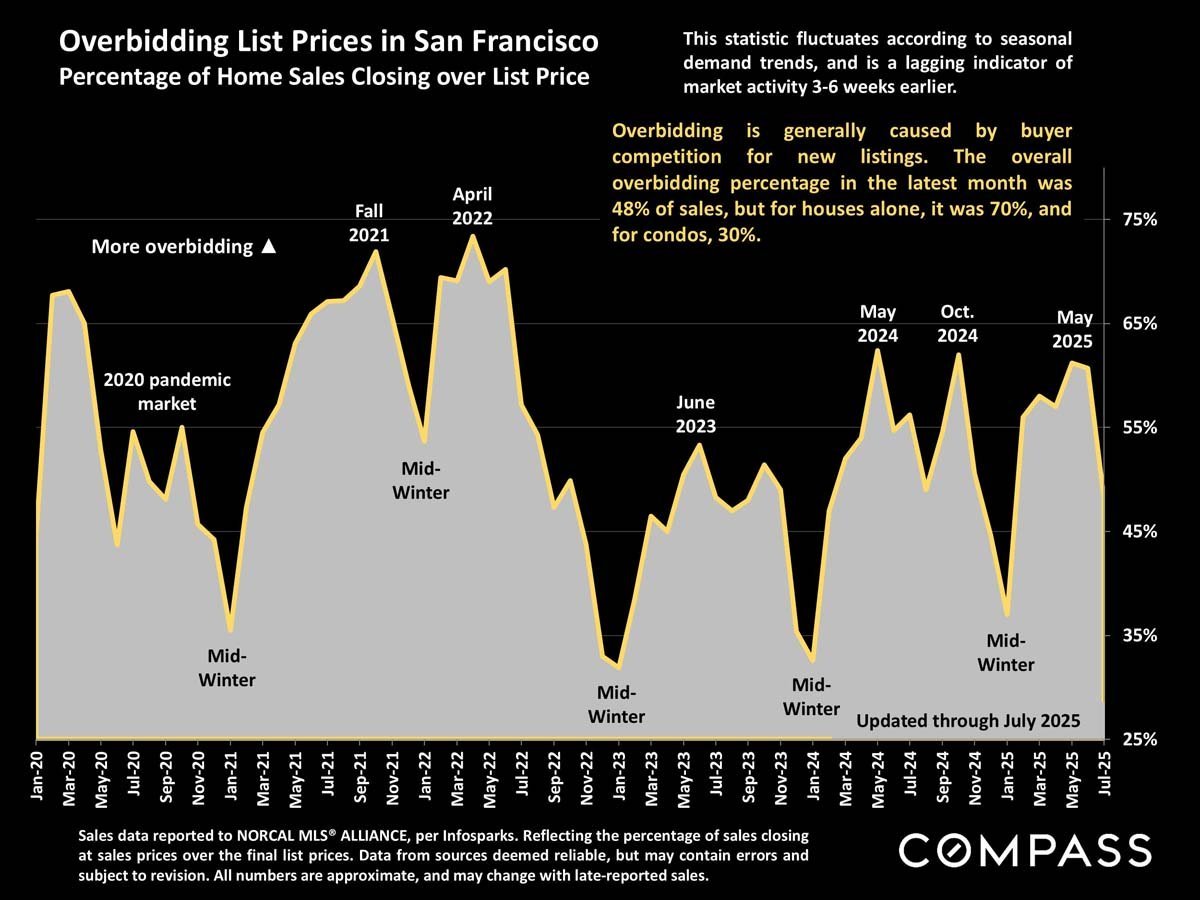
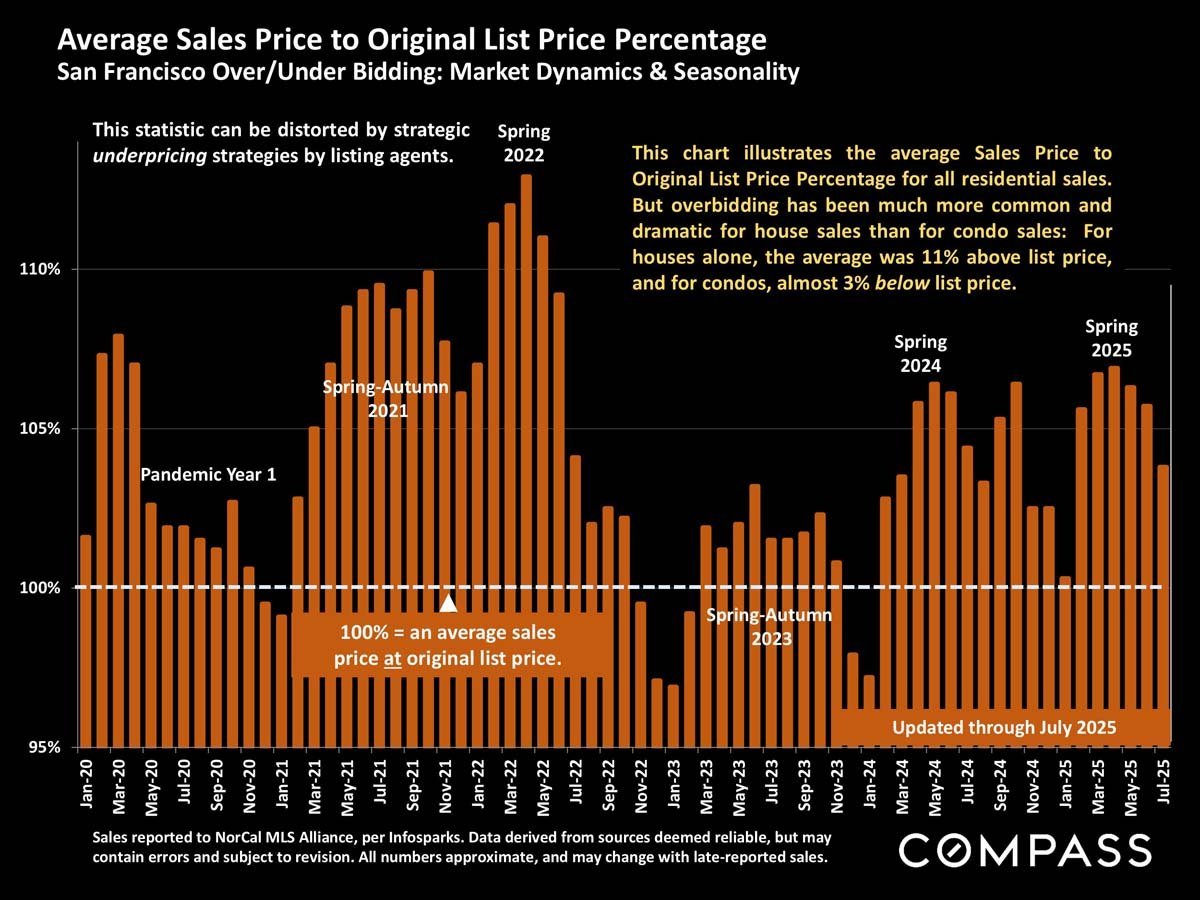
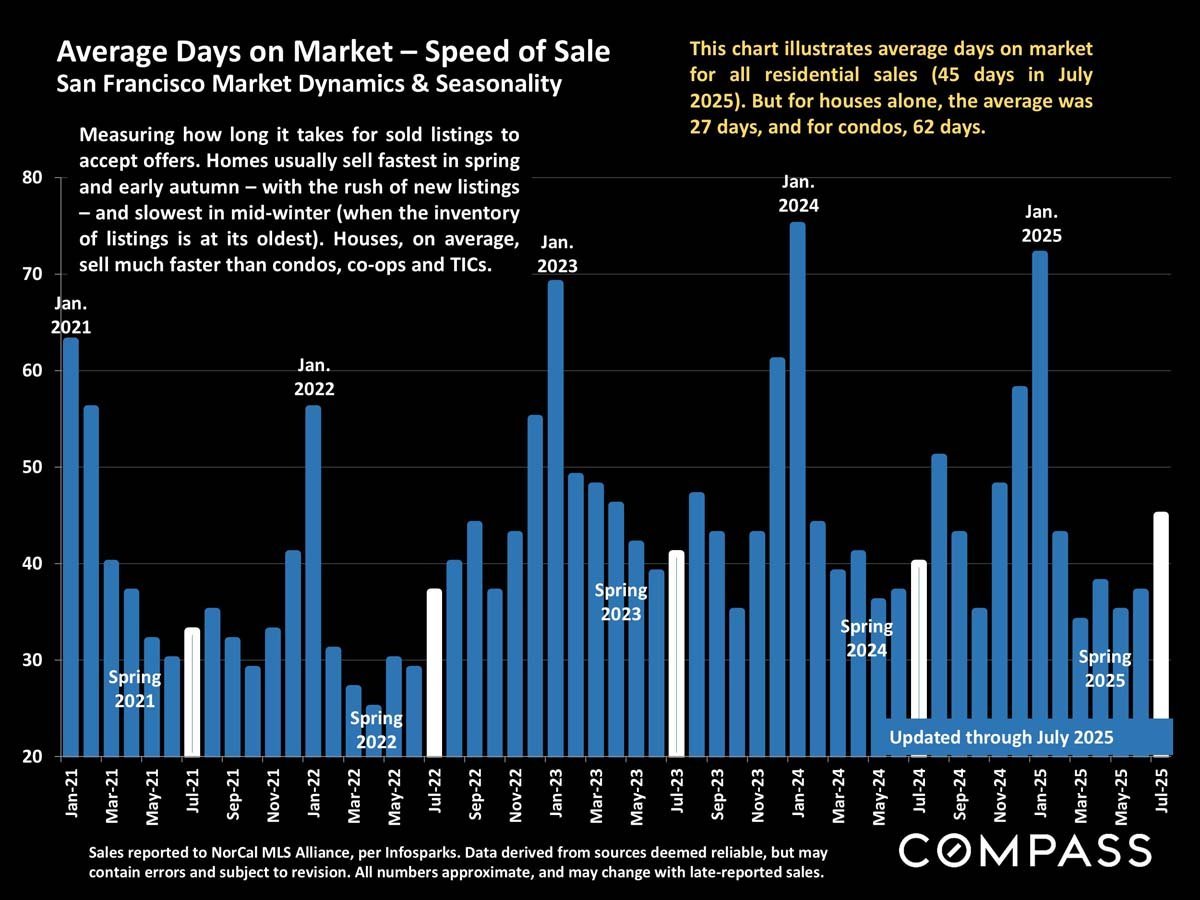
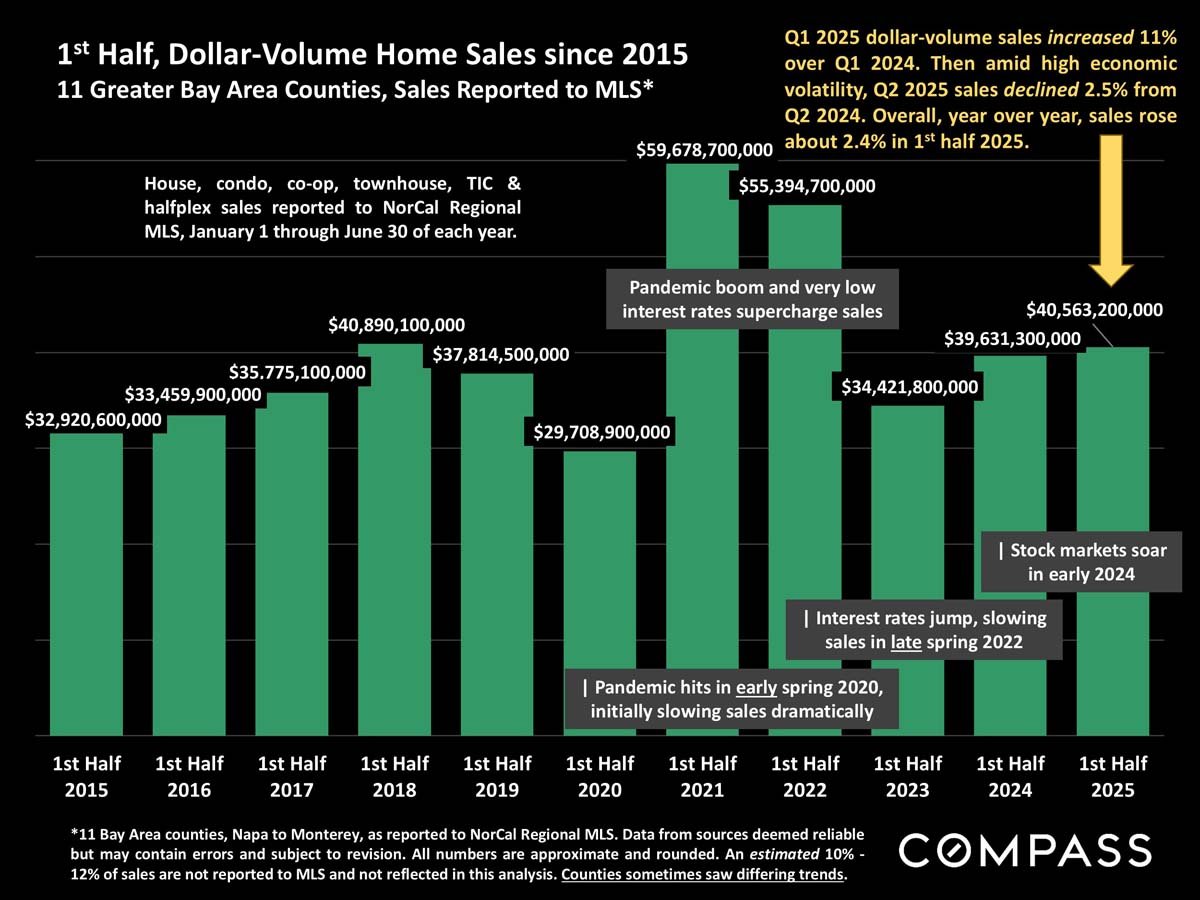
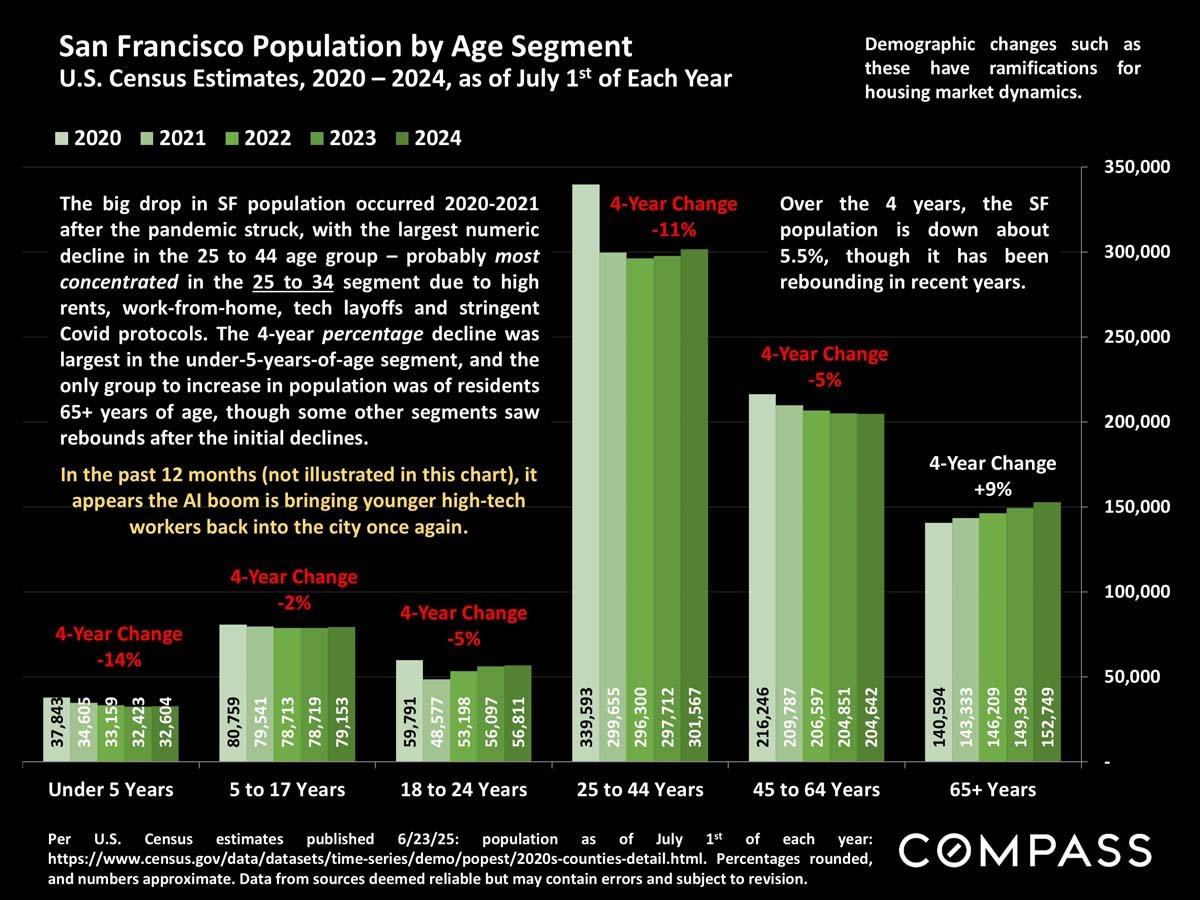
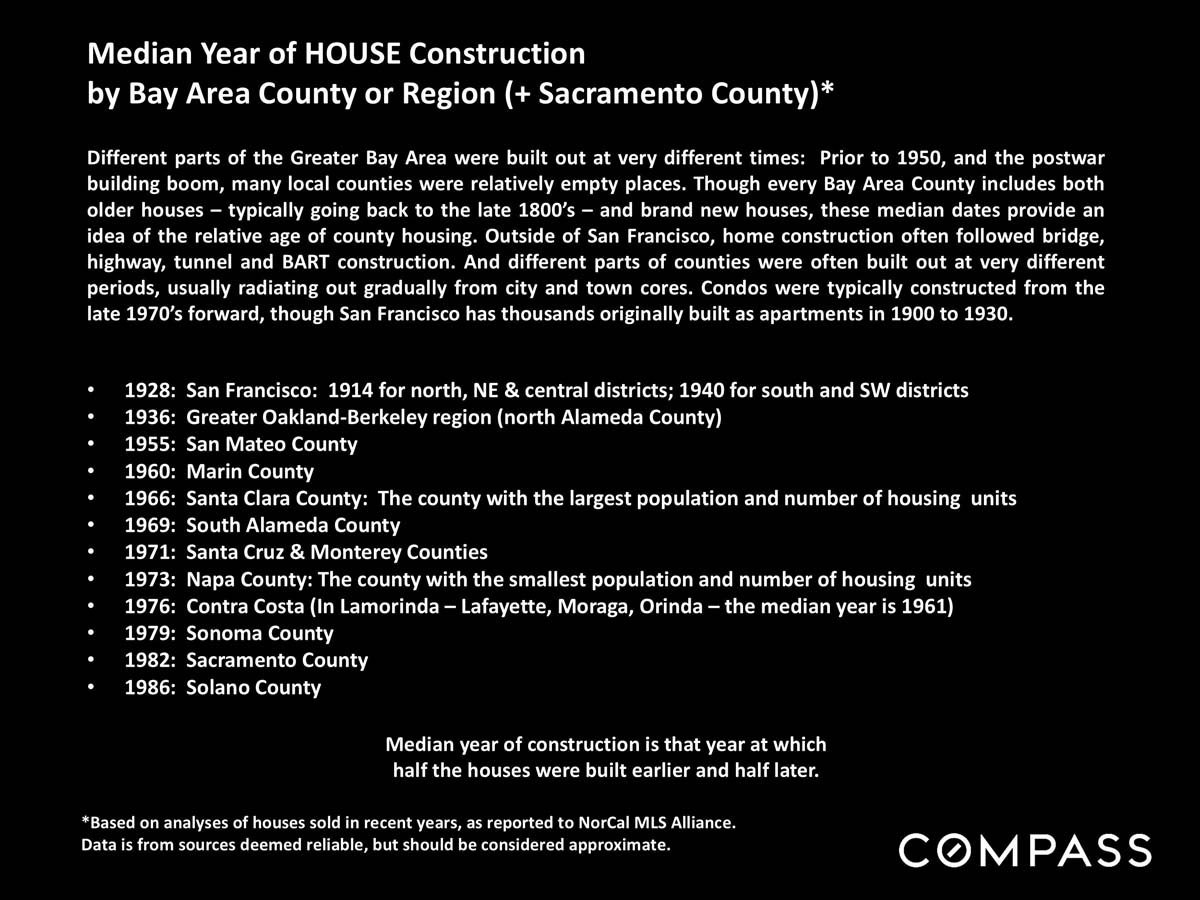
Chart comparing Nasdaq and S&P 500 gains from January 2024 through August 2025, with the Nasdaq ending higher.Chart of San Francisco median house prices from 1990 to July 2025, with market events annotated.July 2025 county home-price chart; San Francisco shows a $1.71 million median price and 5.2% annual increase.Chart of San Francisco condo prices since 2005, with a July 2025 update and notes on market trends.Chart of San Francisco condo and house values per square foot from 2005 to July 2025, with a 2022 peak and later fluctuations.San Francisco condo price chart comparing downtown and non-downtown sales from 2005 to 2025.Bay Area home value infographic comparing two house-size categories across 11 counties, with San Francisco highlighted.Bay Area home-value table compares median prices, square footage, and price per square foot across counties and bedroom counts.Bay Area condo and townhouse values by county, with San Francisco highlighted.San Francisco new listings bar chart, showing seasonal peaks in spring and September and lows in midsummer and December.Bar chart of San Francisco home listings from February 2022 to August 2025, ending at 986 listings.San Francisco listings going into contract, charted monthly from August 2021 through July 2025 with seasonal peaks and dips.San Francisco housing market chart comparing activity by price range and property type, with houses averaging 111% of list price.San Francisco monthly home sales bar chart, January 2021–July 2025, with seasonal annotations and July 2025 market notes.Bar chart of San Francisco luxury home sales from January 2020 through July 2025.Chart of San Francisco luxury house sales by district, with counts broken down by price segment.Chart compares San Francisco luxury condo, co-op, and TIC sales by district and price segment.Chart of San Francisco active-listing price reductions, with monthly bars from January 2020 through July 2025.Bar chart of San Francisco listings reducing prices monthly, January 2020–July 2025, with pandemic and interest-rate annotations.Chart tracking the percentage of San Francisco home sales closing over list price from 2020 through July 2025.Chart of San Francisco home sale prices relative to original list prices, January 2020–July 2025.Chart of San Francisco average days on market, January 2021–July 2025, with seasonal trends and July 2025 figures.Bar chart of first-half Greater Bay Area home-sale dollar volume from 2015 to 2025, with 2021 peak and 2025 total.San Francisco population by age group, 2020–2024, with a green bar chart and notes on four-year changes.Infographic comparing median home construction years across Bay Area counties and regions.Market report definitions, data limitations, photo-use credit, and Compass legal disclaimer.

Work With Jane

Get assistance in determining the current property value, crafting a competitive offer, writing and negotiating a contract, and much more. Contact me today.

Follow Me on Instagram