San Francisco real estate December 2023 report cover featuring the Golden Gate Bridge.

San Francisco Home Prices, Market Conditions & Trends December 2023

A Sudden, Positive Shift in Economic Indicators. “For the third-sixth straight week, mortgage rates trended down, as new data indicates that inflationary pressures are receding. The combination of continued economic strength, lower inflation, and lower mortgage rates should likely bring more potential homebuyers into the market.” Freddie Mac (FHLMC).
 
San Francisco real estate December 2023 report cover featuring the Golden Gate Bridge.
 
Market update on improving economic indicators, falling mortgage rates, and a possible home-sales rebound in early 2024.
 
Definitions and disclosures about real estate market statistics, pricing measures, photo licensing, and Compass.
 
Bar chart shows U.S. mortgage-free homes increasing from 34.3% in 2013 to 39.3% in 2022.
 
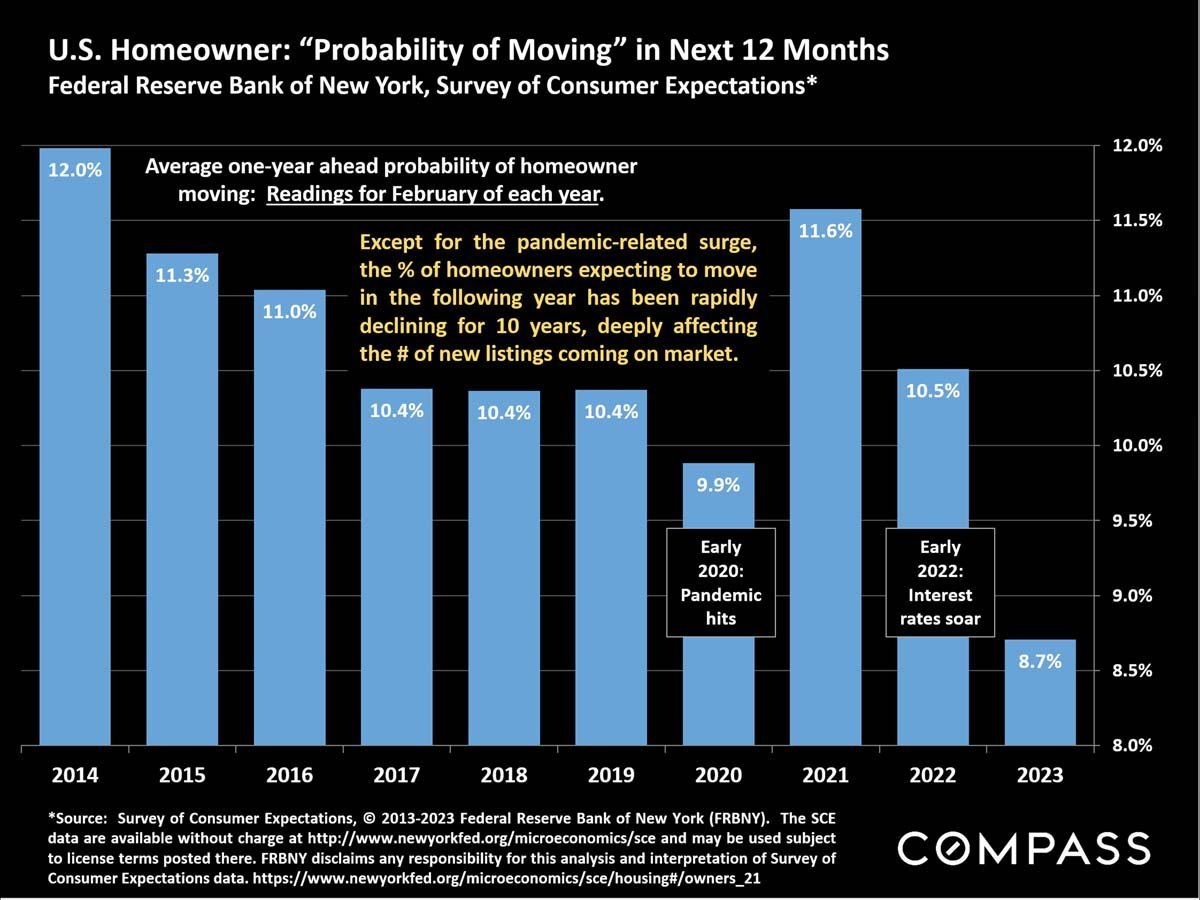
Chart of homeowners’ probability of moving, declining from 12.0% in 2014 to 8.7% in 2023.
 
Bar chart of San Francisco active and coming-soon home listings from February 2022 through December 2023.
 
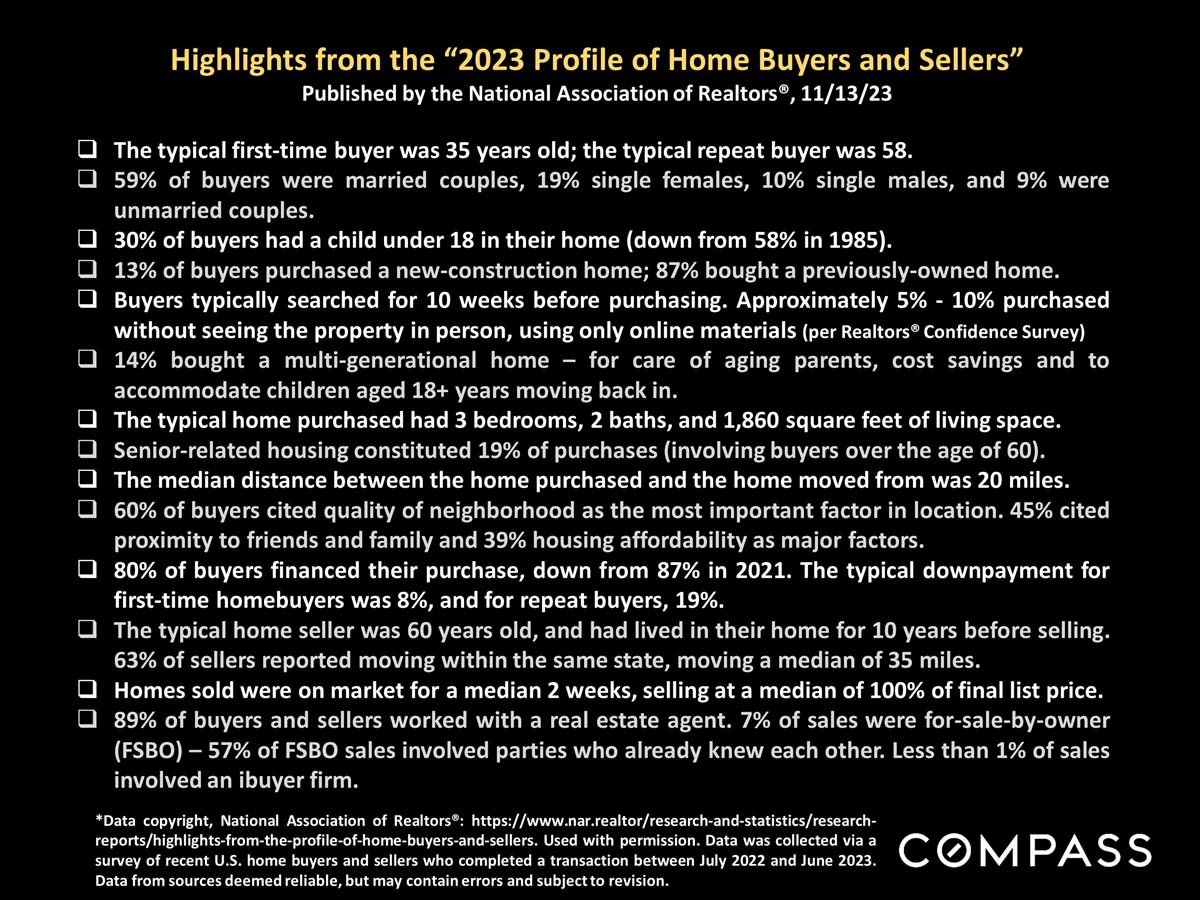
Home buyer and seller statistics infographic from the 2023 National Association of Realtors profile.
 
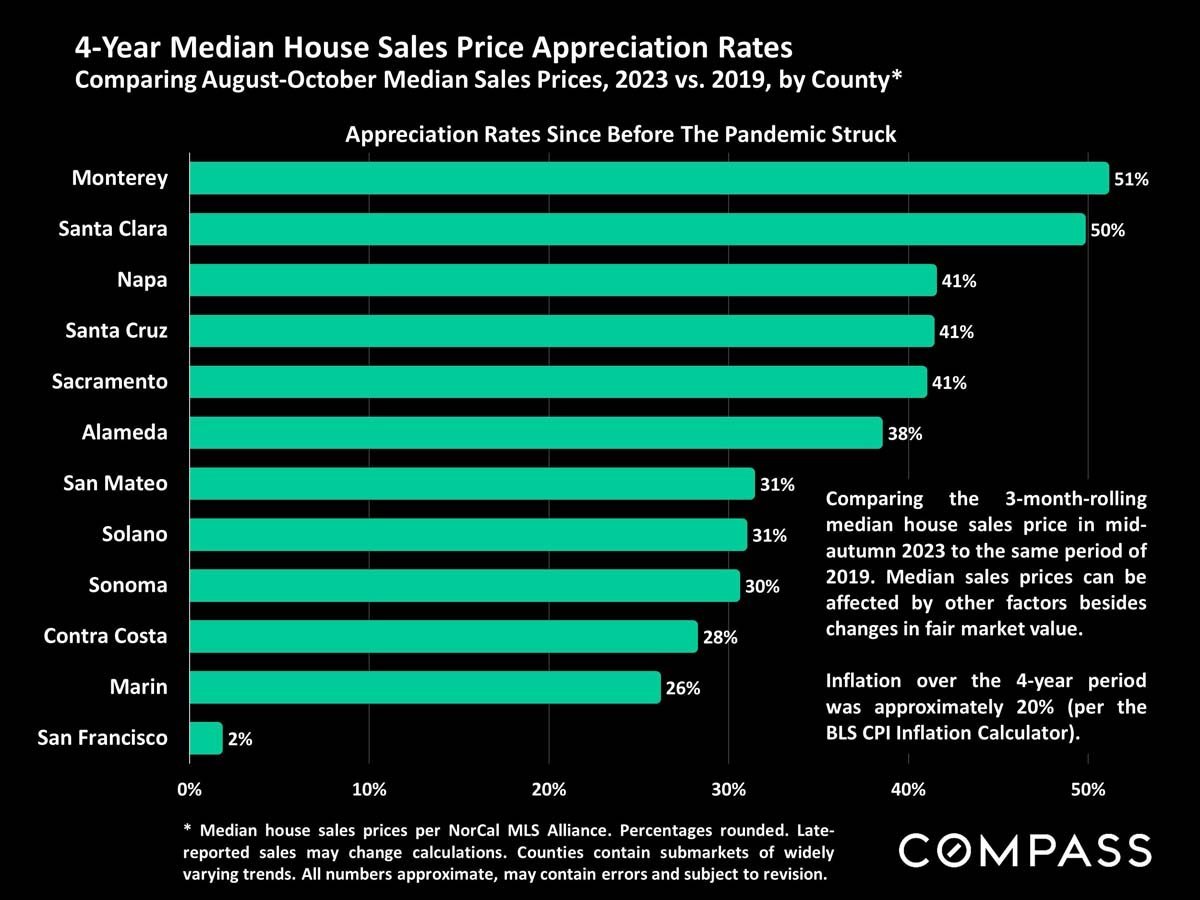
Chart comparing four-year median home sale price appreciation by Northern California county; San Francisco is lowest at 2%.
 
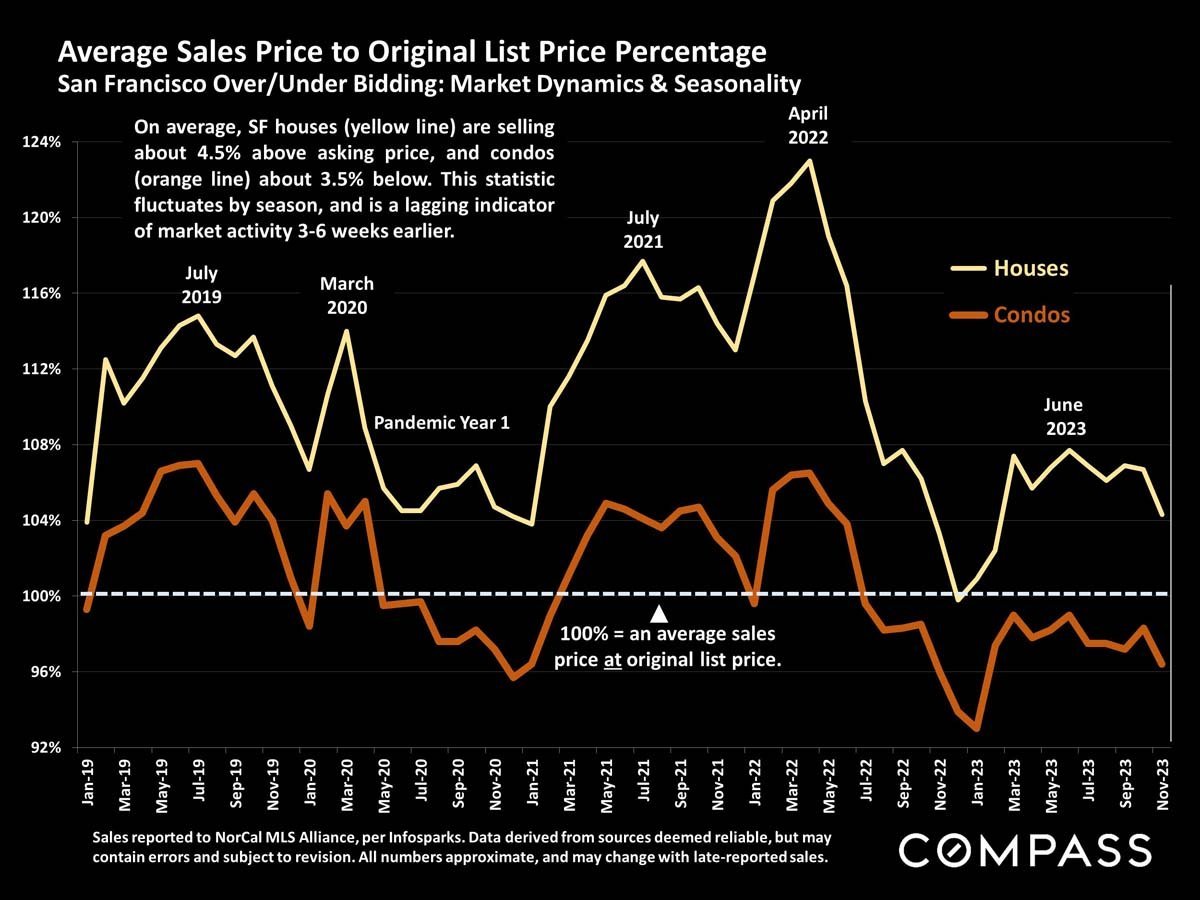
Chart comparing San Francisco house and condo sale prices to original list prices, January 2019–November 2023.
 
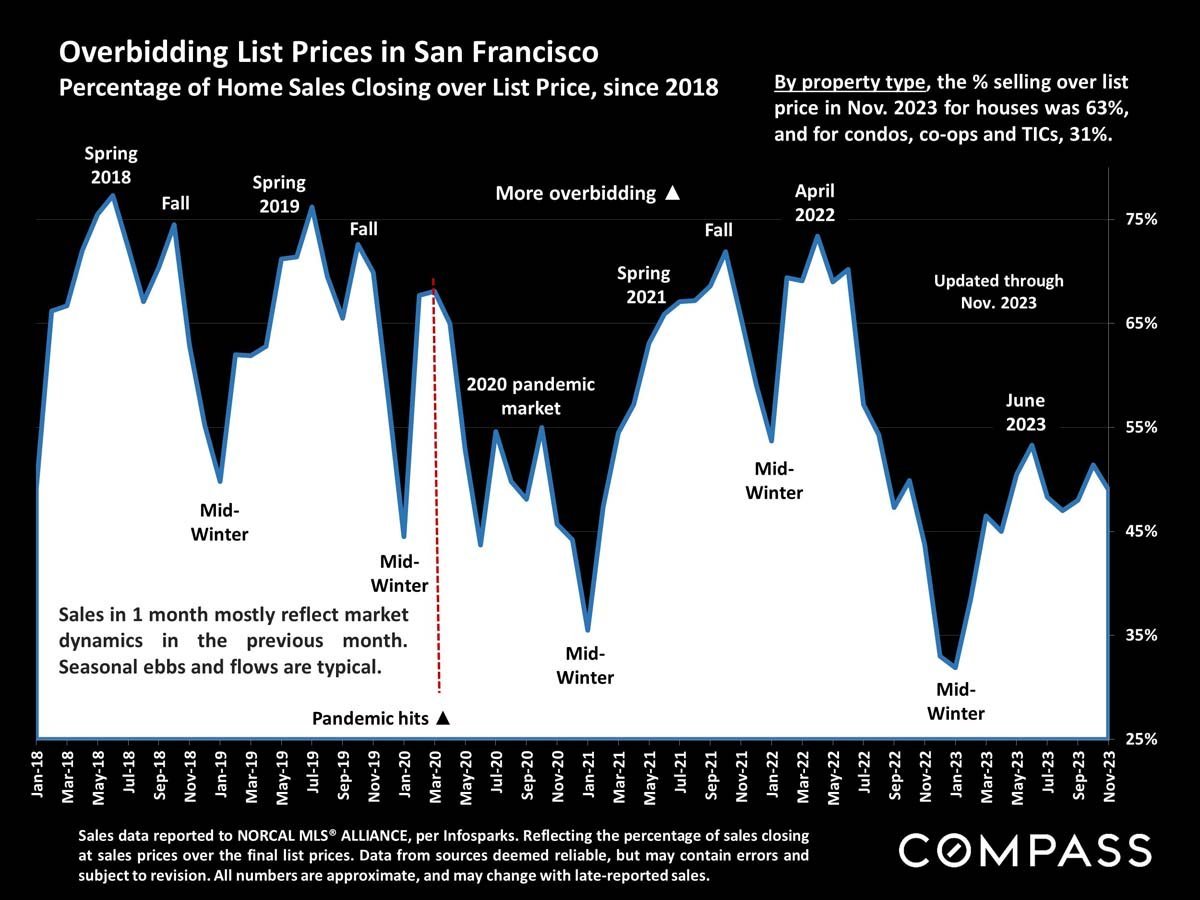
Chart of San Francisco home sales over list price, showing monthly trends from 2018 through November 2023.
 
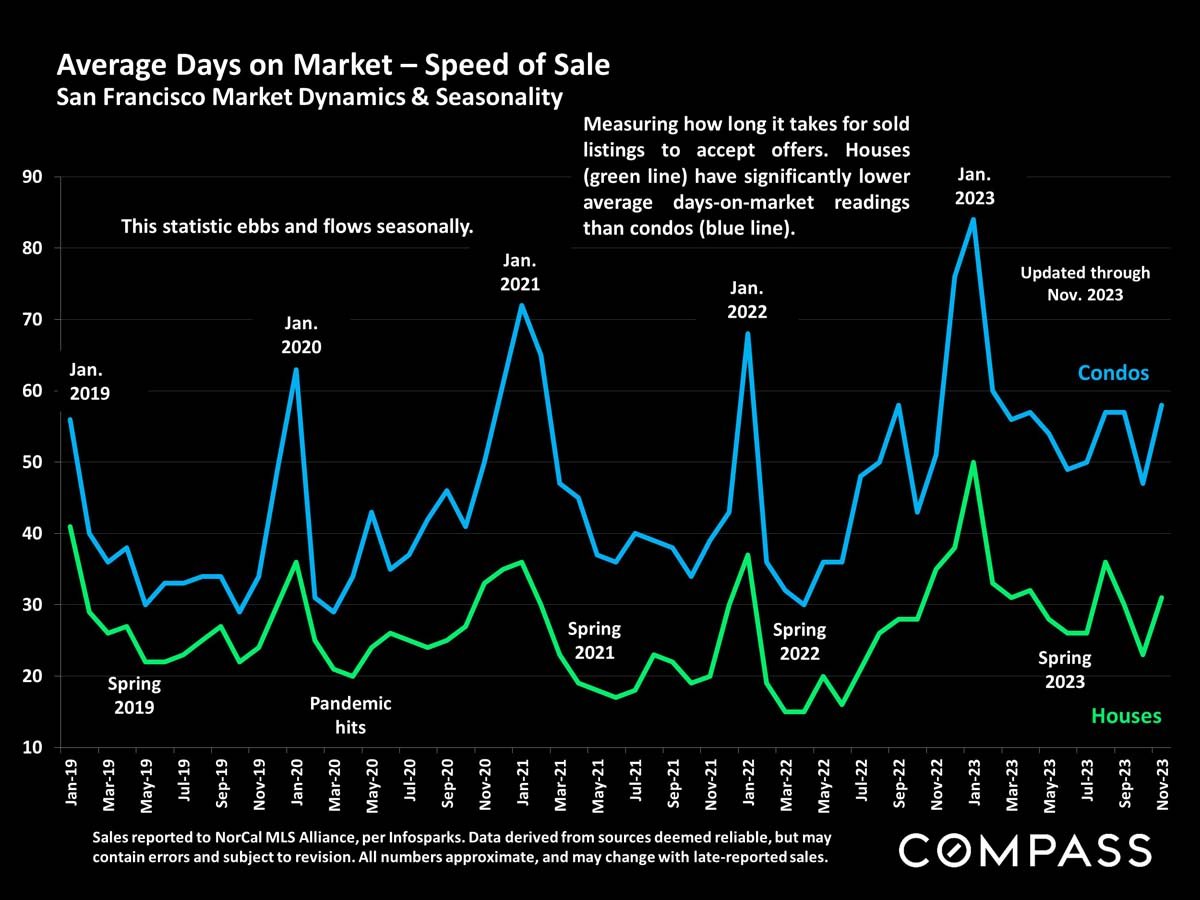
Chart compares San Francisco days on market for condos and houses, January 2019–November 2023; houses generally sell faster.
 
Chart comparing San Francisco condo and house days on market from 2019 through November 2023.
 
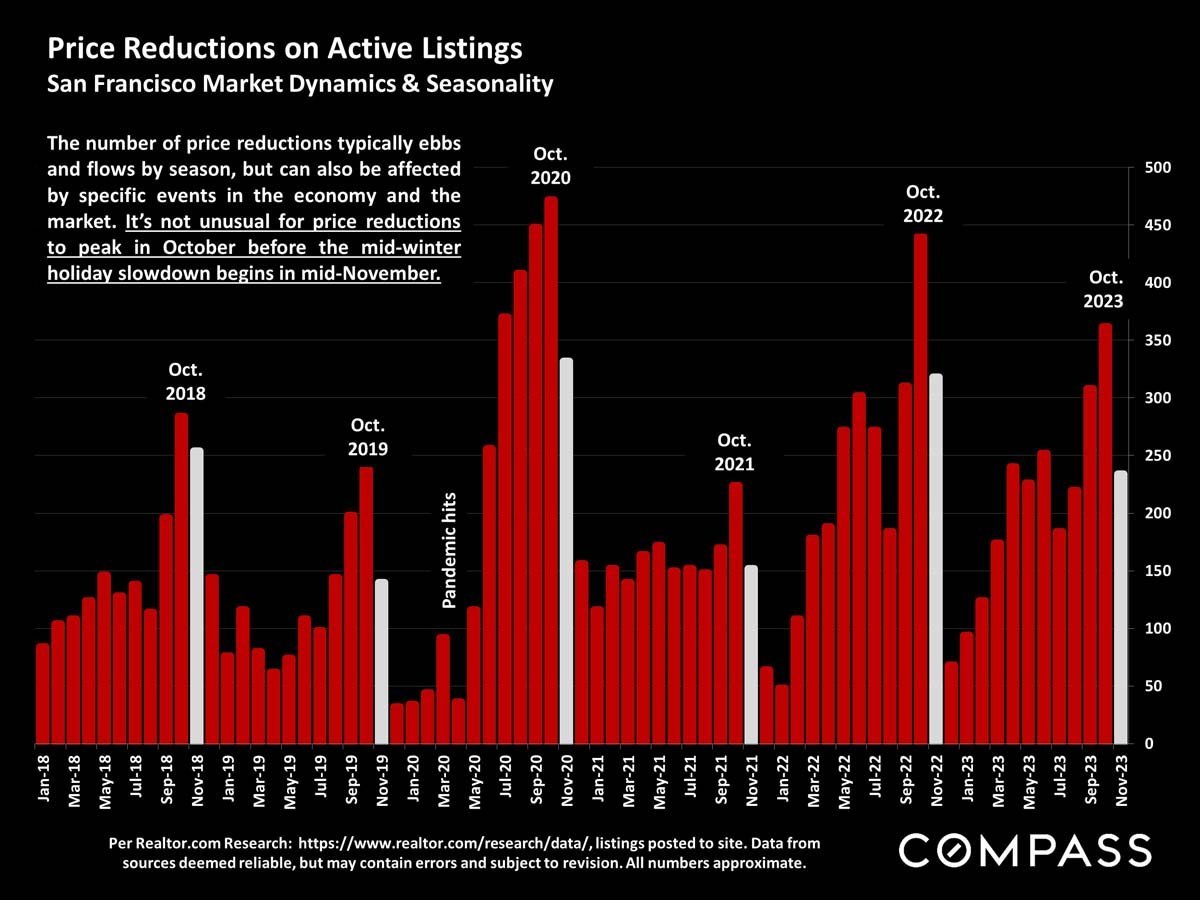
Chart of San Francisco active-listing price reductions from 2018 to 2023, with prominent October peaks.
 
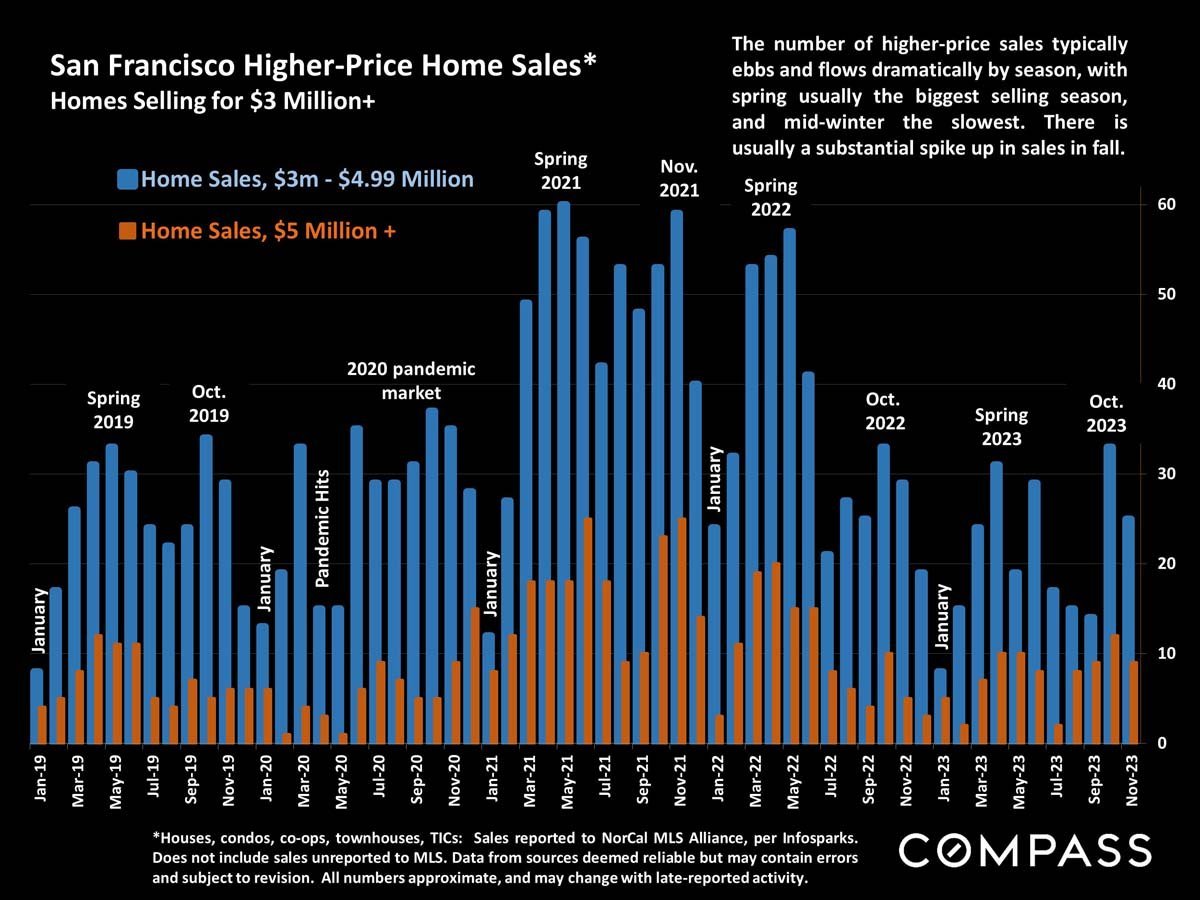
Chart comparing monthly San Francisco home sales priced at $3–4.99 million and $5 million or more, 2019–2023.
 
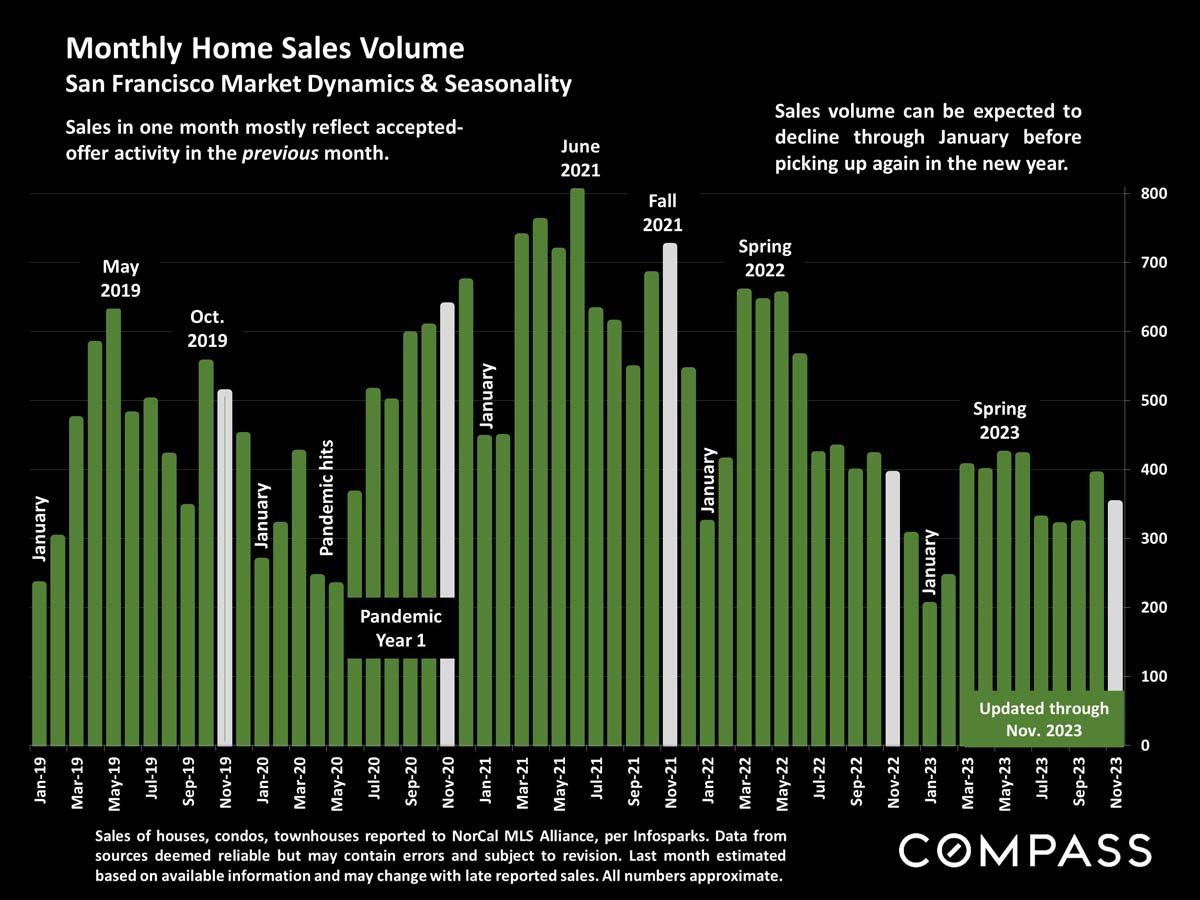
Chart of monthly San Francisco home sales from 2019 to 2023, with seasonal and pandemic annotations.
 
Chart of San Francisco pending listings from 2019 to 2023, with seasonal peaks and a pandemic marker.
 
San Francisco active listings trend chart, showing a pandemic-era supply surge and seasonal January lows.
 
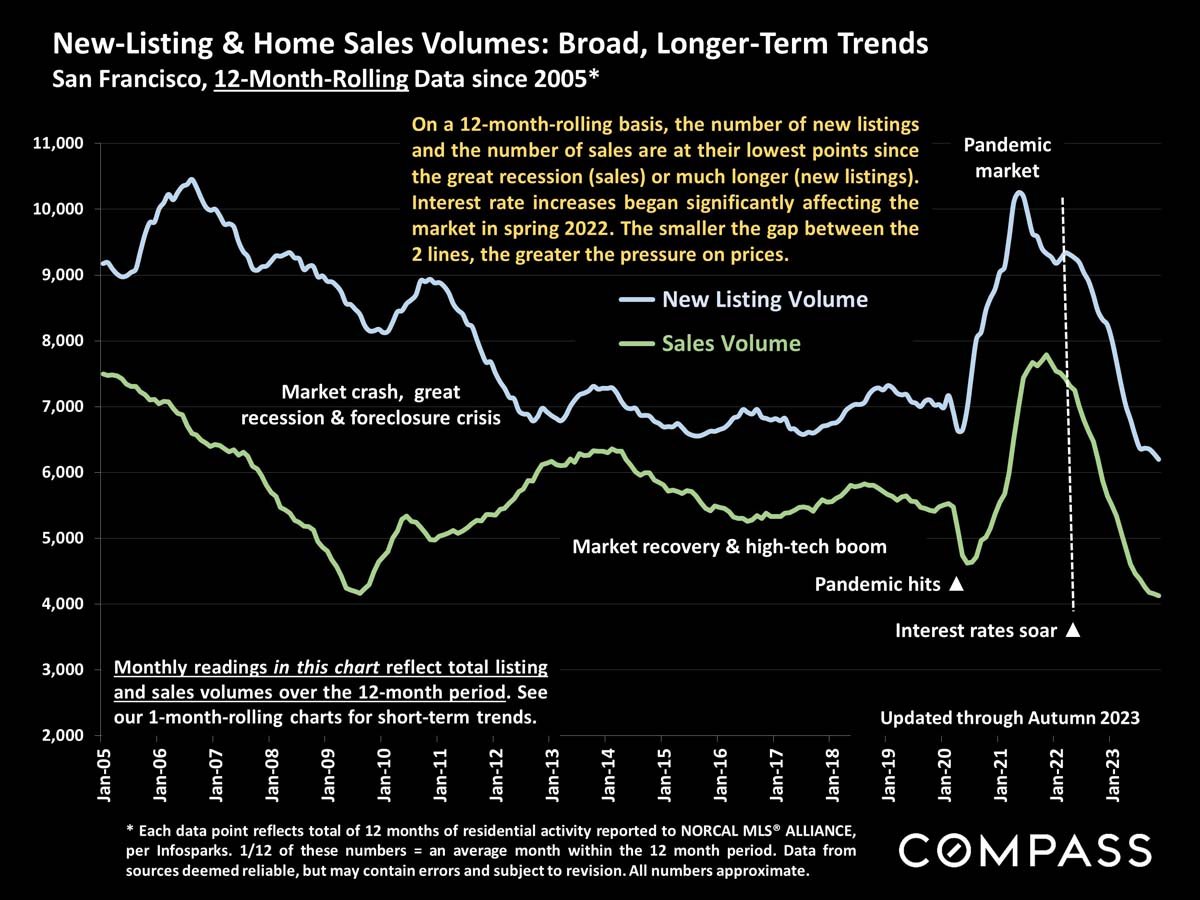
Chart tracks San Francisco new listings and home sales from 2005 to 2023, highlighting pandemic and interest-rate effects.
 
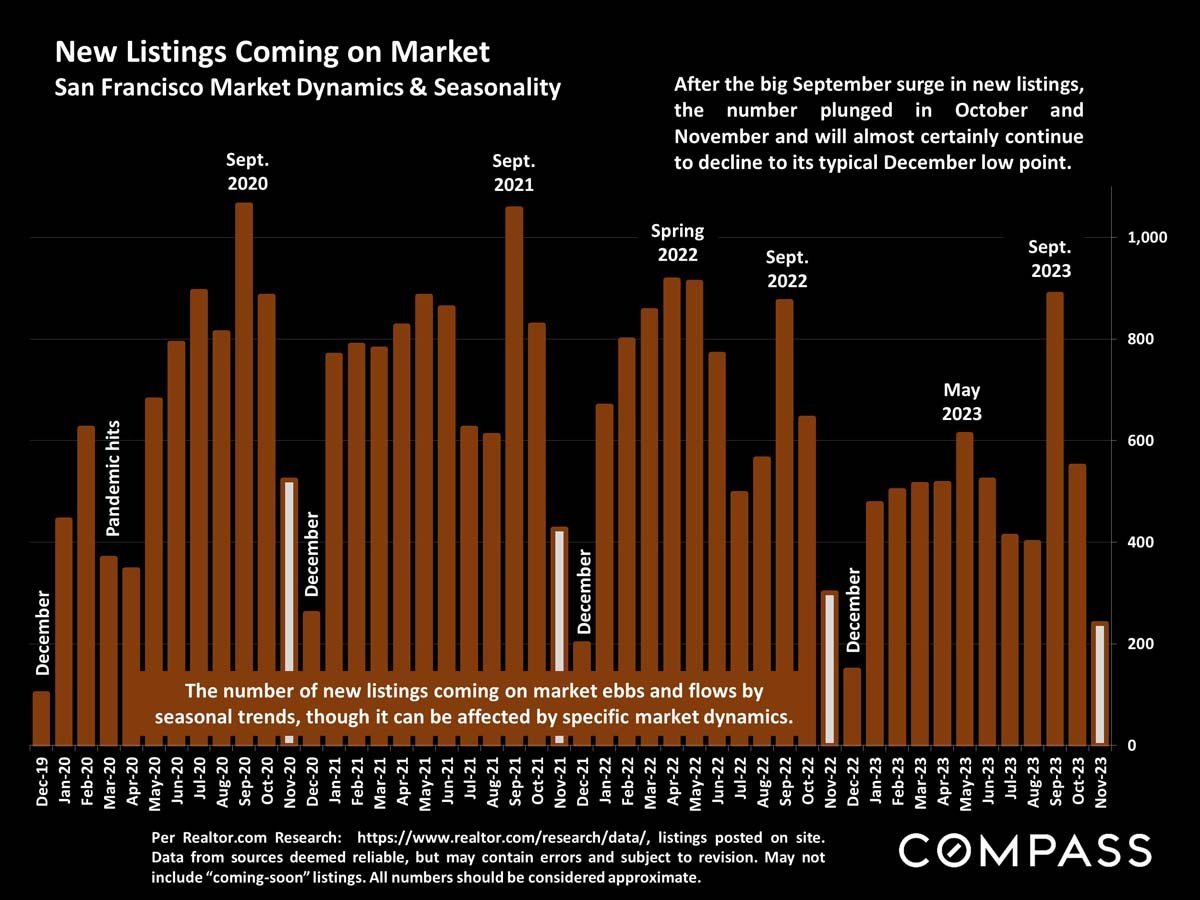
Chart of San Francisco new listings from December 2019 to November 2023, showing September peaks and typical December lows.
 
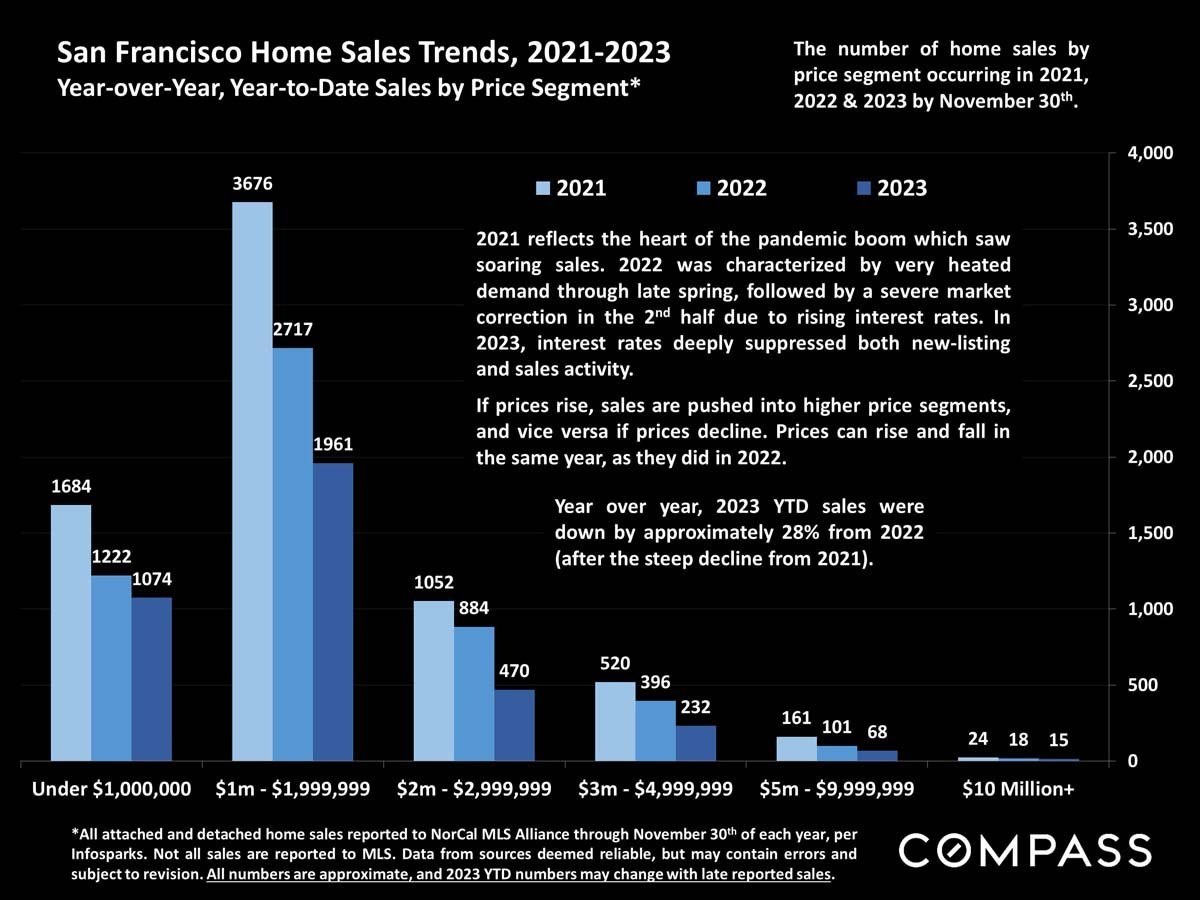
San Francisco home sales by price segment, charted for 2021–2023 with sales down about 28% year over year.
 
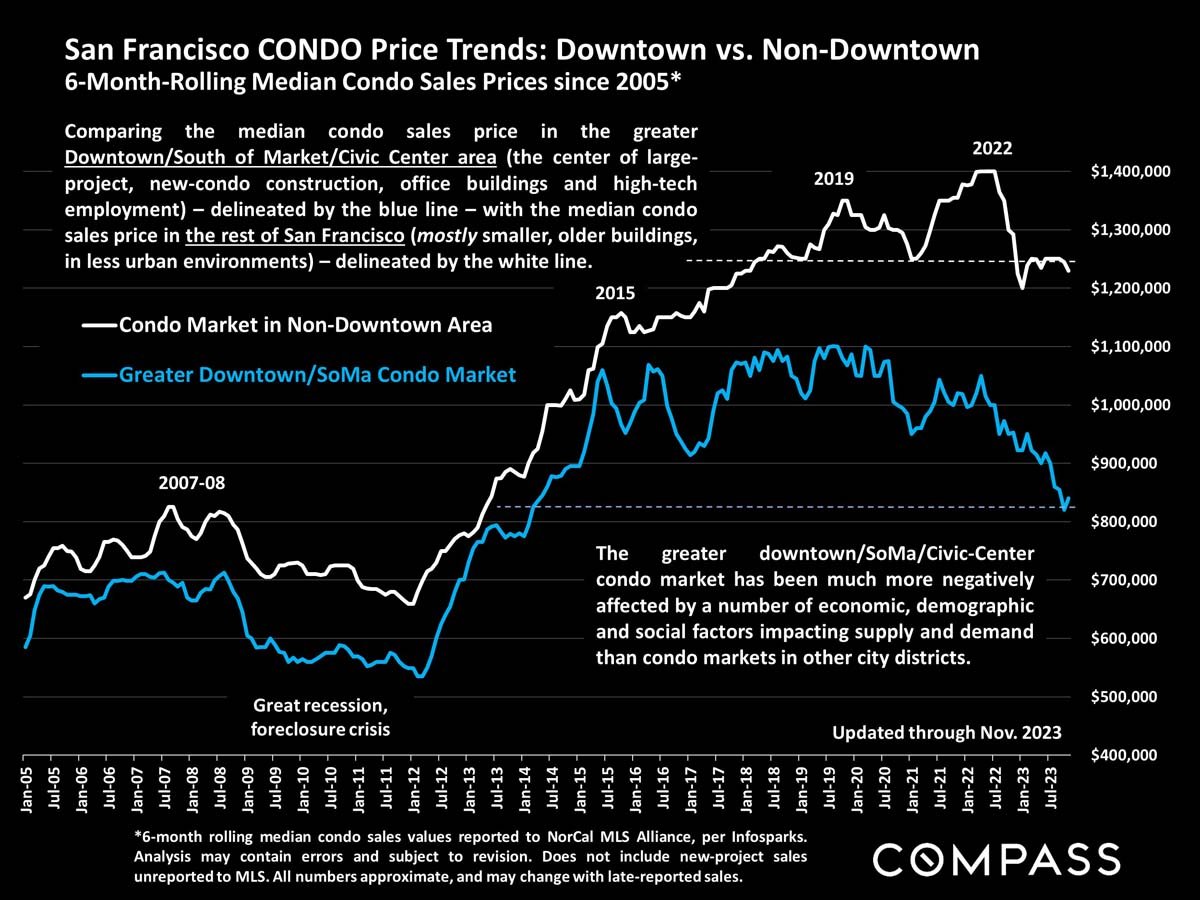
San Francisco condo price trends chart comparing downtown/SoMa and non-downtown median sales prices, 2005–2023.
 
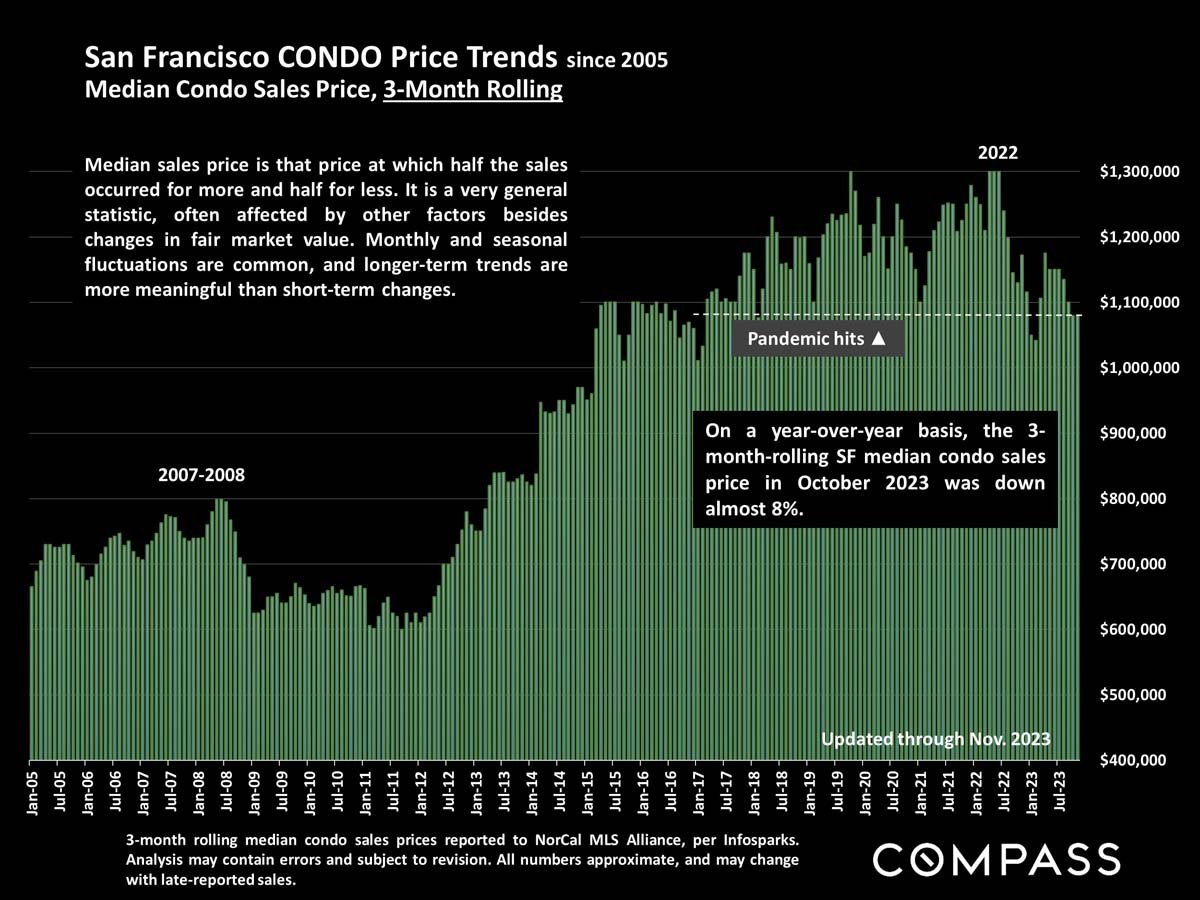
Bar chart of San Francisco condo median sale prices from 2005 to November 2023.
 
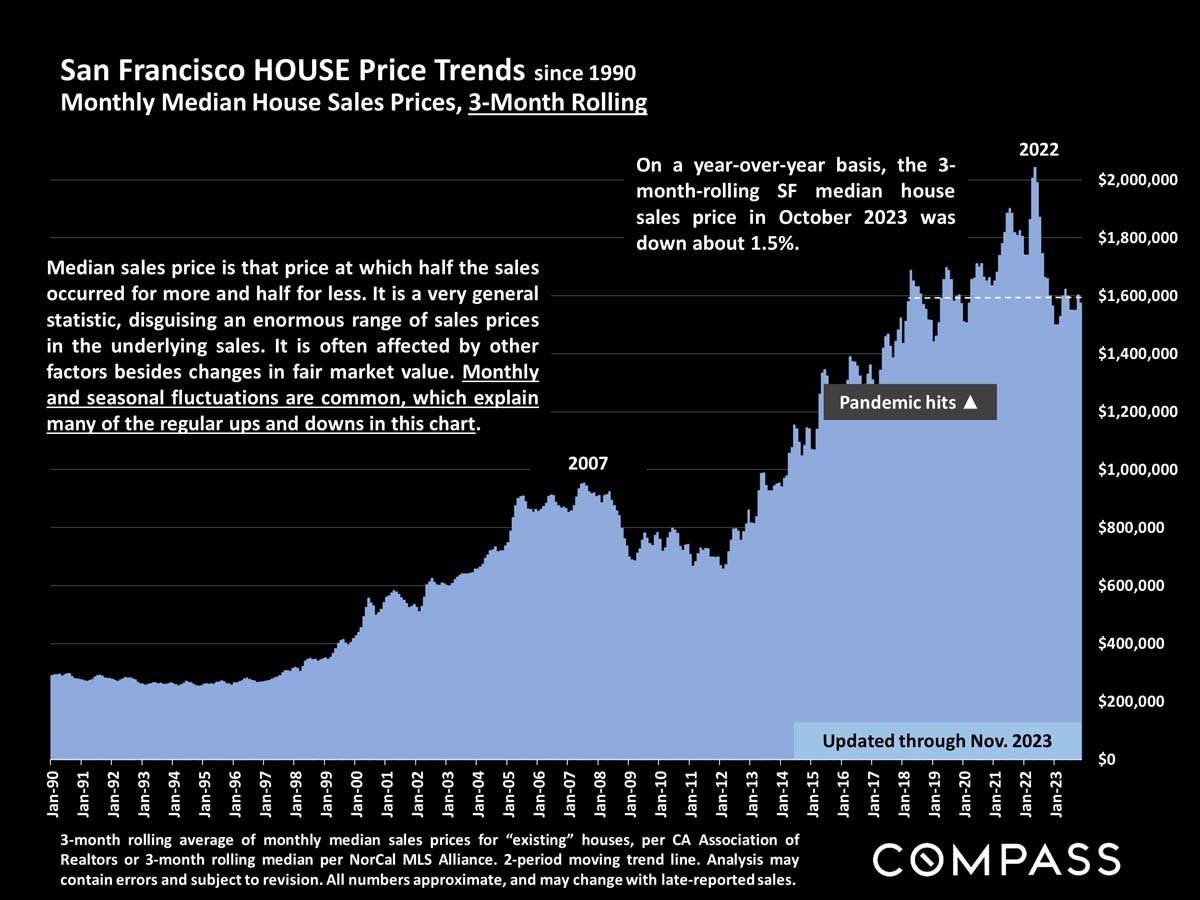
Chart of San Francisco median house prices from 1990 to November 2023, peaking above $2 million in 2022.
 
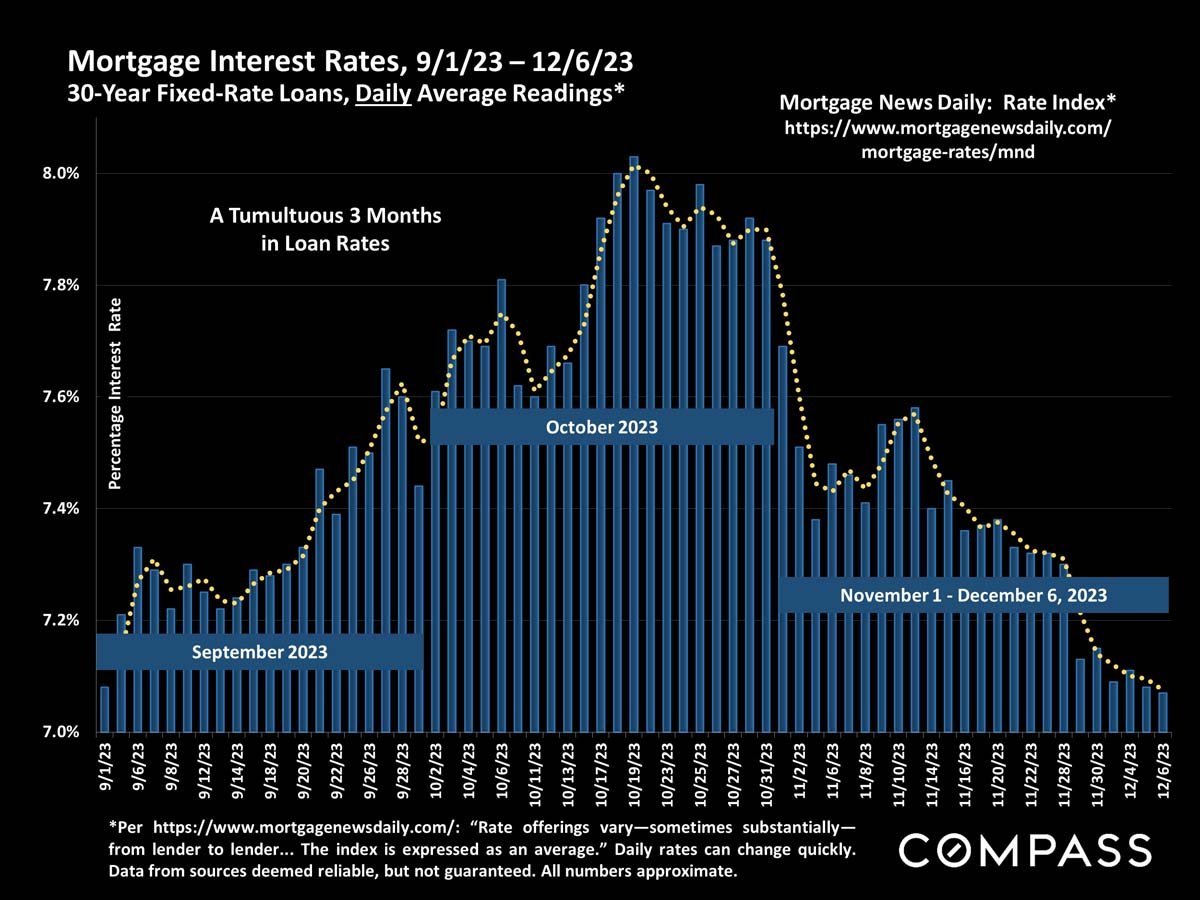
Chart of 30-year mortgage rates from September to December 2023, peaking above 8% in October before declining.

Work With Jane

Get assistance in determining the current property value, crafting a competitive offer, writing and negotiating a contract, and much more. Contact me today.

Follow Me on Instagram