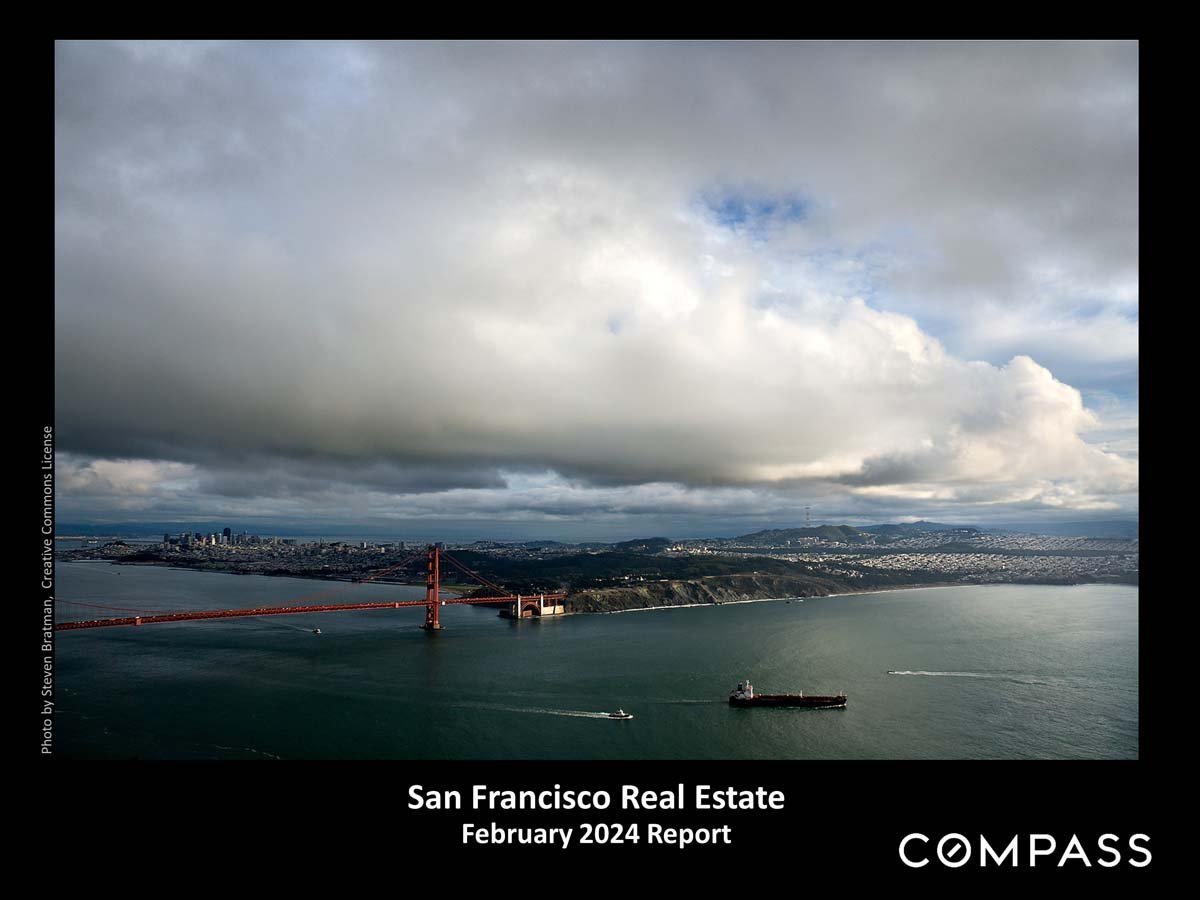
San Francisco Real Estate February 2024 Report

San Francisco Home Prices, Market Conditions & Trends February 2024

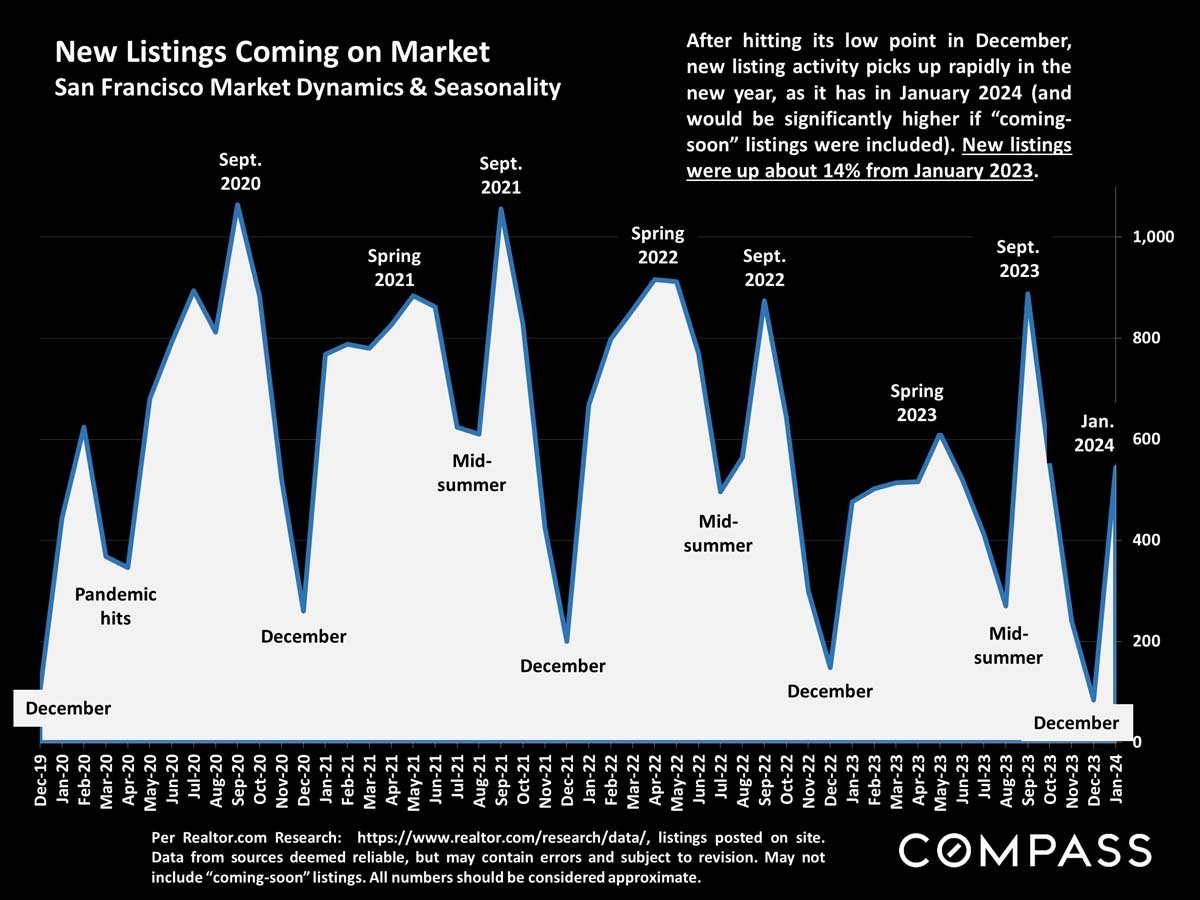
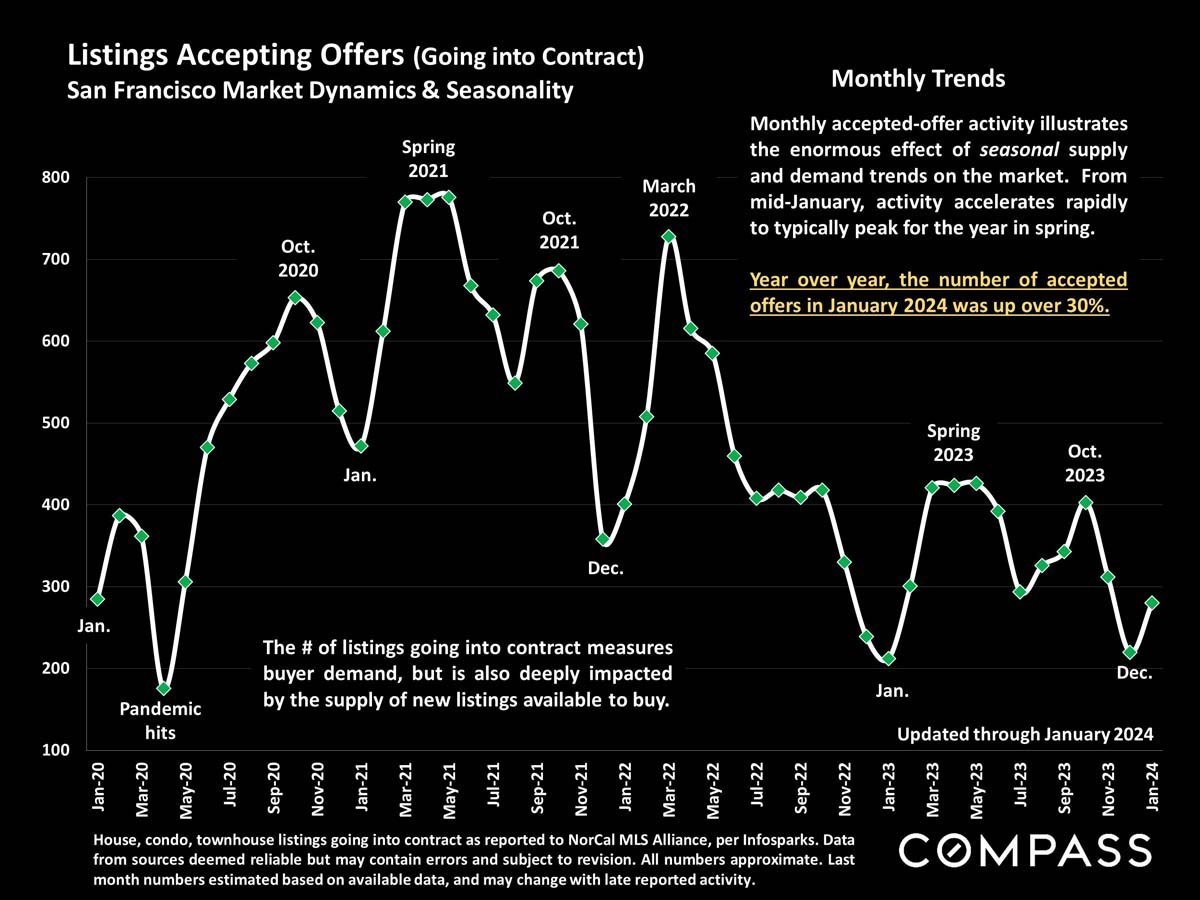
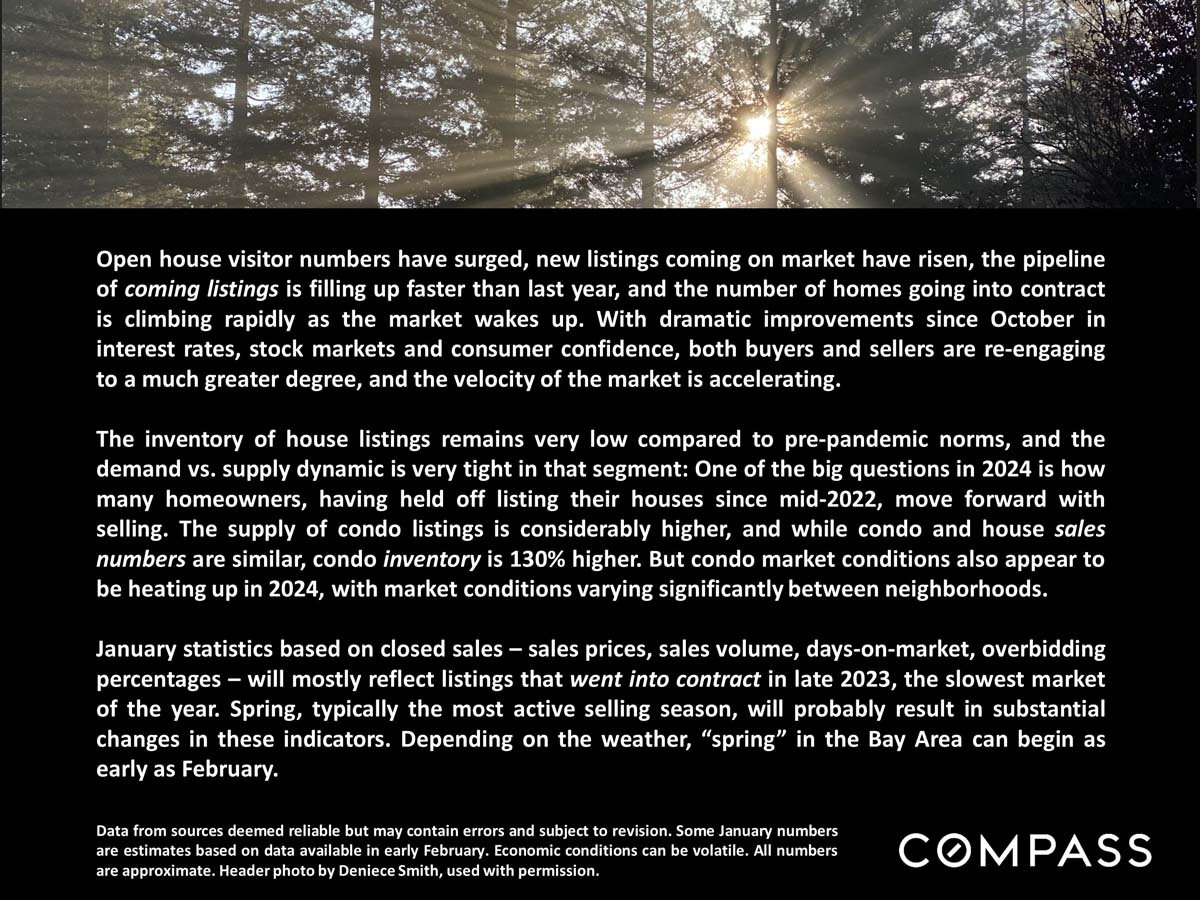
Open house visitor numbers have surged, new listings coming on the market have risen, the pipeline of coming listings is filling up faster than last year, and the number of homes going into contract is climbing rapidly as the market wakes up.
 
San Francisco Real Estate February 2024 Report
 
San Francisco housing market update discussing rising activity, low house inventory, and higher condo inventory.
 
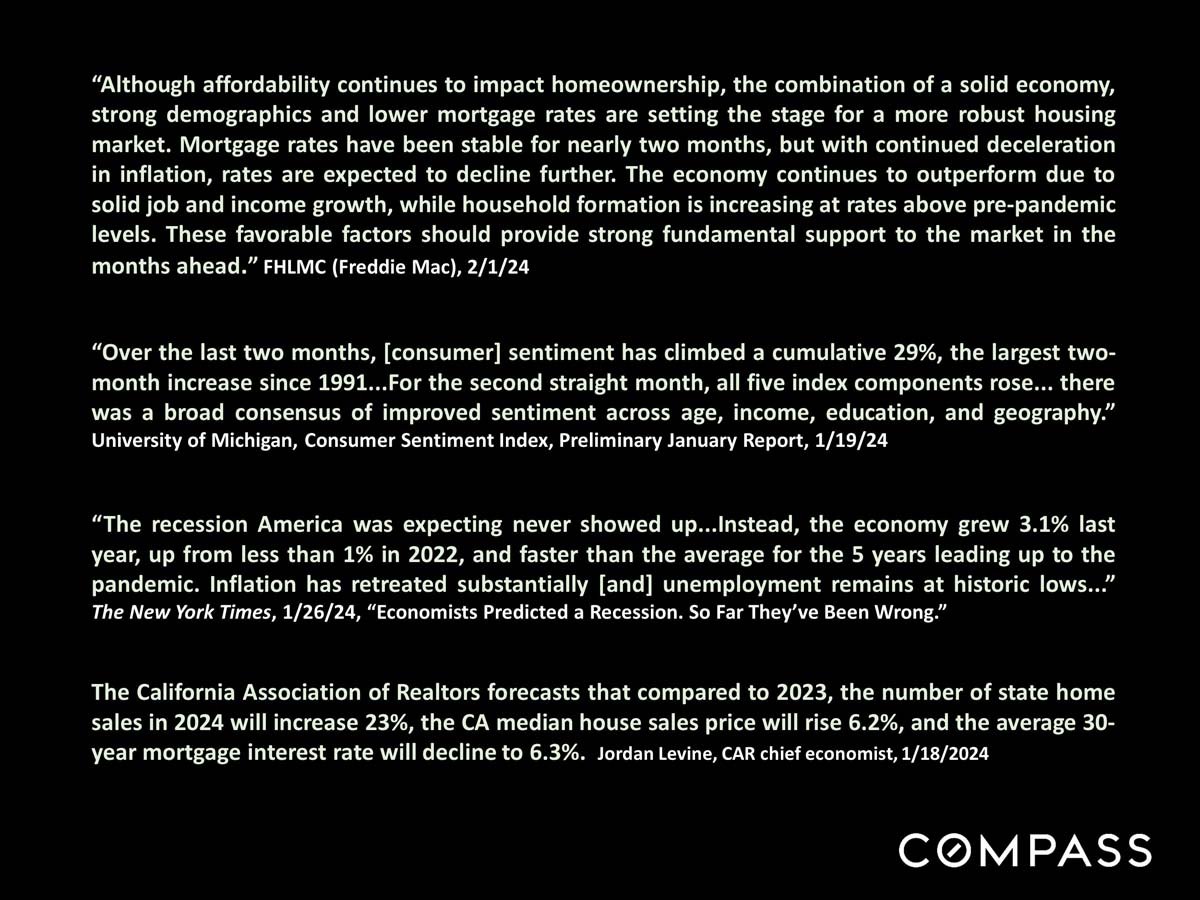
Graphic with housing market and economic outlook quotes, California Realtors forecasts, and Compass branding.
 
Chart of San Francisco new listings from December 2019 to January 2024, showing recurring seasonal peaks and winter lows.
 
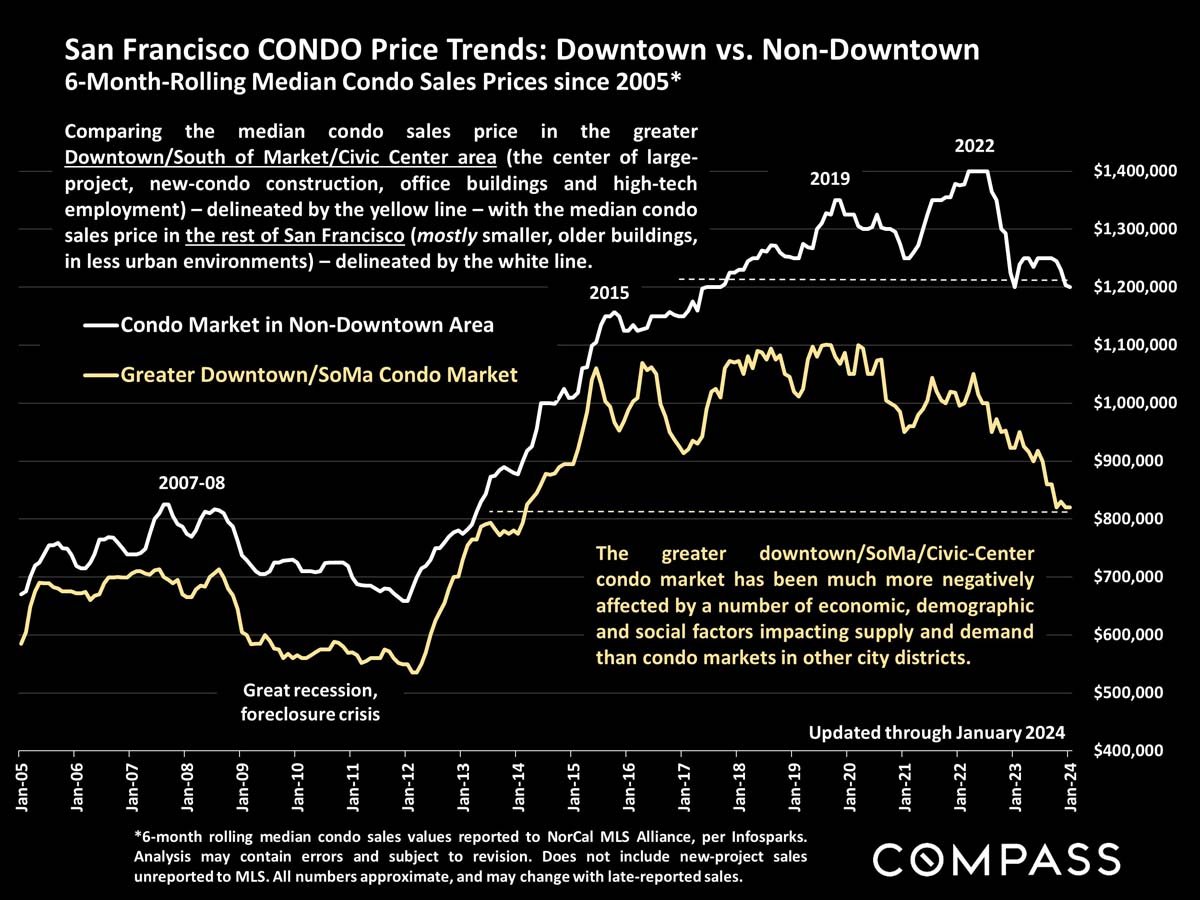
Chart comparing San Francisco downtown and non-downtown median condo prices from 2005 through January 2024.
 
Chart of San Francisco listings going into contract, showing seasonal trends from January 2020 through January 2024.
 
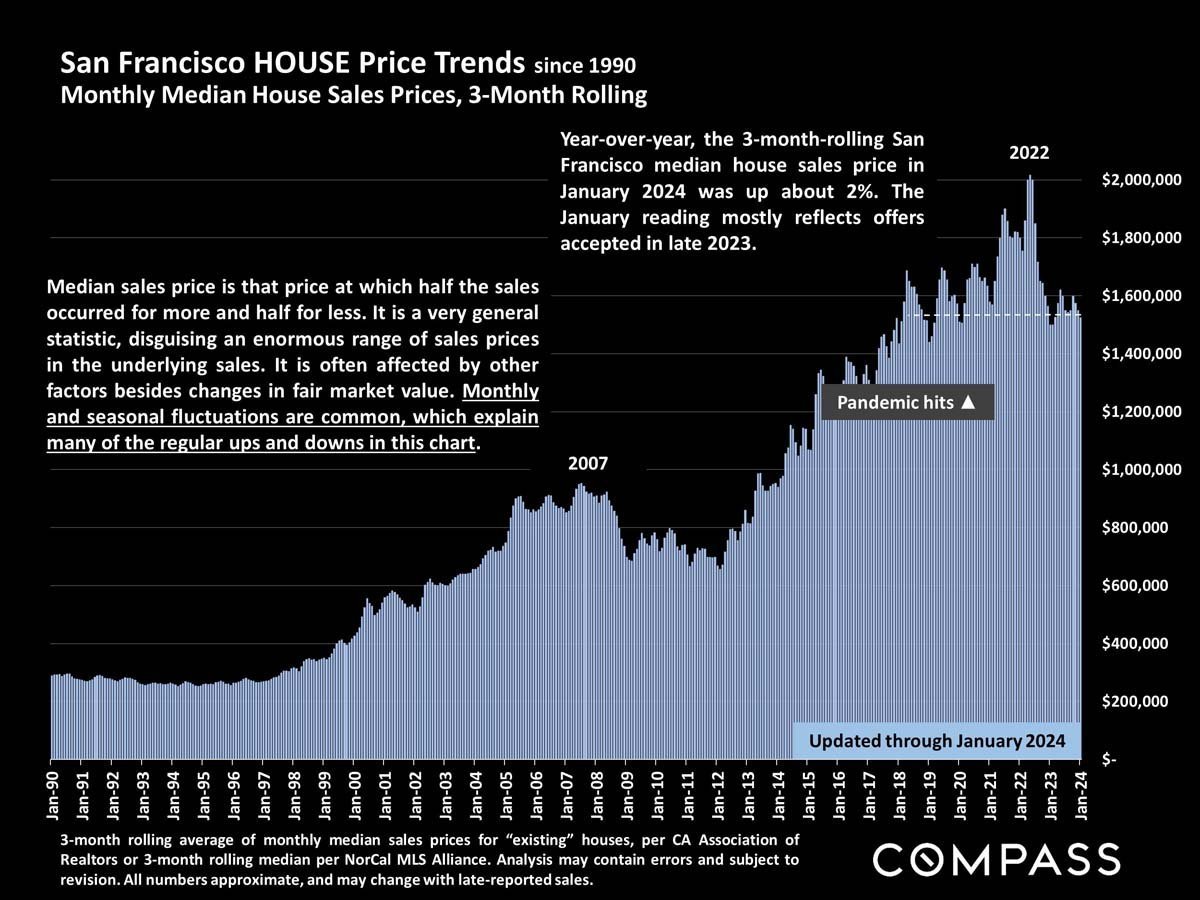
Chart of San Francisco median house prices, 1990–2024, with a 2022 peak near $2 million.
 
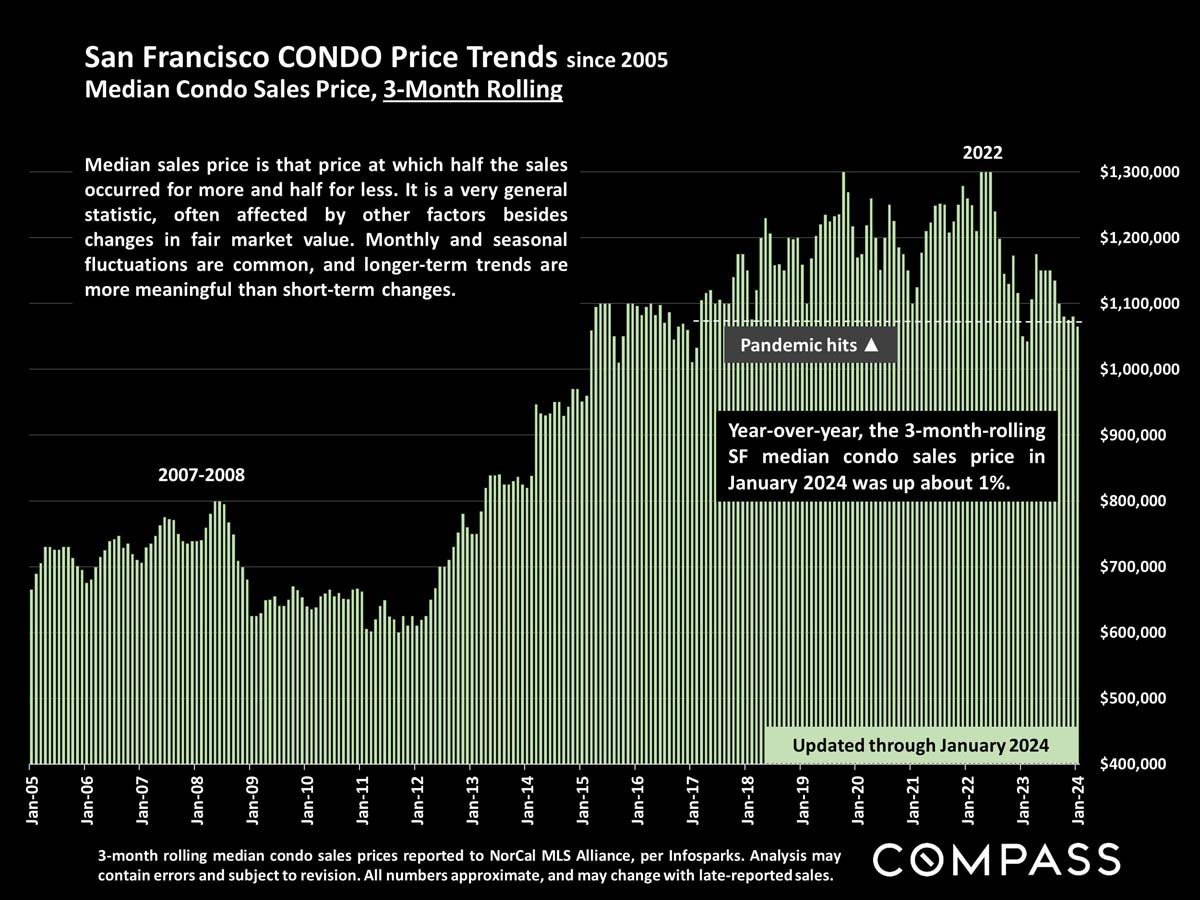
San Francisco condo price trends chart, with monthly bars through January 2024 and a note on the 1% year-over-year increase.
 
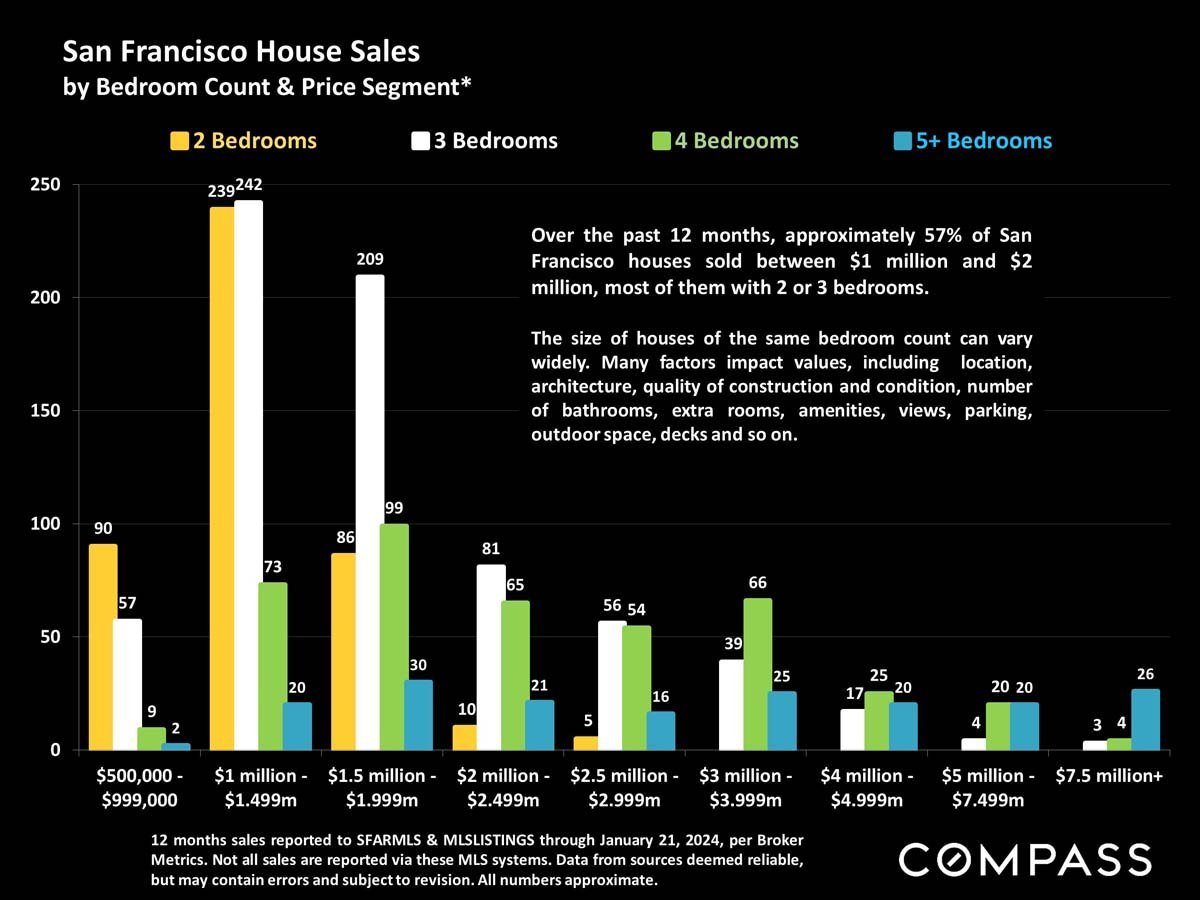
Chart of San Francisco house sales by bedroom count and price segment, with most sales between $1 million and $2 million.
 
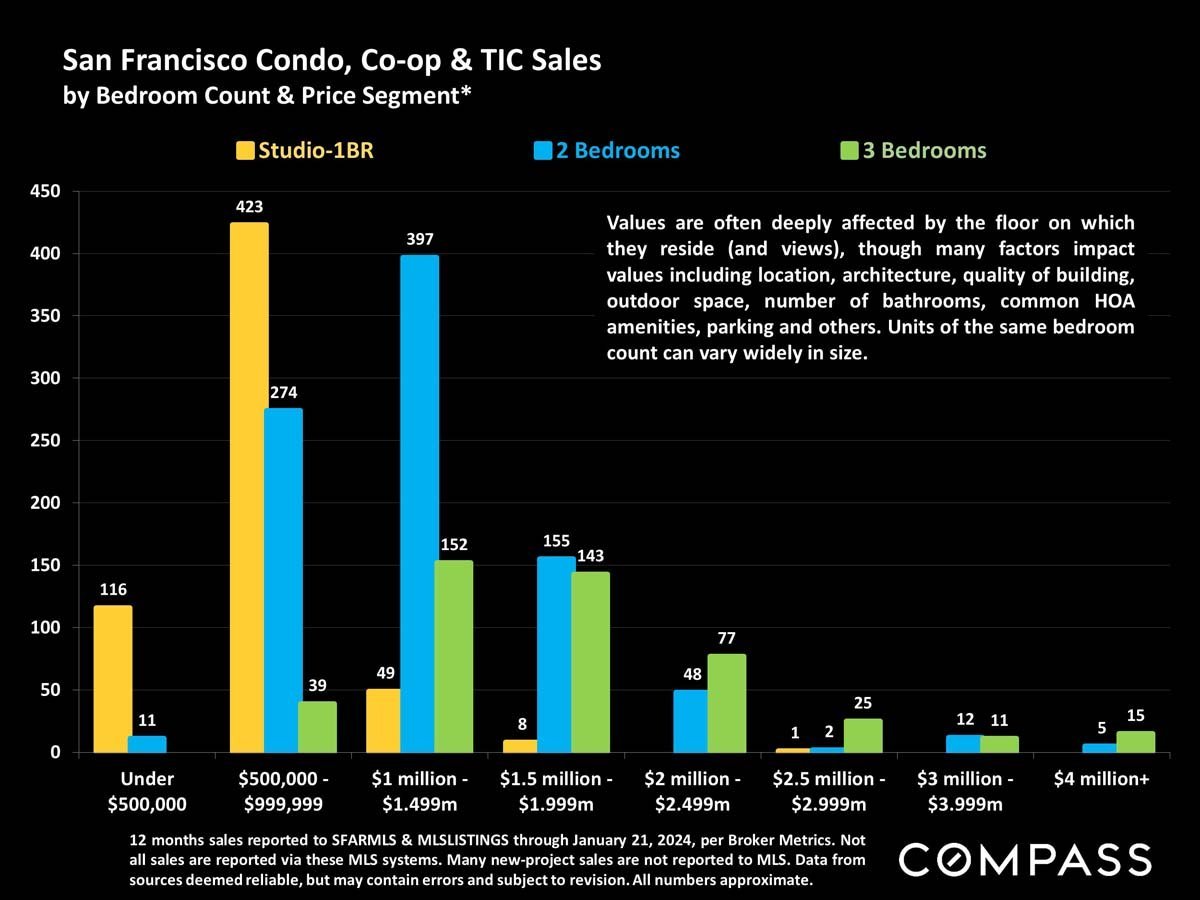
Bar chart of San Francisco condo, co-op and TIC sales by bedroom count and price segment, with sales highest below $1.5 million.
 
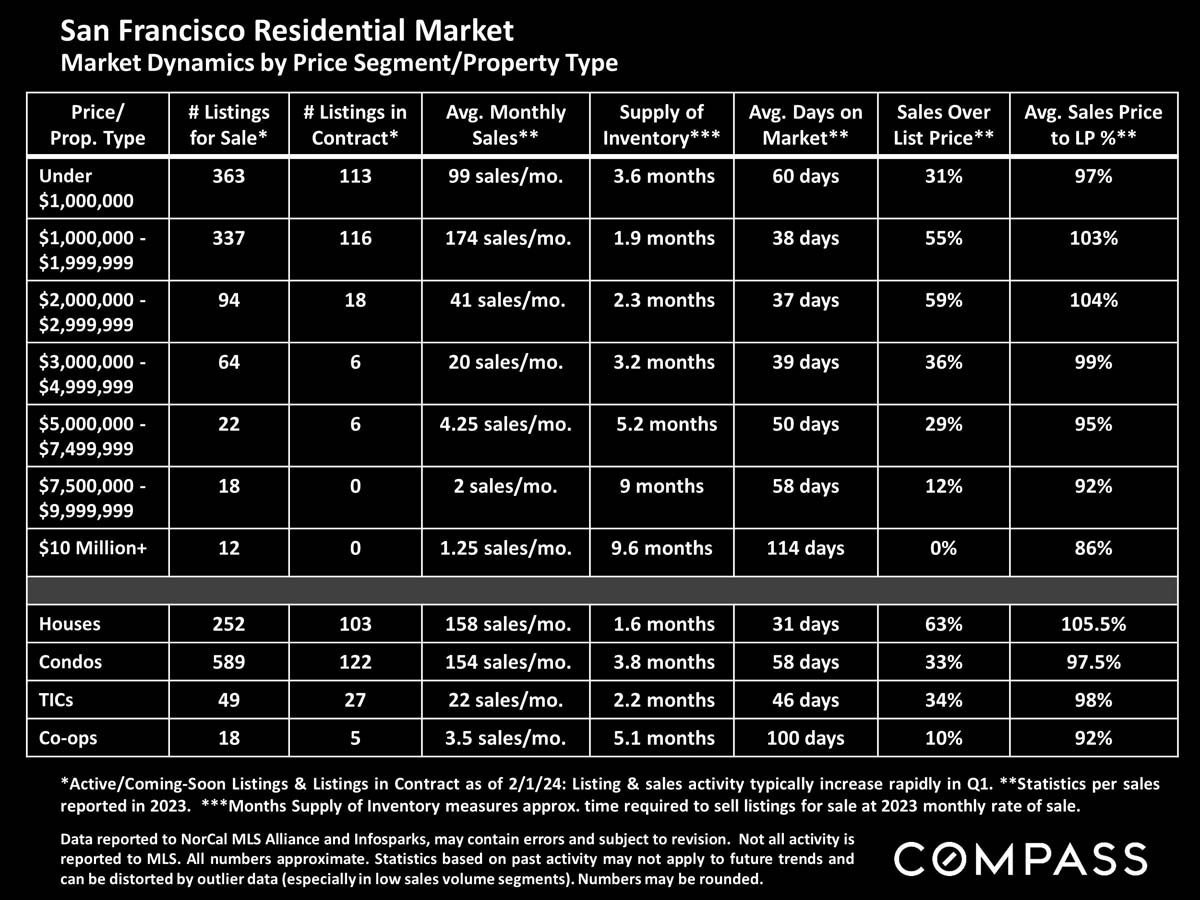
San Francisco housing market table comparing activity by price range and property type, with Compass branding.
 
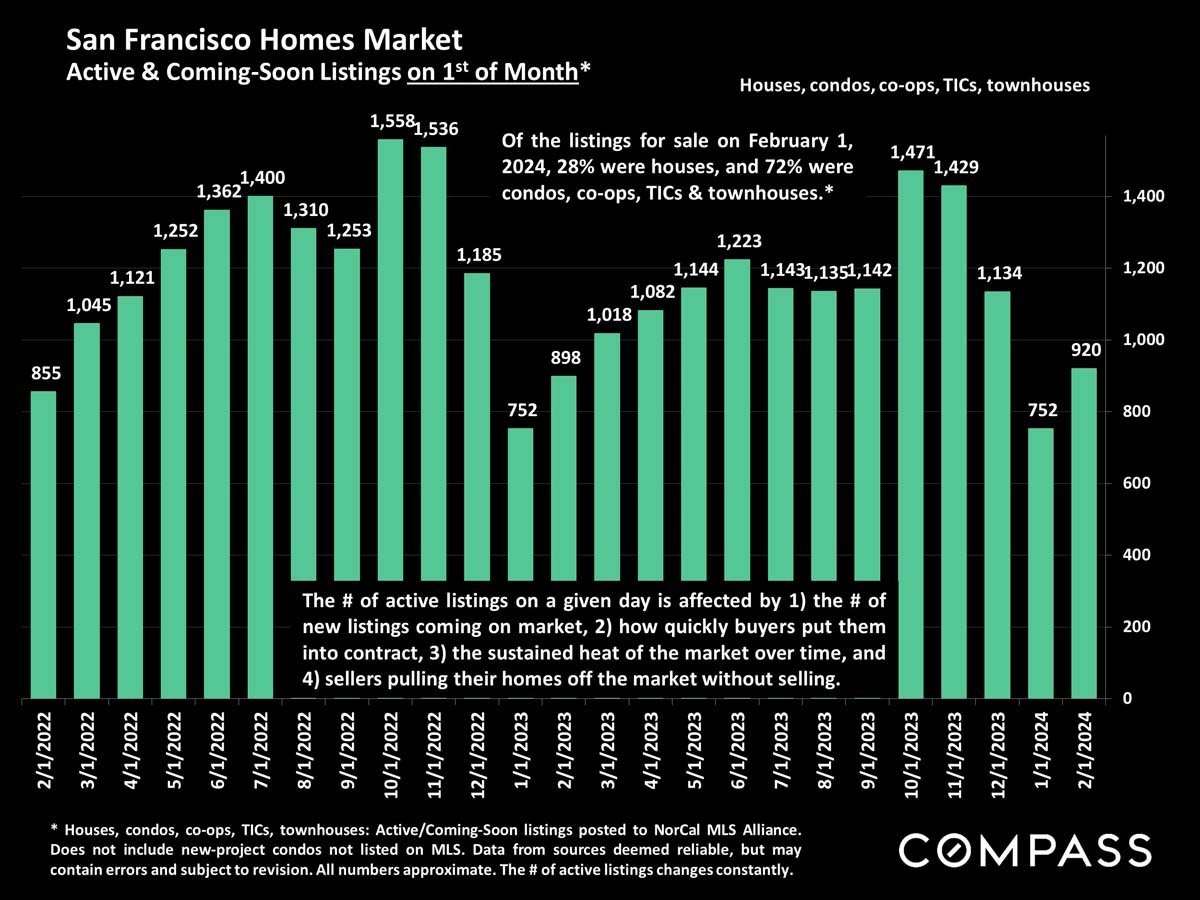
Bar chart of San Francisco active and coming-soon home listings, February 2022–February 2024.
 
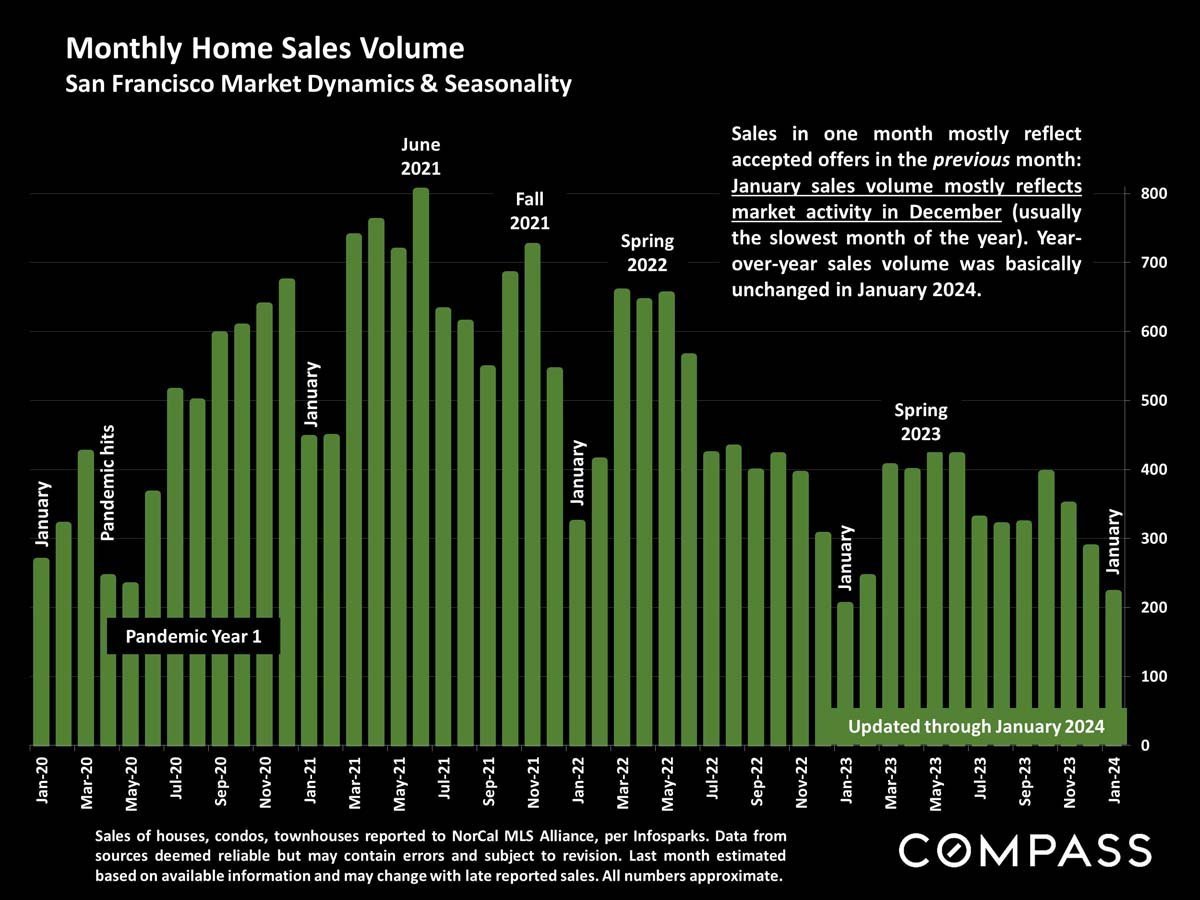
Chart of monthly San Francisco home sales, January 2020–January 2024, with green bars and seasonal annotations.
 
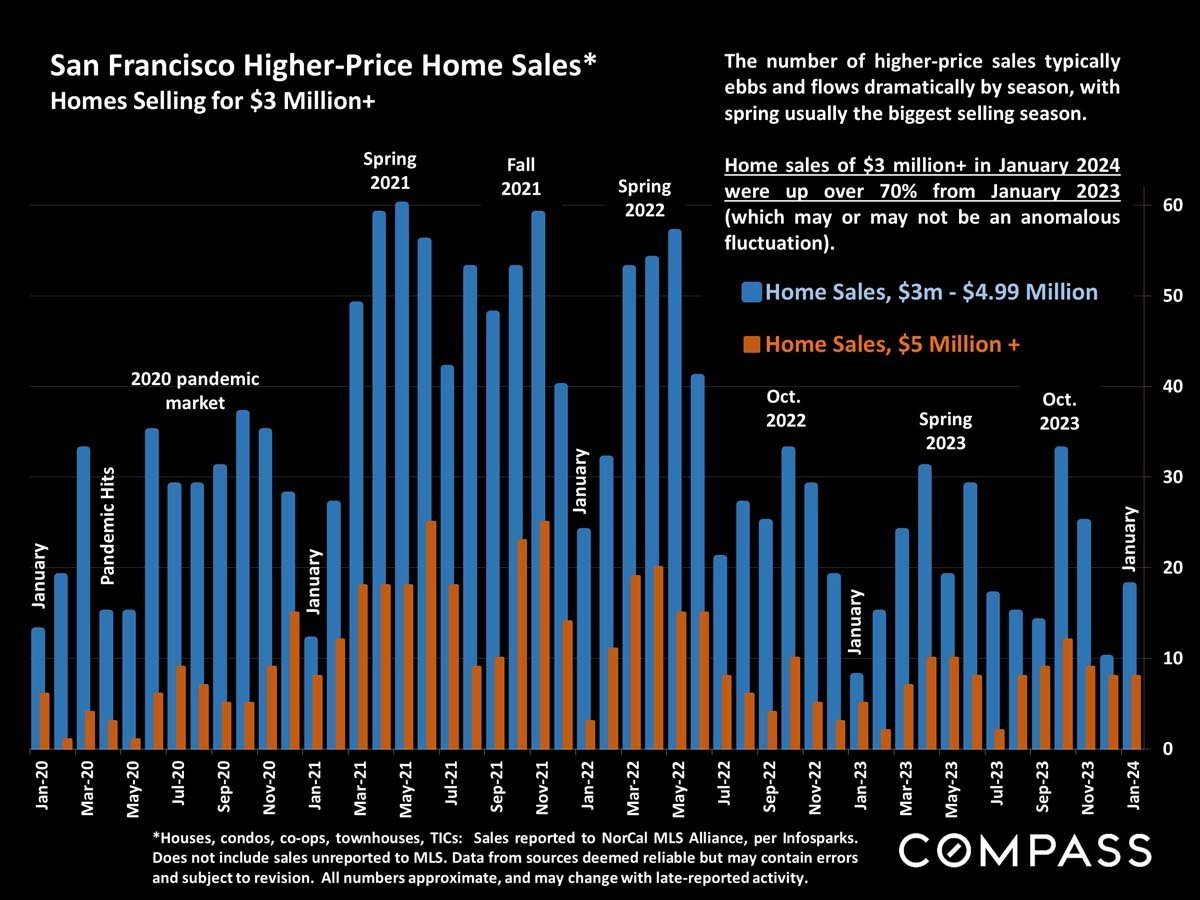
Chart of San Francisco home sales above $3 million, with monthly sales from 2020 to January 2024 and seasonal annotations.
 
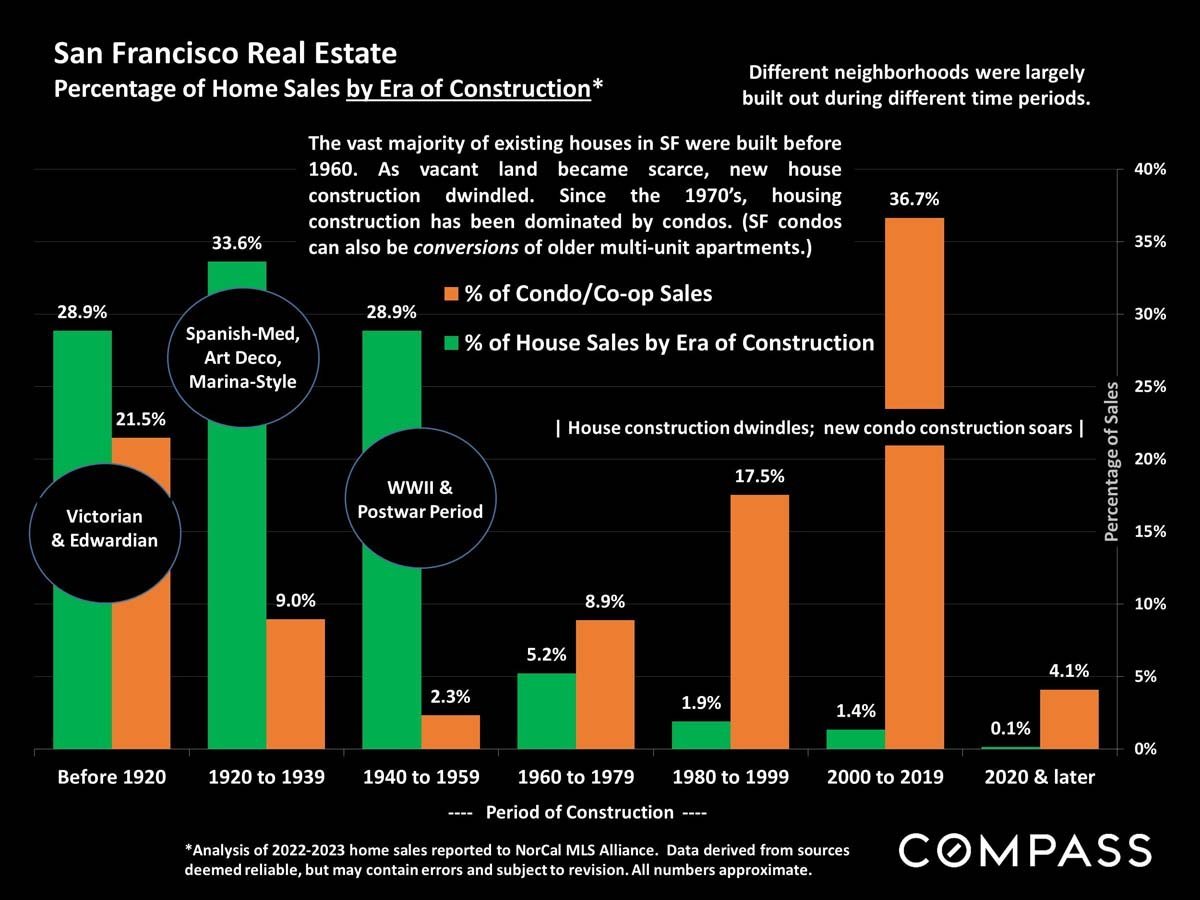
Chart comparing San Francisco house and condo sales by construction era; condo sales peak for homes built 2000–2019.
 
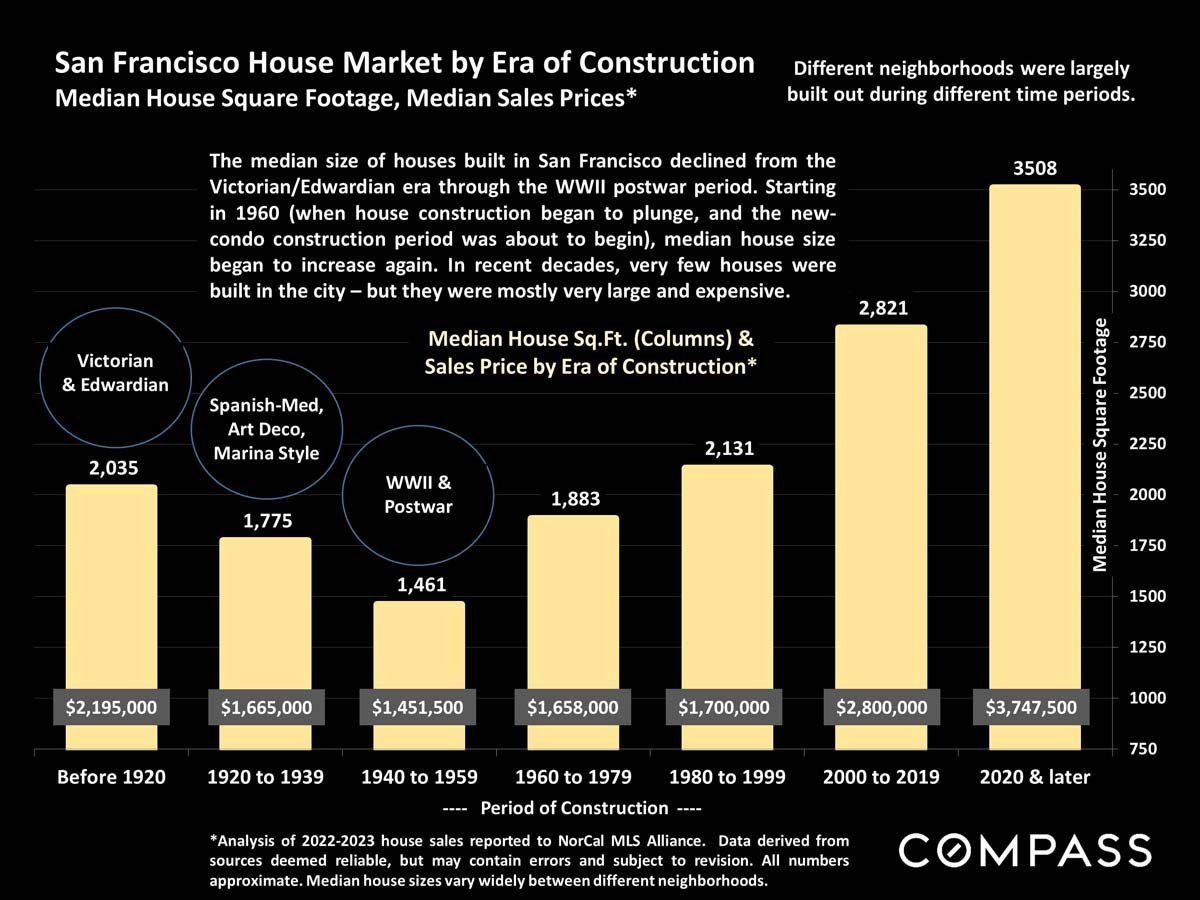
Chart comparing San Francisco median house sizes and sales prices by construction era, with the largest homes built since 2020.
 
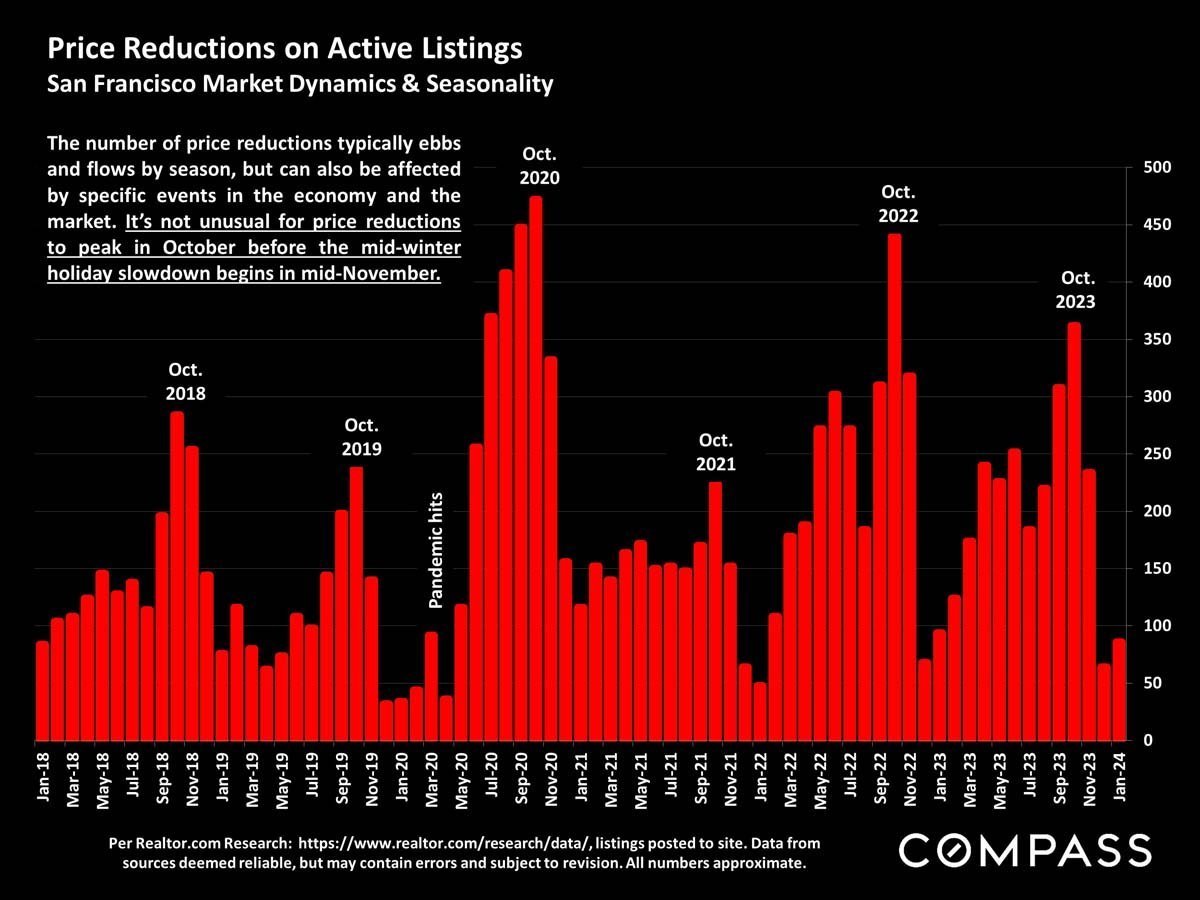
San Francisco price-reduction chart, January 2018–January 2024, with October peaks and a pandemic marker.
 
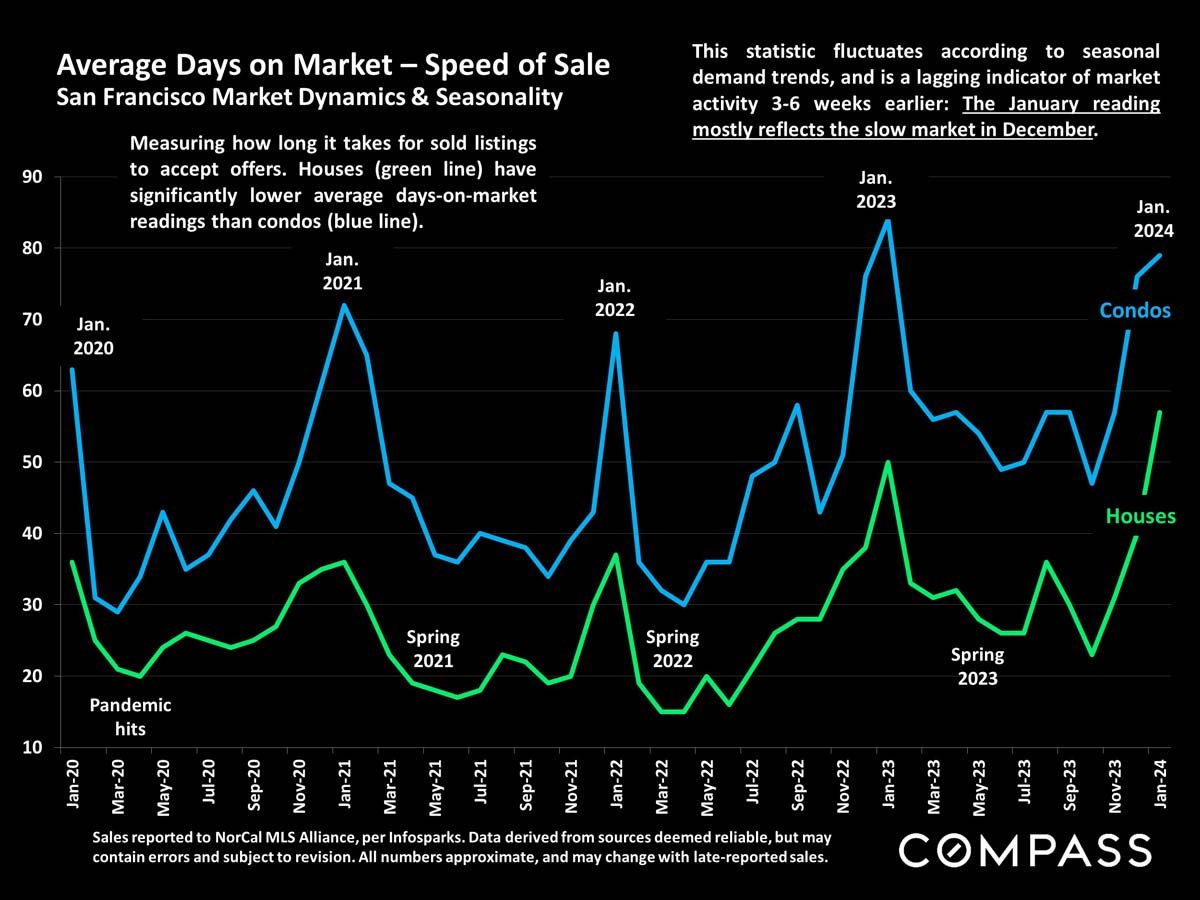
San Francisco days-on-market chart shows condos taking longer to sell than houses from 2020 to 2024.
 
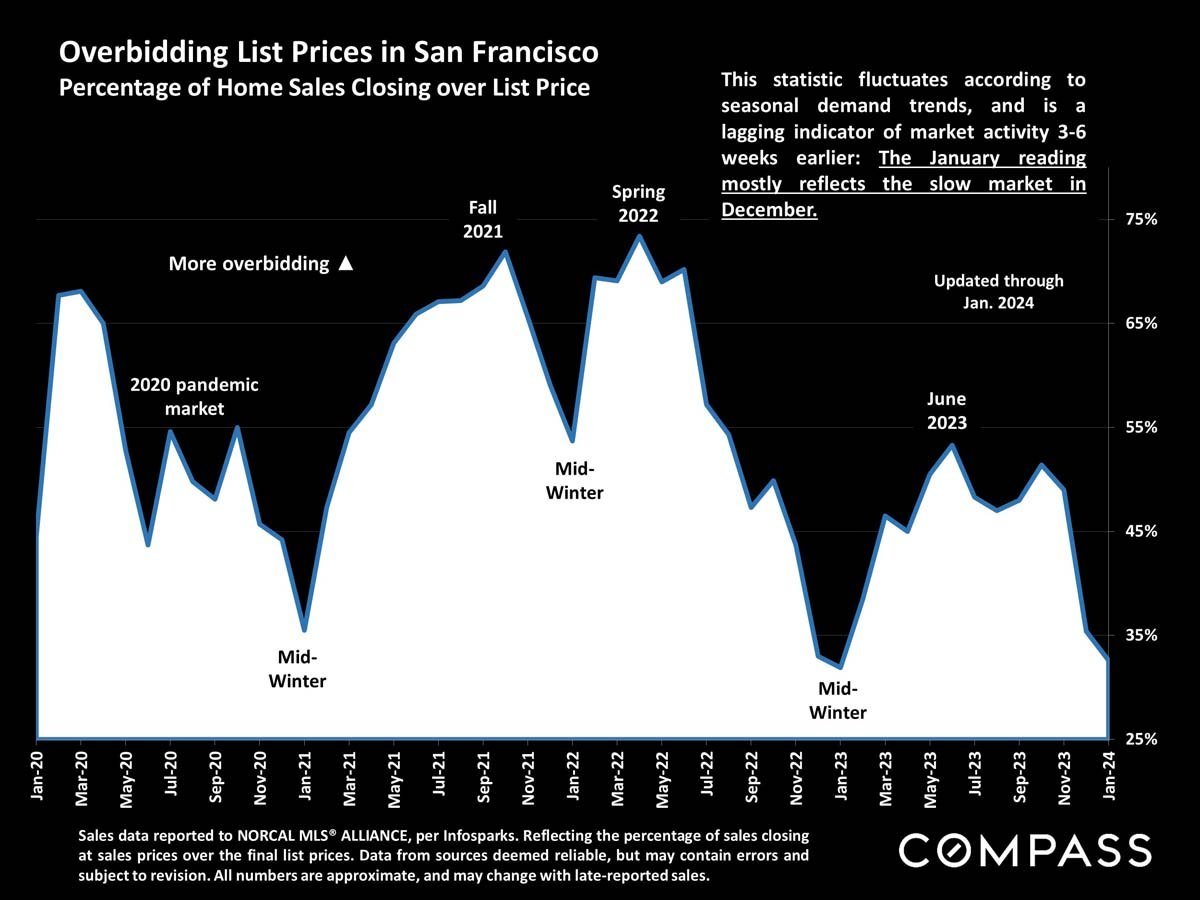
Chart of San Francisco home sales closing over list price from January 2020 through January 2024.
 
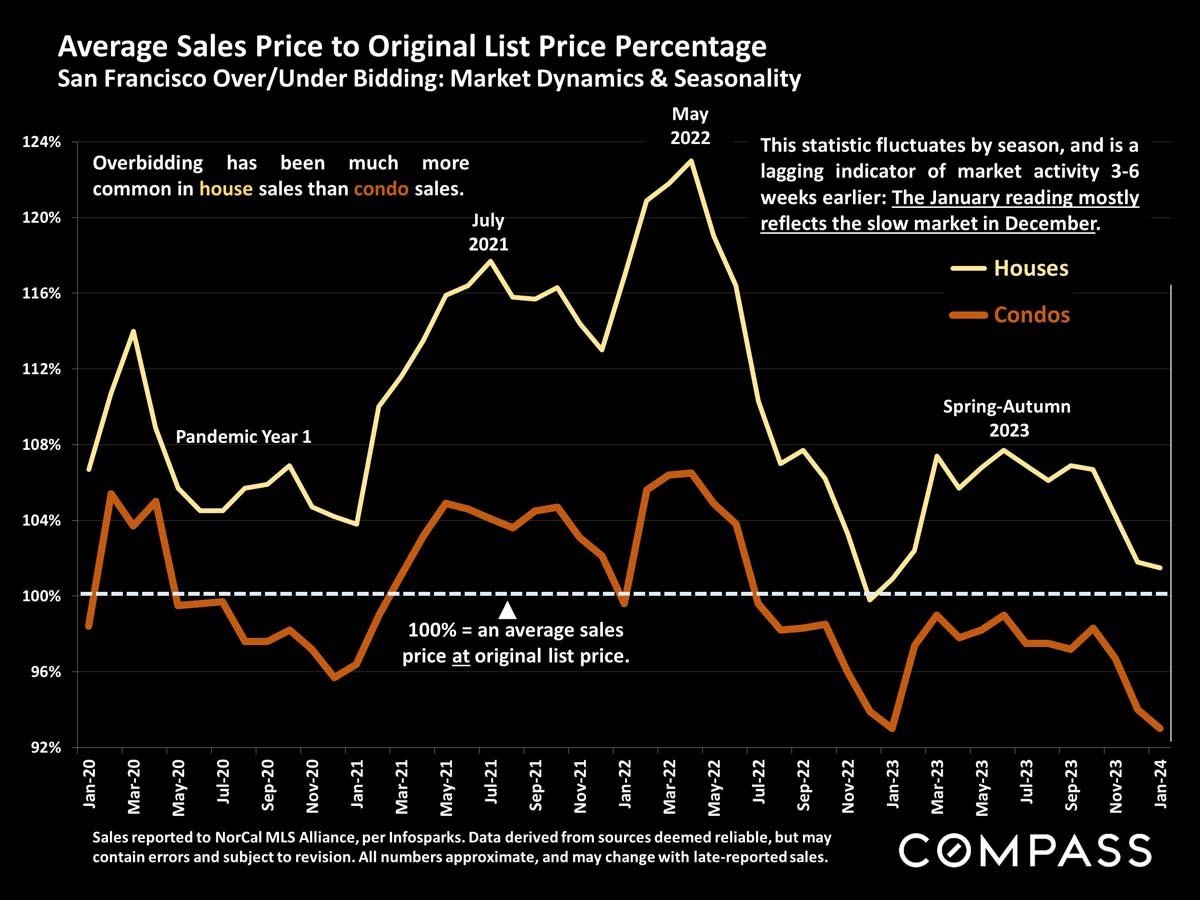
Chart comparing San Francisco house and condo sale prices to original list prices from 2020 to 2024.
 
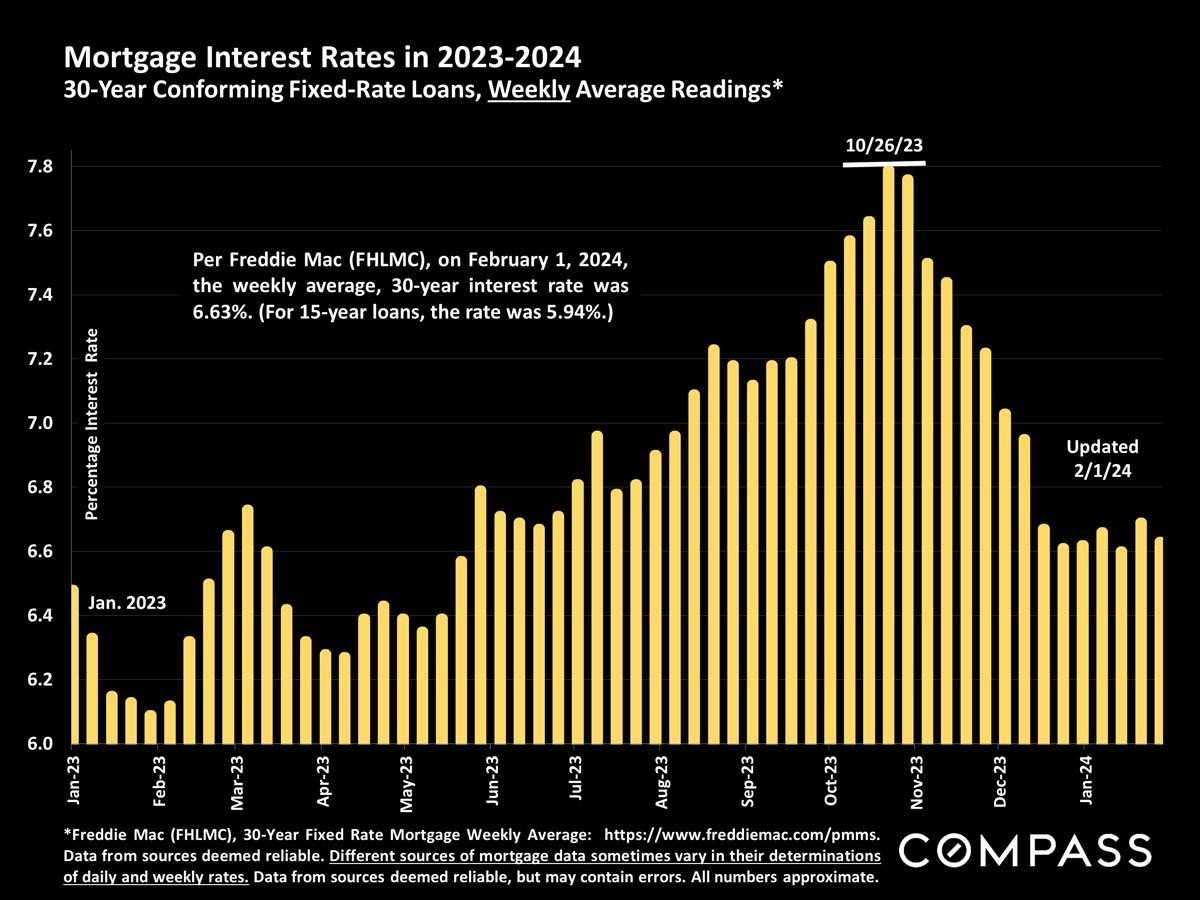
Bar chart of 2023–2024 mortgage rates, peaking near 7.8% in October 2023 before declining.
 
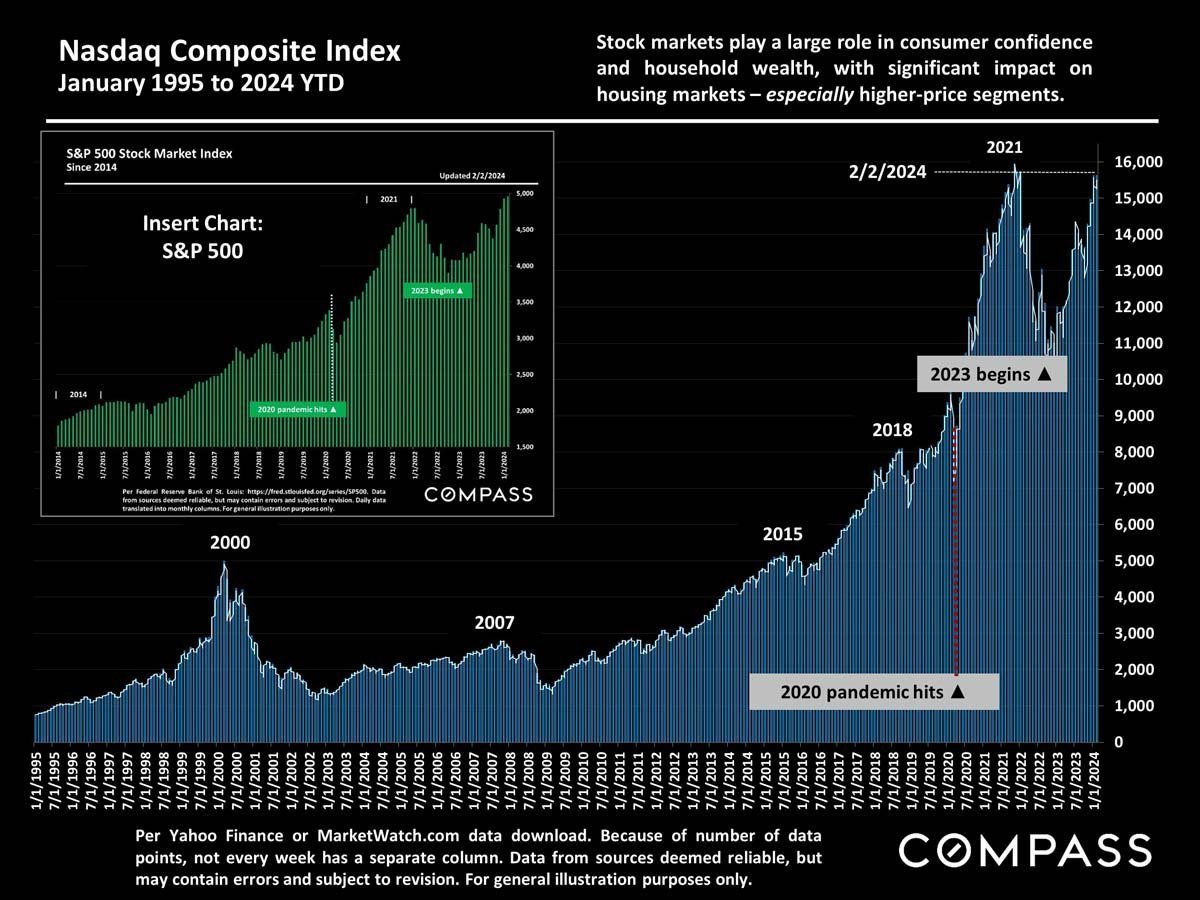
Nasdaq Composite Index chart from 1995 through February 2024, with an S&P 500 inset.
 
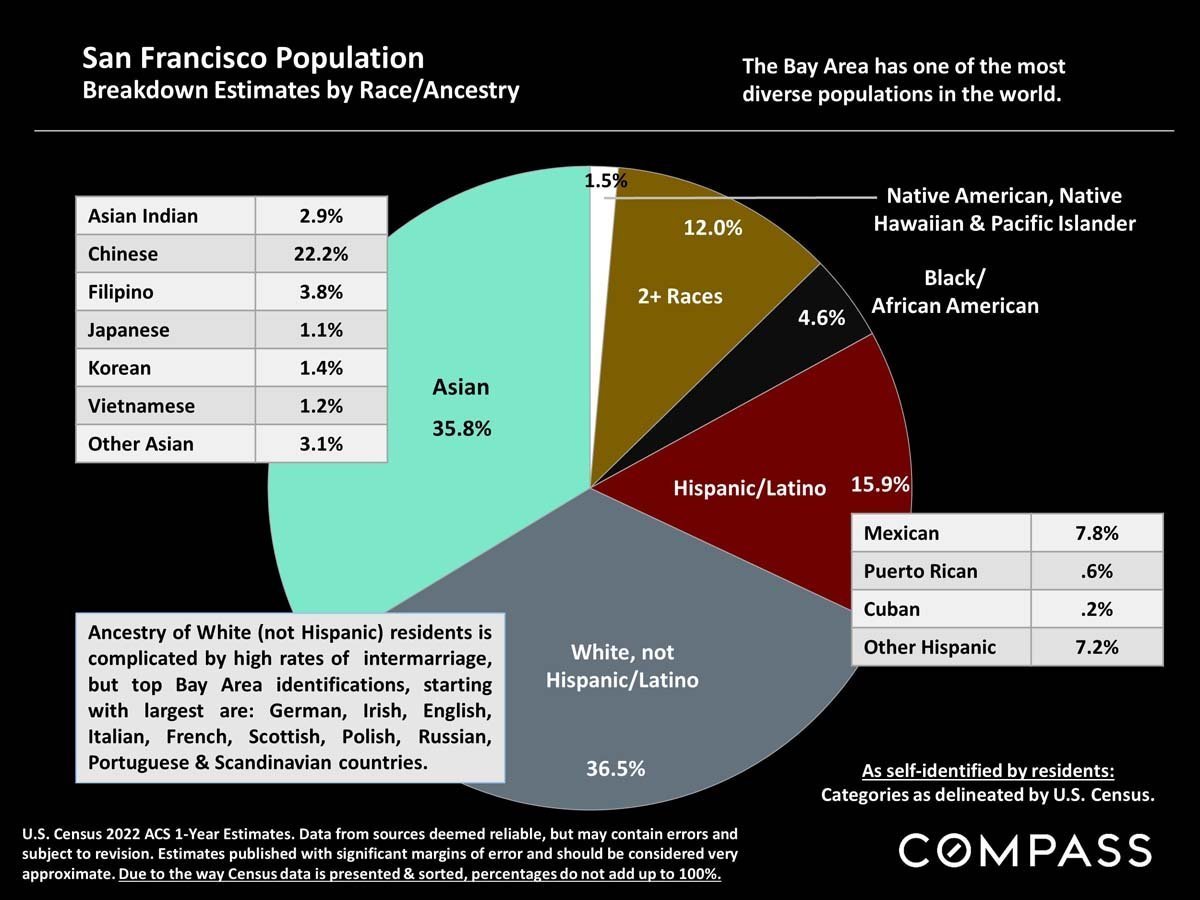
San Francisco population infographic with race and ancestry estimates shown in a pie chart and tables.
 
Real estate market report disclaimer defining statistics, median sales price, and dollar per square foot.

Work With Jane

Get assistance in determining the current property value, crafting a competitive offer, writing and negotiating a contract, and much more. Contact me today.
Follow Me on Instagram