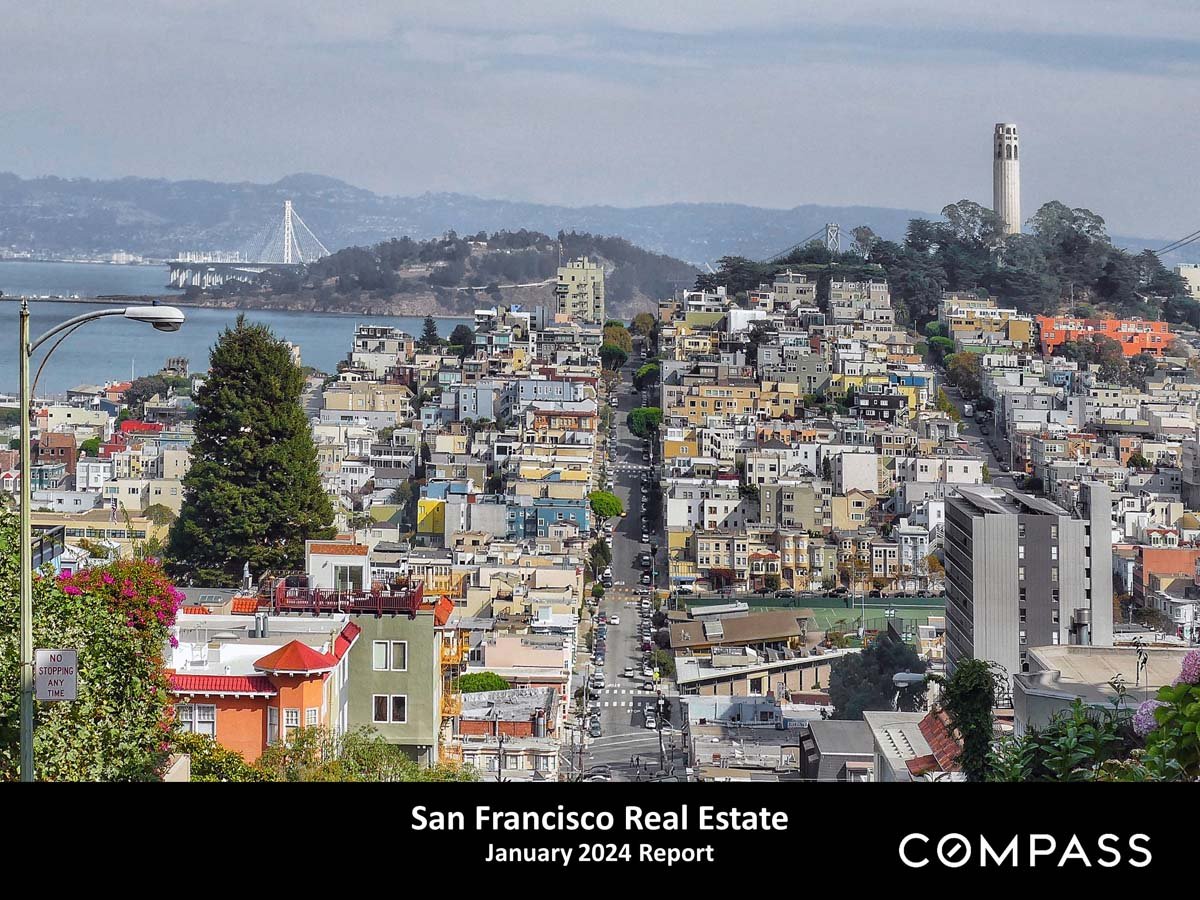
San Francisco Real Estate January 2024 report cover with a cityscape and COMPASS branding.

San Francisco Home Prices, Market Conditions & Trends January 2024

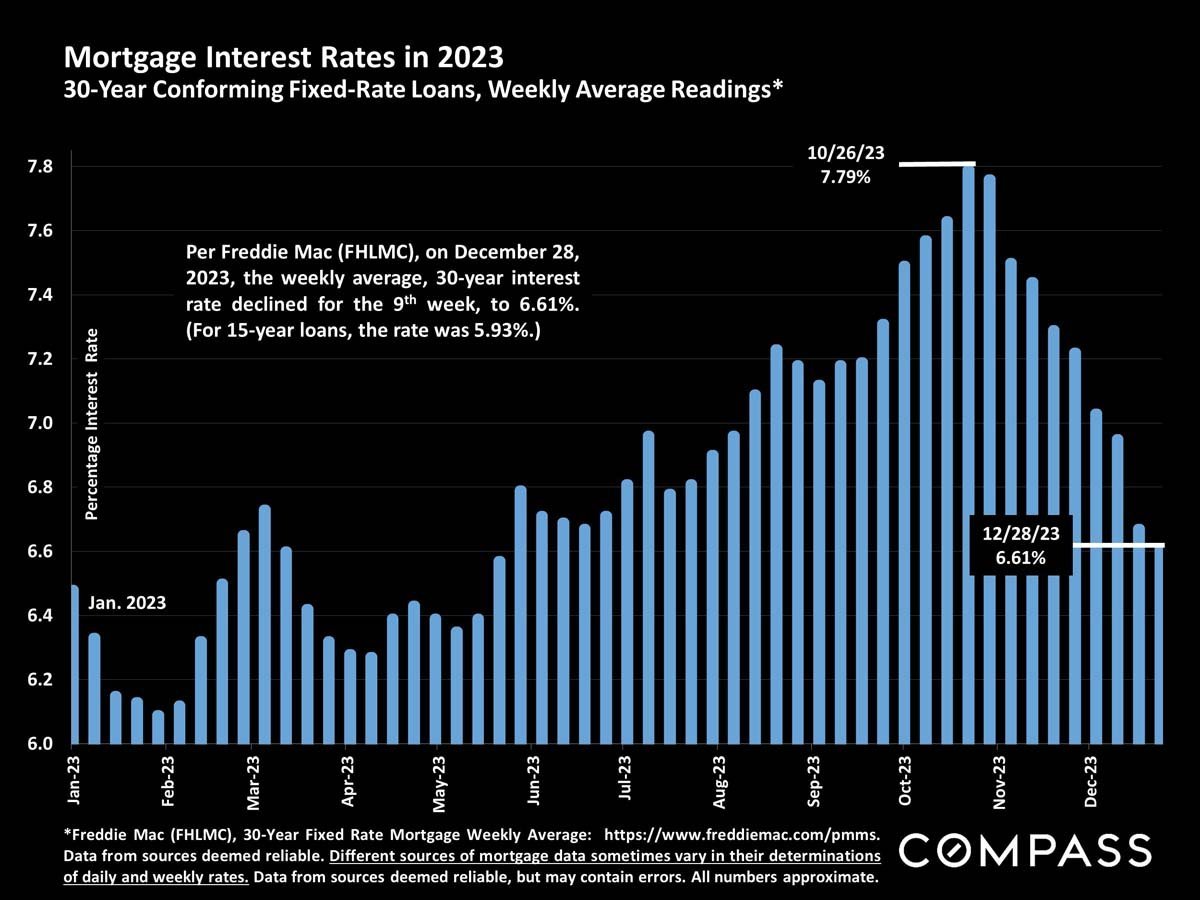
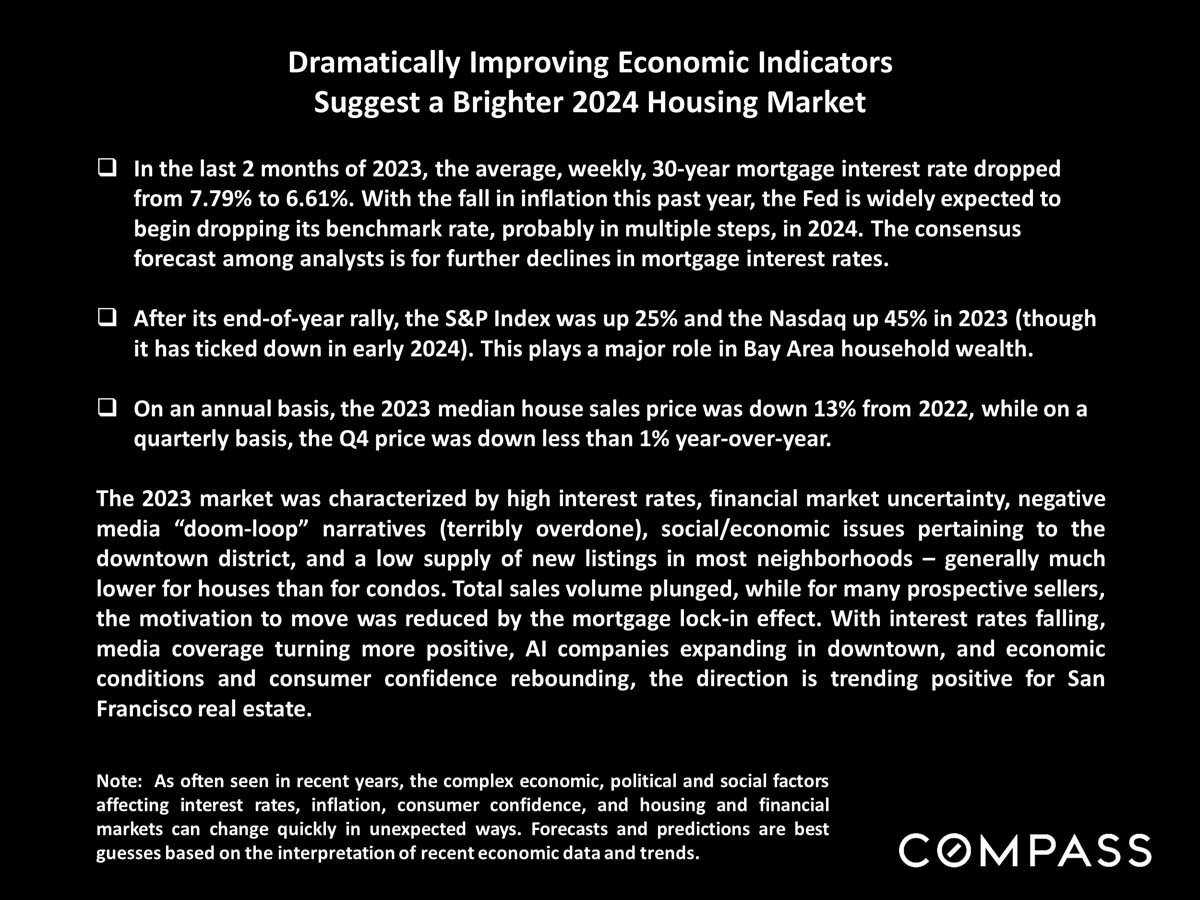
Dramatically Improving Economic Indicators Suggest a Brighter 2024 Housing Market. In the last 2 months of 2023, the average weekly 30-year mortgage interest rate dropped from 7.79% to 6.61%.
 
San Francisco Real Estate January 2024 report cover with a cityscape and COMPASS branding.
 
San Francisco housing market outlook for 2024, covering mortgage rates, stock gains, home prices, and economic trends.
 
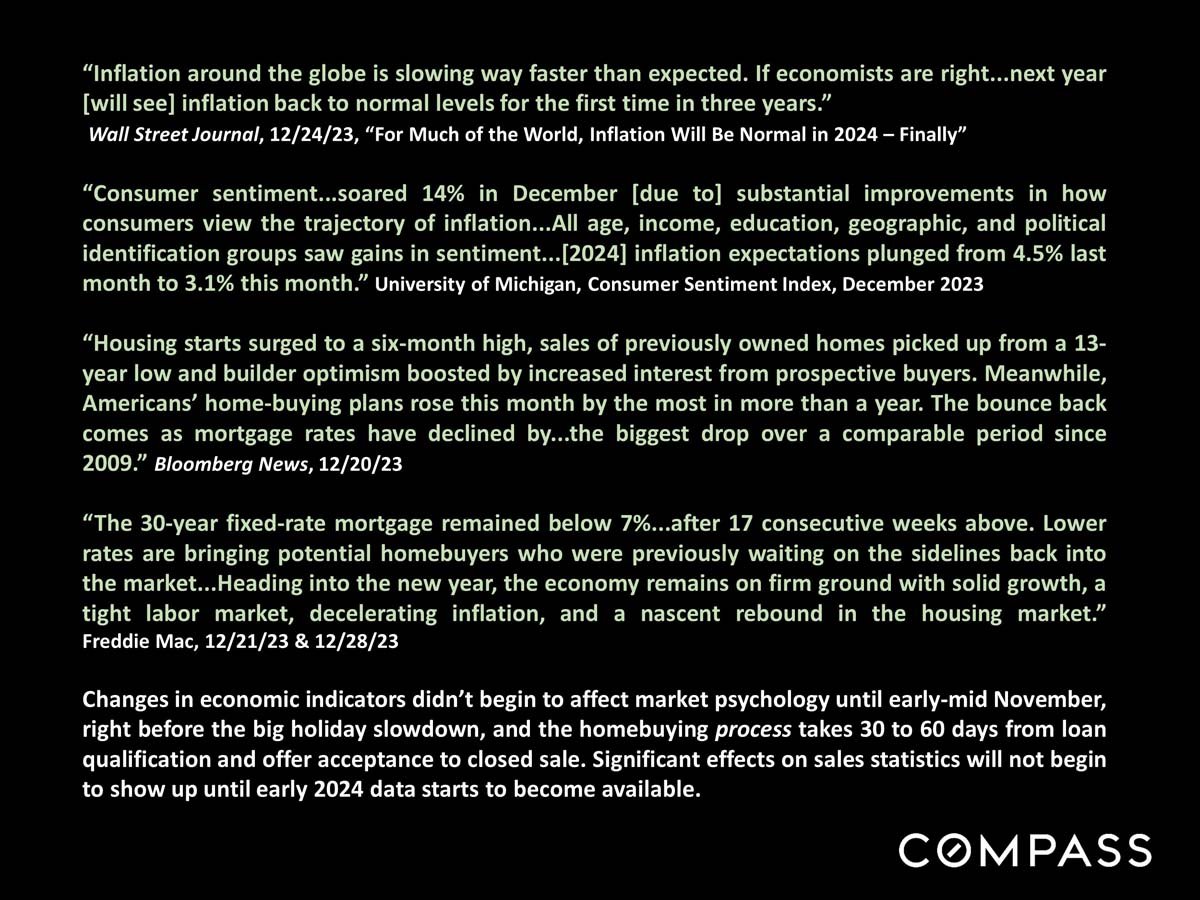
San Francisco housing market update with economic, home sales, and mortgage-rate quotations and analysis.
 
2023 mortgage rate chart, peaking at 7.79% in October before declining to 6.61% in December.
 
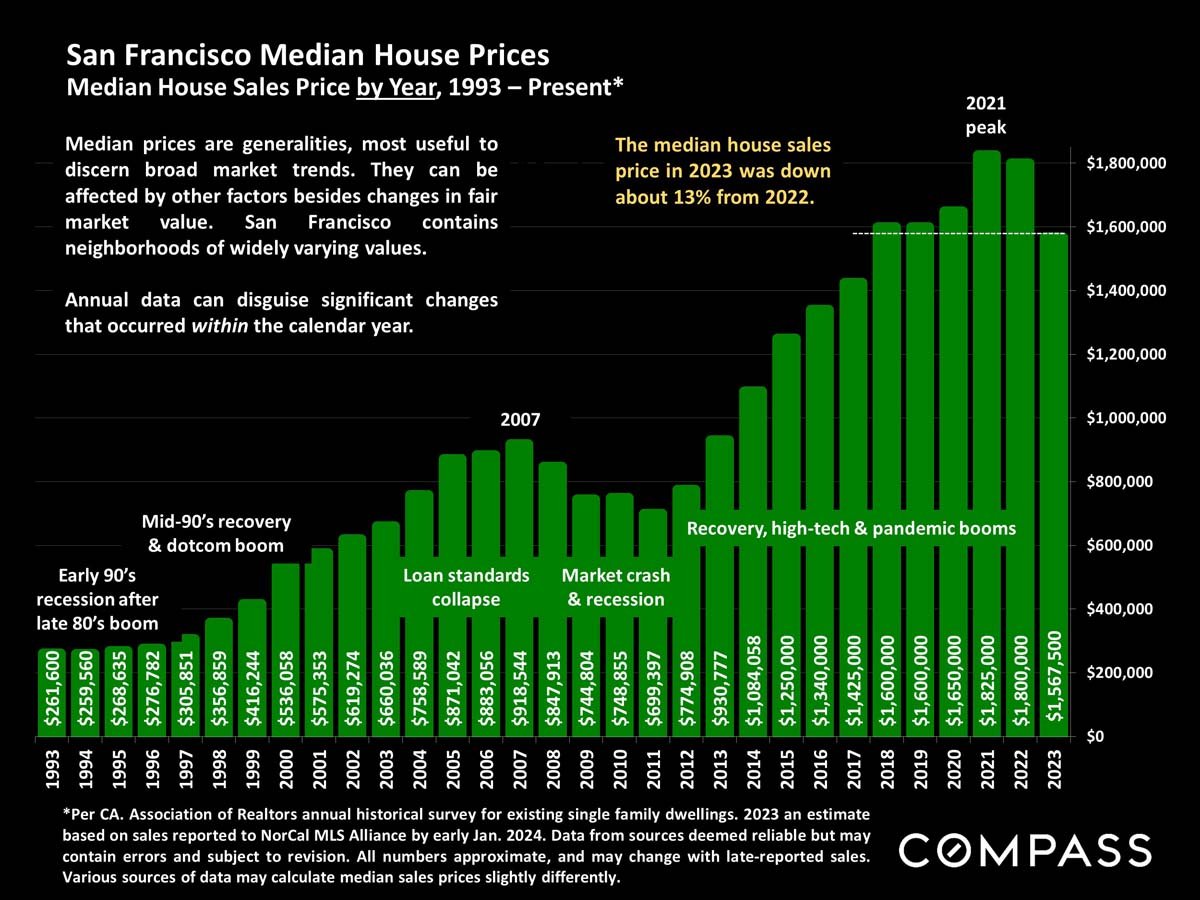
Chart of San Francisco median home prices, showing a 2021 peak of $1.825 million and a 2023 estimate of $1.568 million.
 
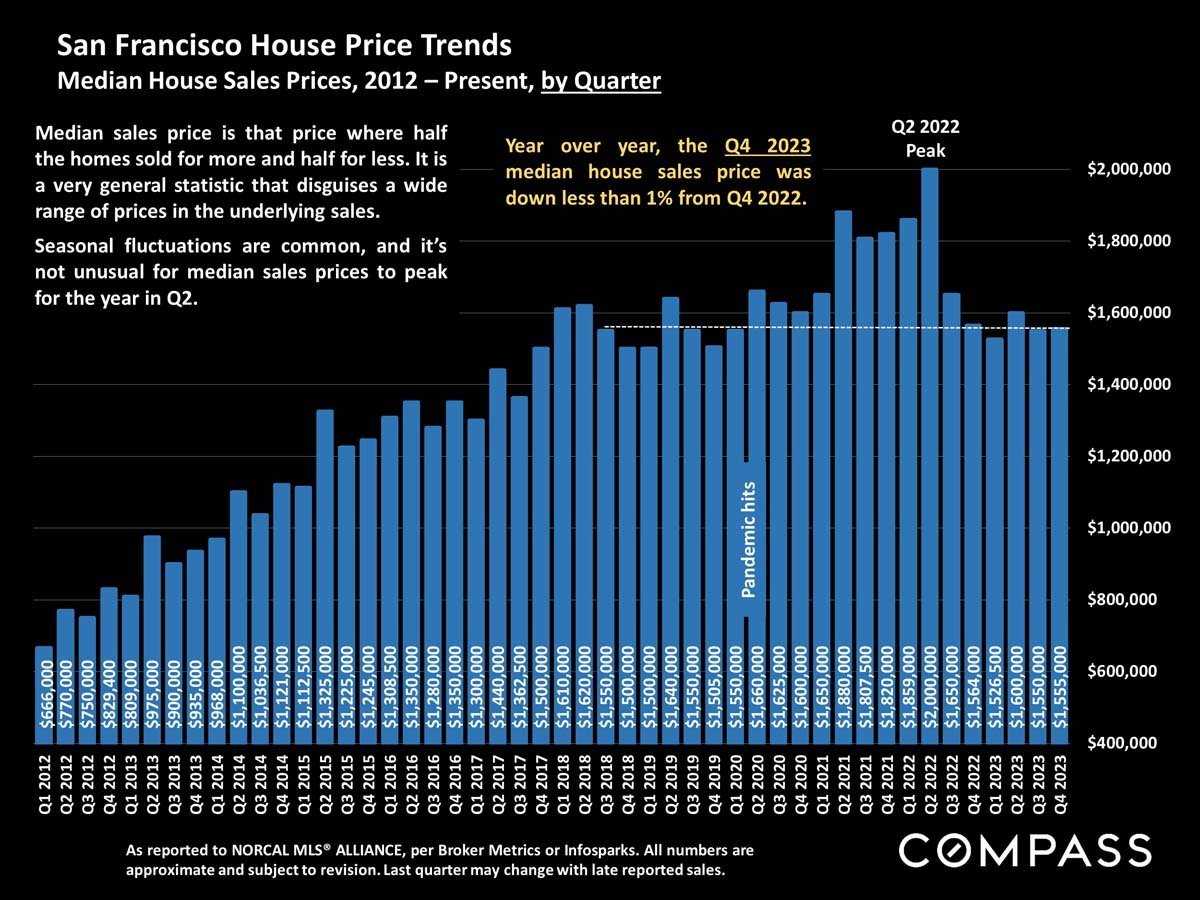
San Francisco quarterly median home sale prices, 2012–2023, peaking at $2 million in Q2 2022.
 
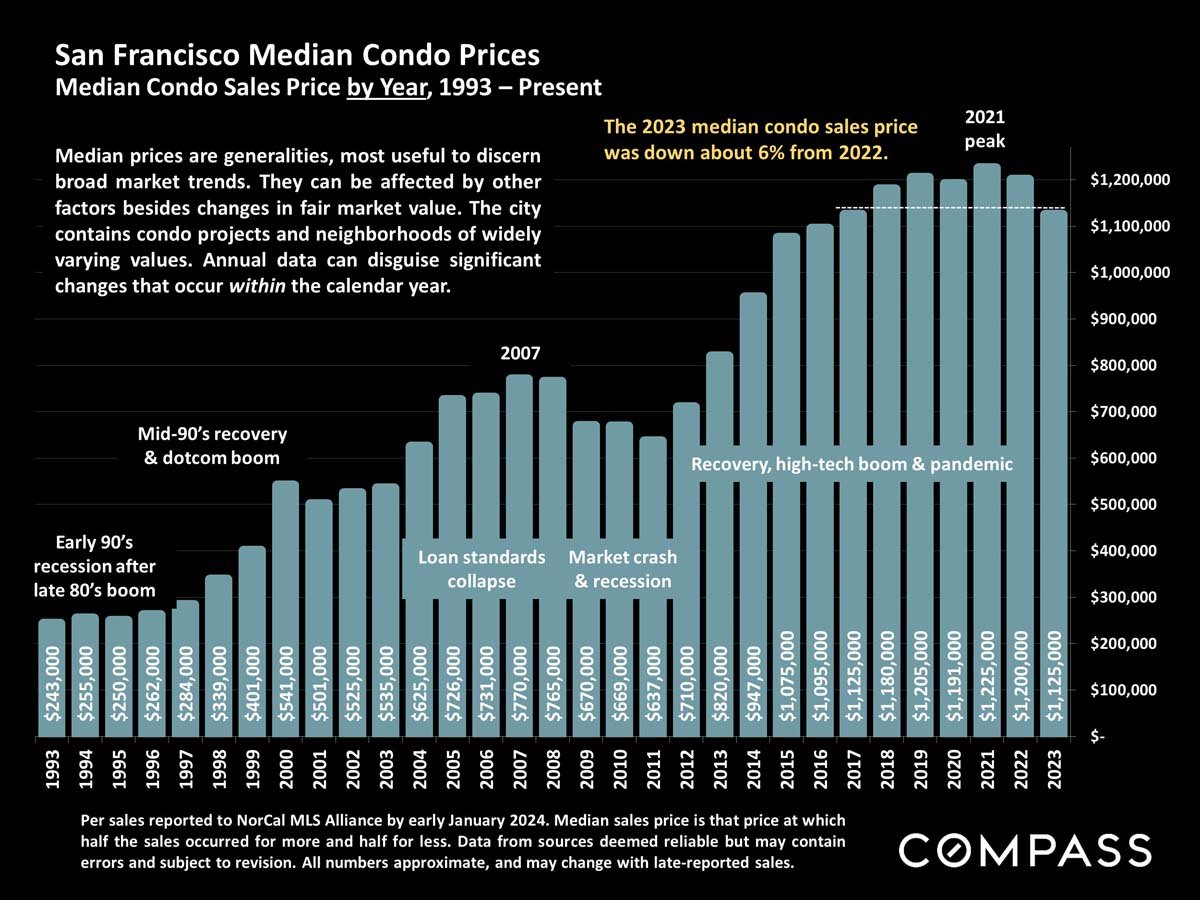
Chart of San Francisco median condo prices, 1993–2023, peaking in 2021 before declining.
 
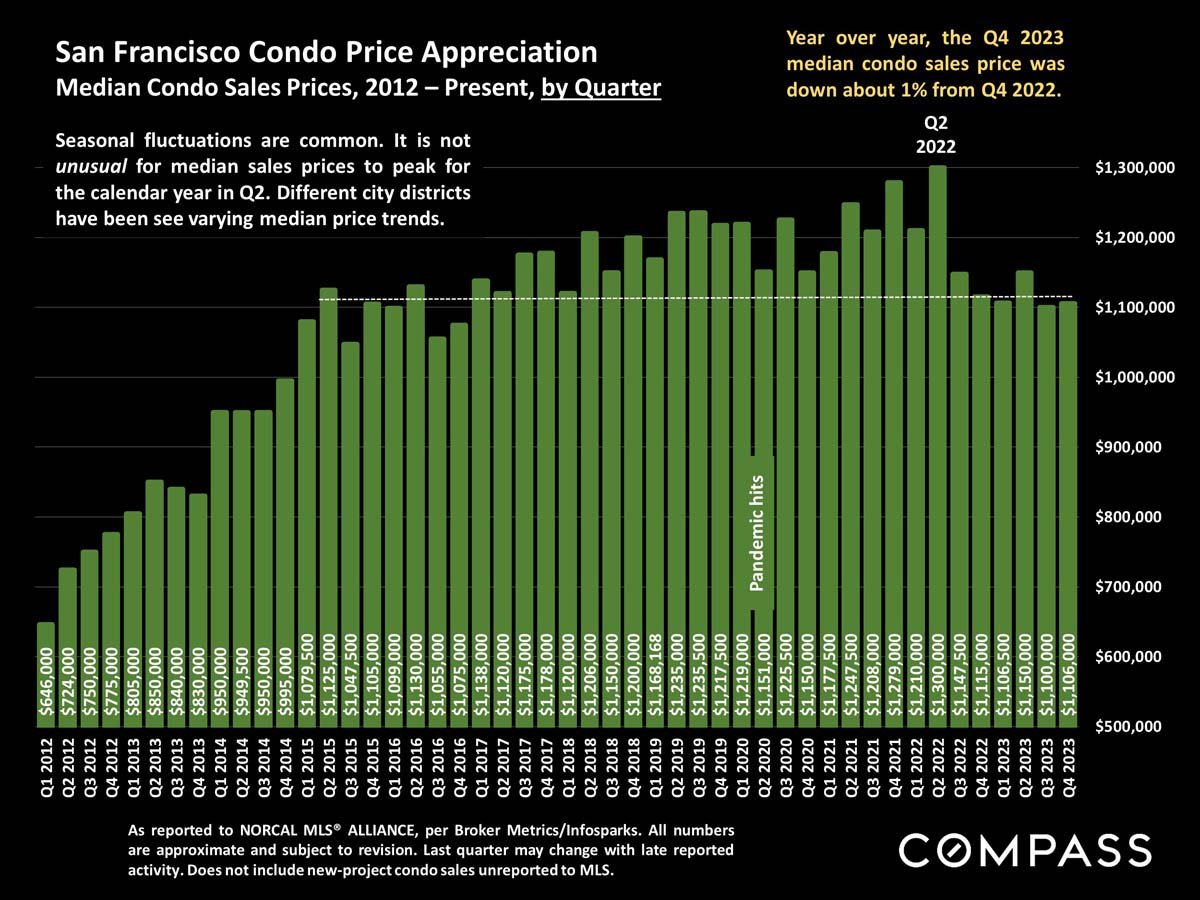
San Francisco condo median sales prices by quarter from 2012 to 2023, peaking in Q2 2022.
 
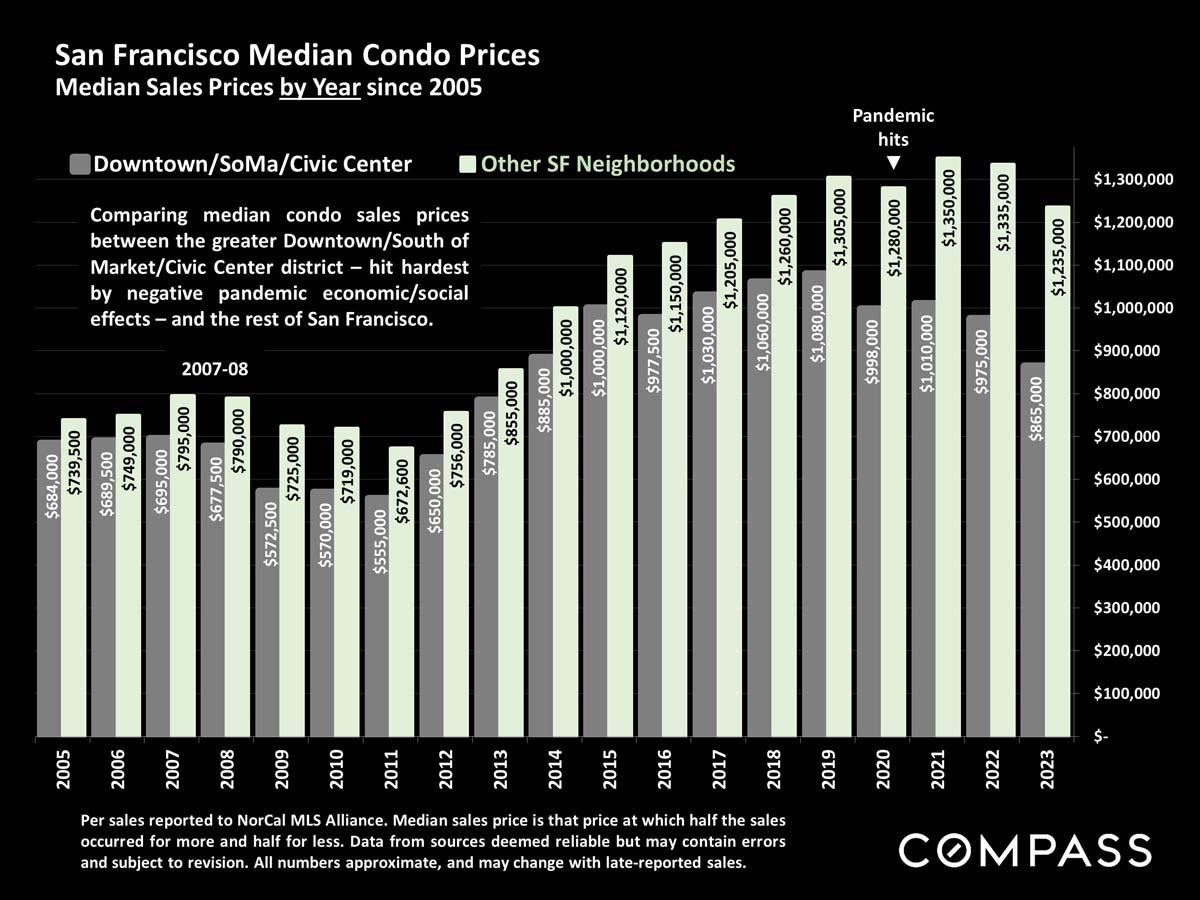
Bar chart compares San Francisco condo prices by neighborhood from 2005 to 2023, peaking around $1.35 million in 2021.
 
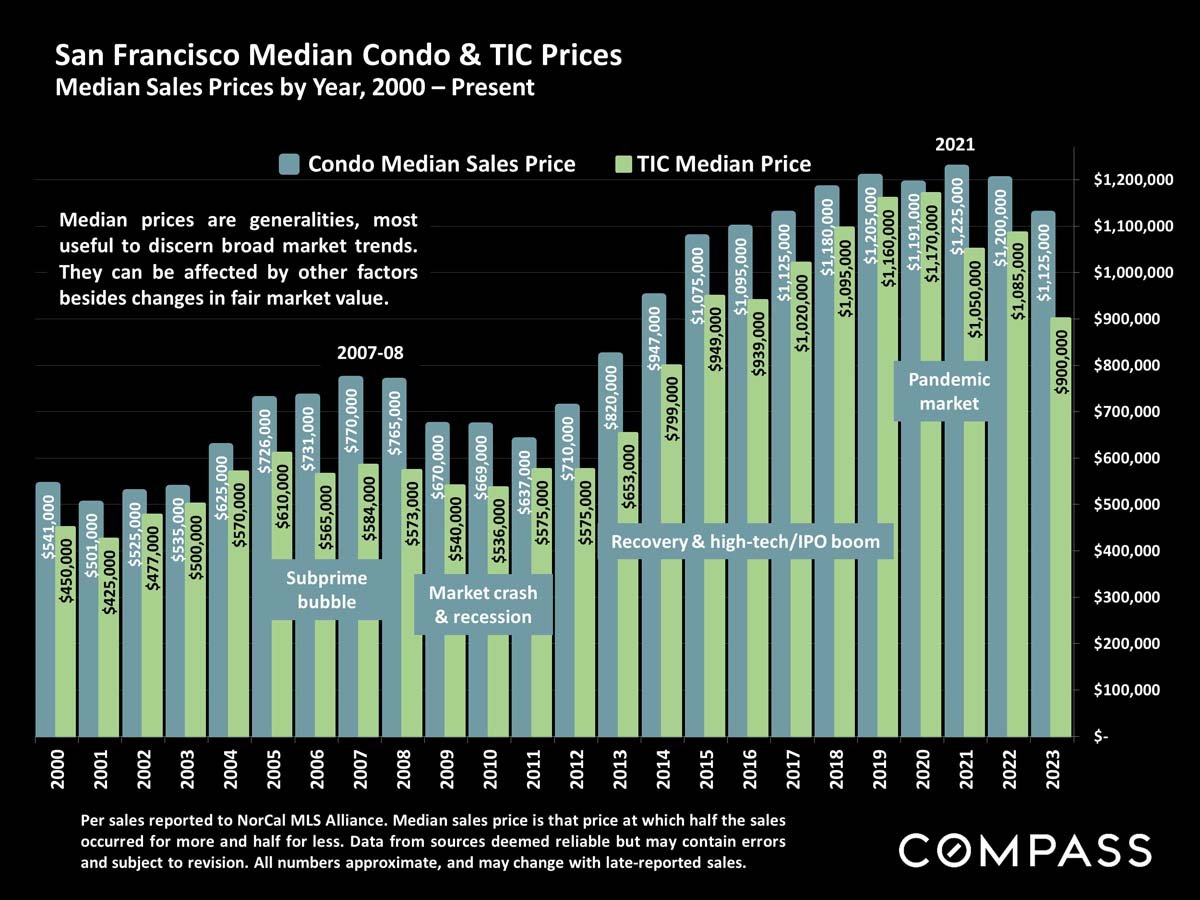
Chart comparing San Francisco condo and TIC median sale prices from 2000 to 2023, with market-period annotations.
 
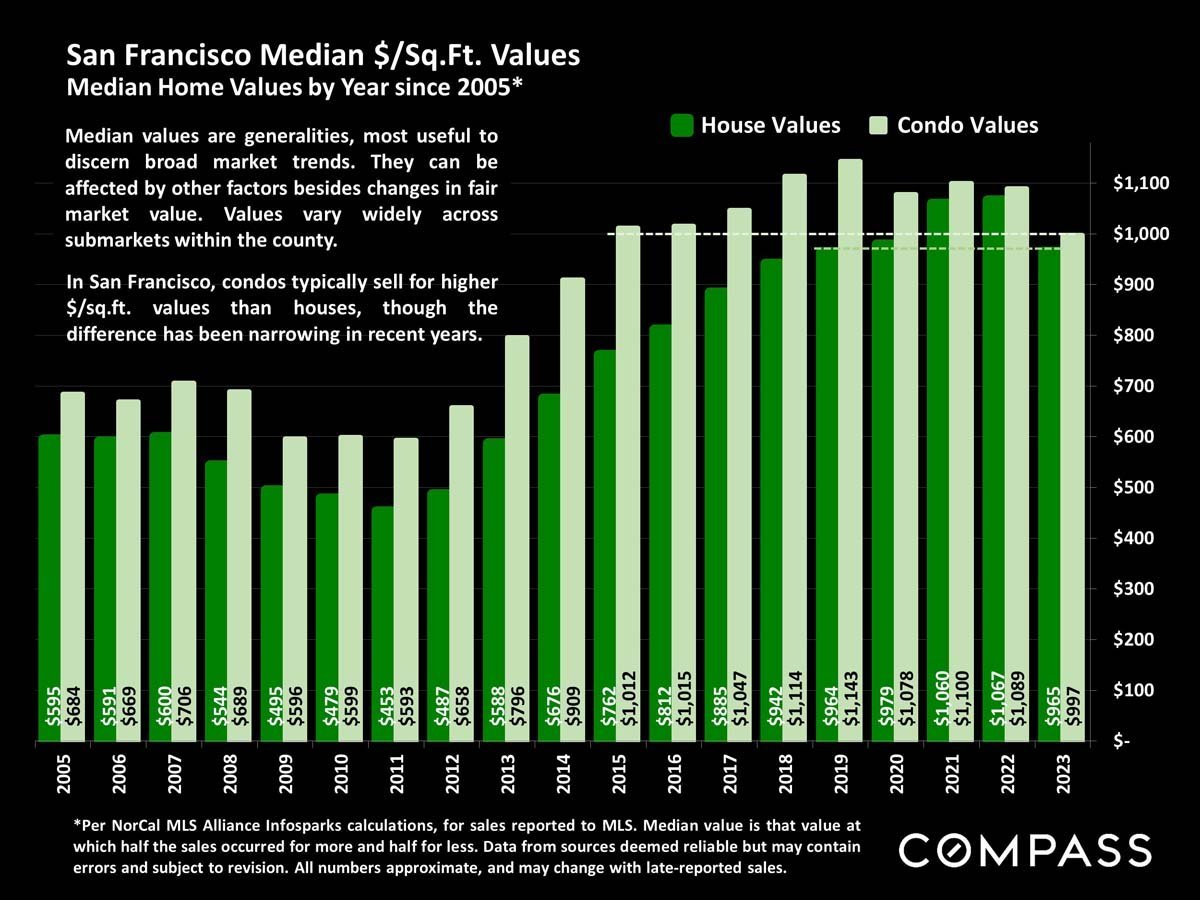
Chart comparing San Francisco median house and condo values per square foot from 2005 to 2023.
 
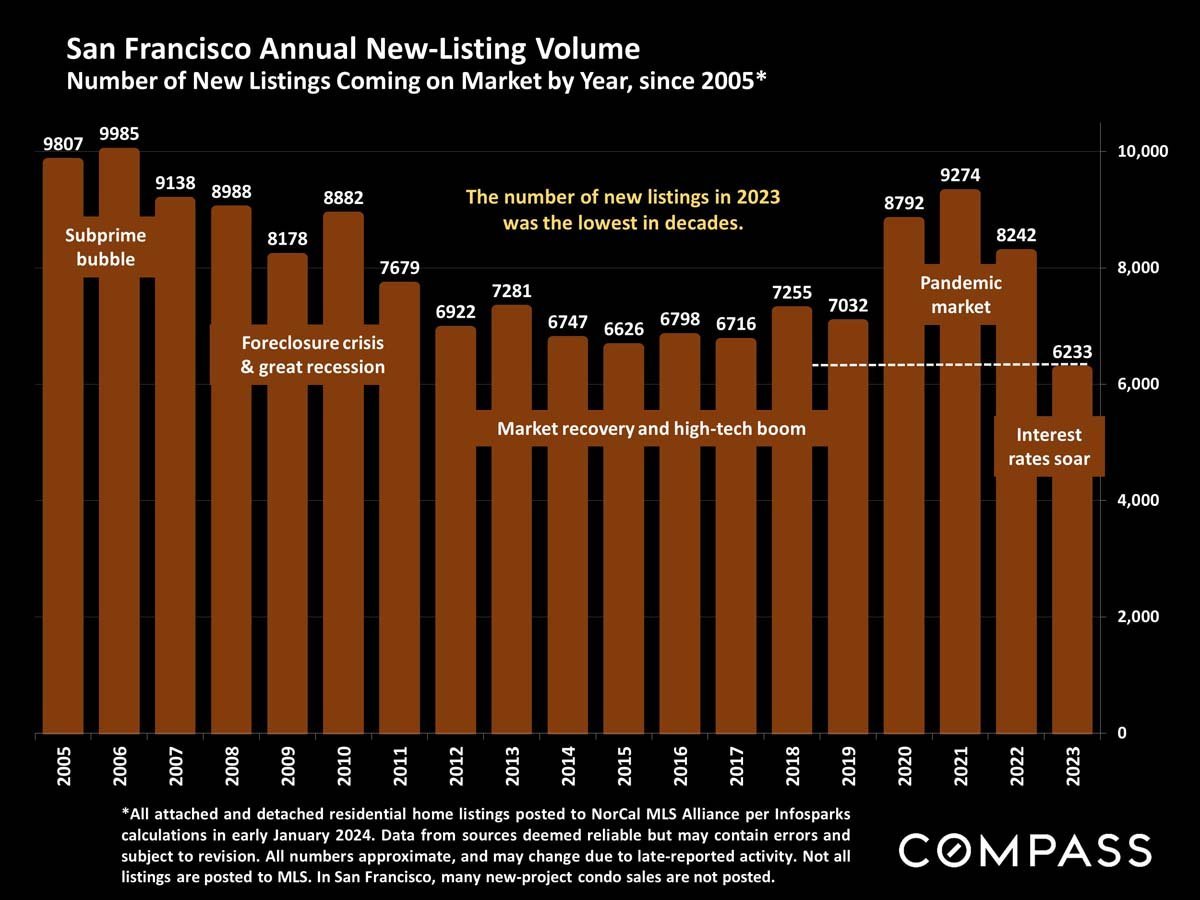
Chart of San Francisco annual new listings, showing 6,233 in 2023, the lowest volume in decades.
 
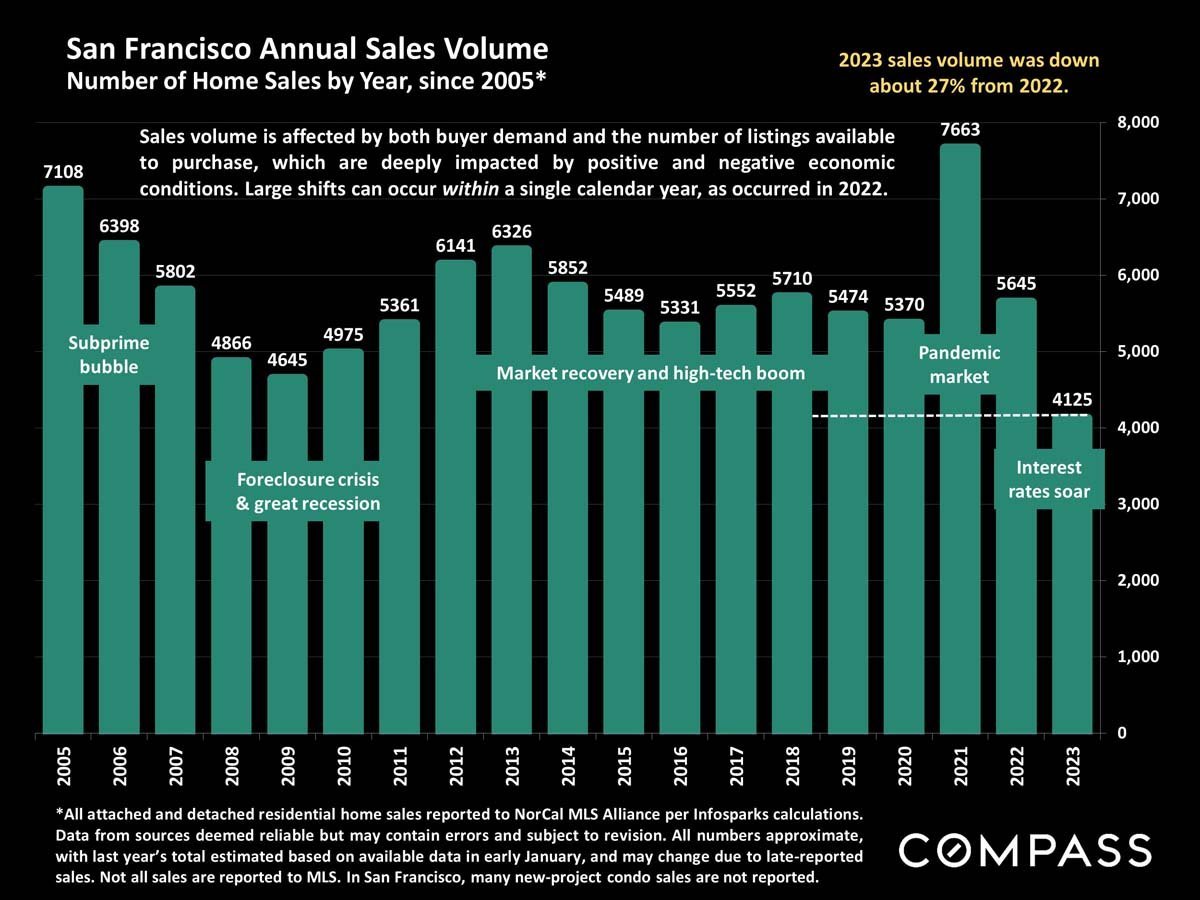
Bar chart of San Francisco home sales, 2005–2023, highlighting pandemic-era peak and 2023 decline.
 
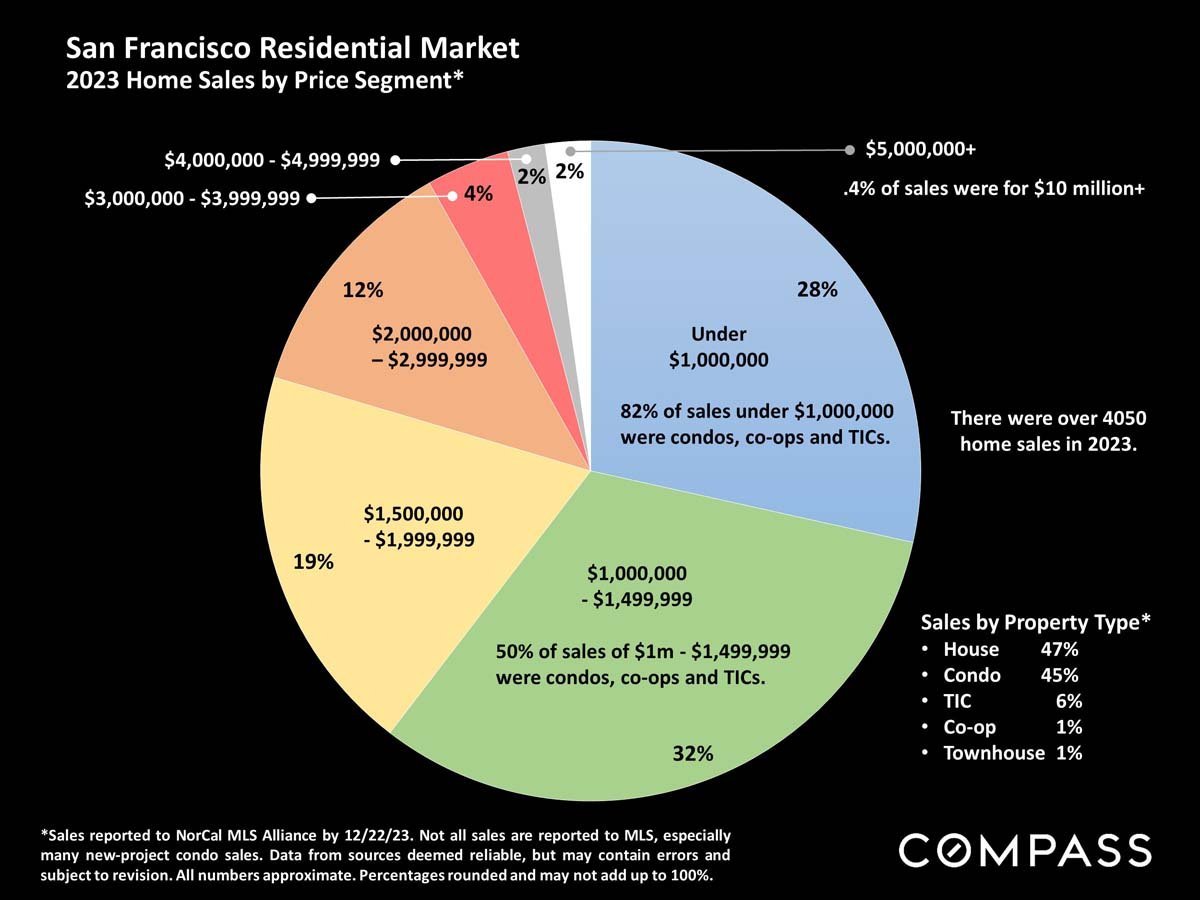
San Francisco 2023 home sales by price segment, with a pie chart and property-type breakdown.
 
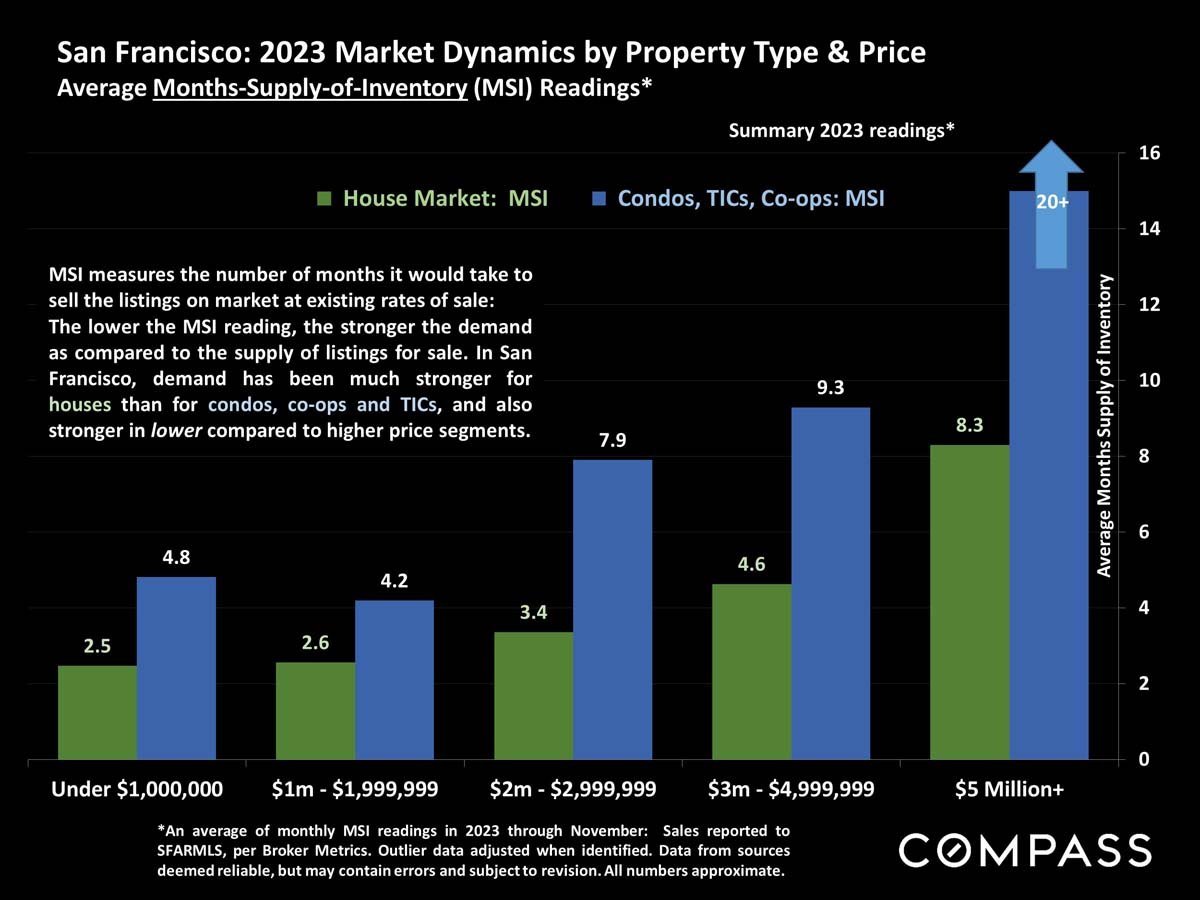
Bar chart compares 2023 San Francisco housing inventory by price range and property type; condos show higher supply in every range.
 
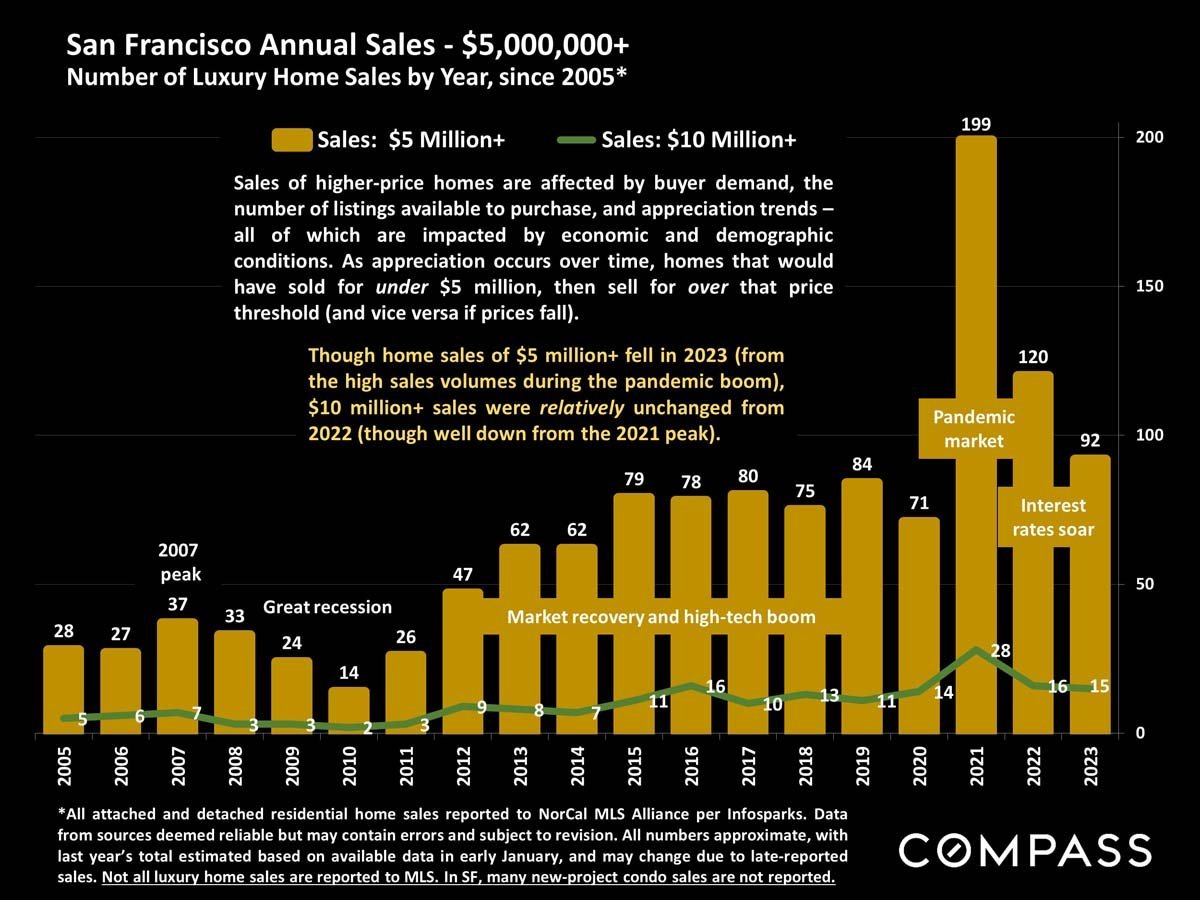
Chart of San Francisco luxury home sales from 2005 to 2023, with $5 million and $10 million thresholds.
 
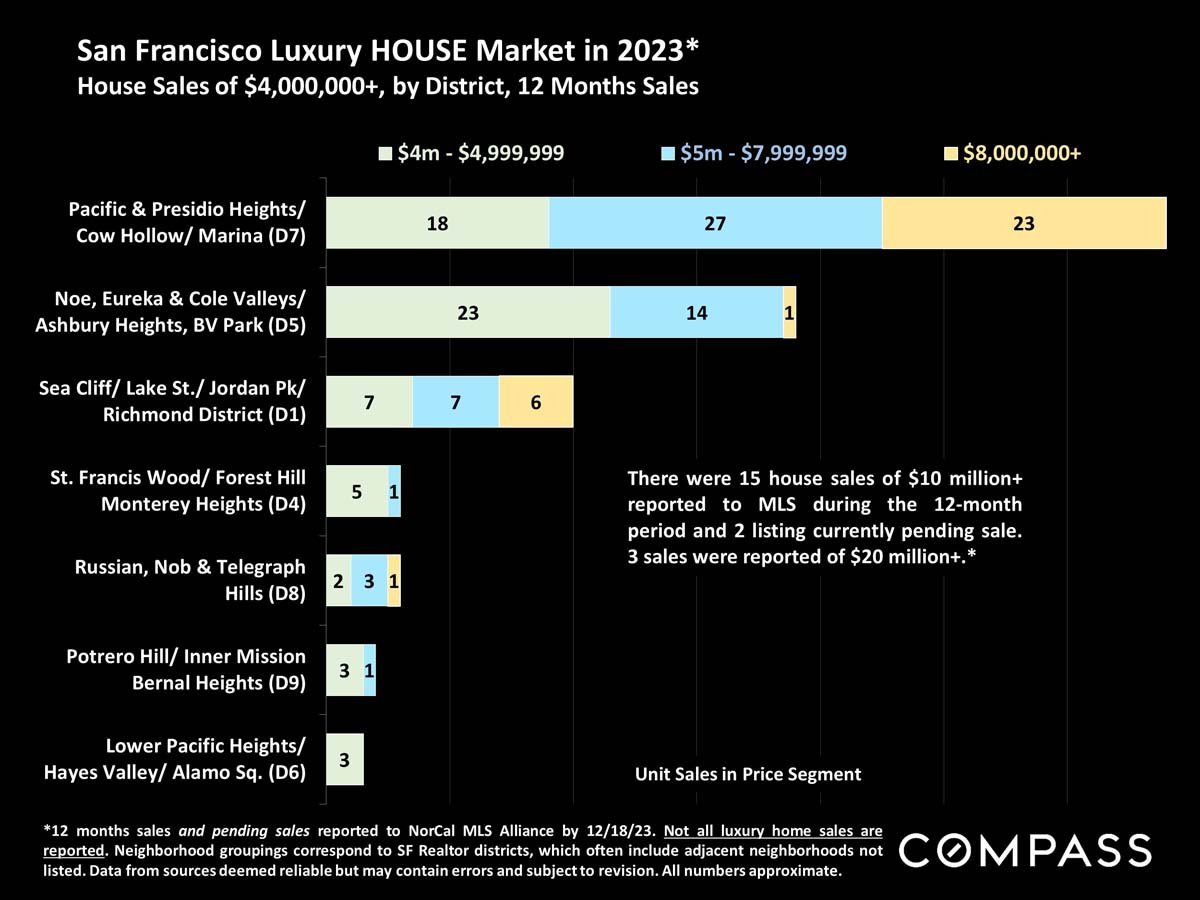
Chart of San Francisco luxury house sales by district and price segment in 2023.
 
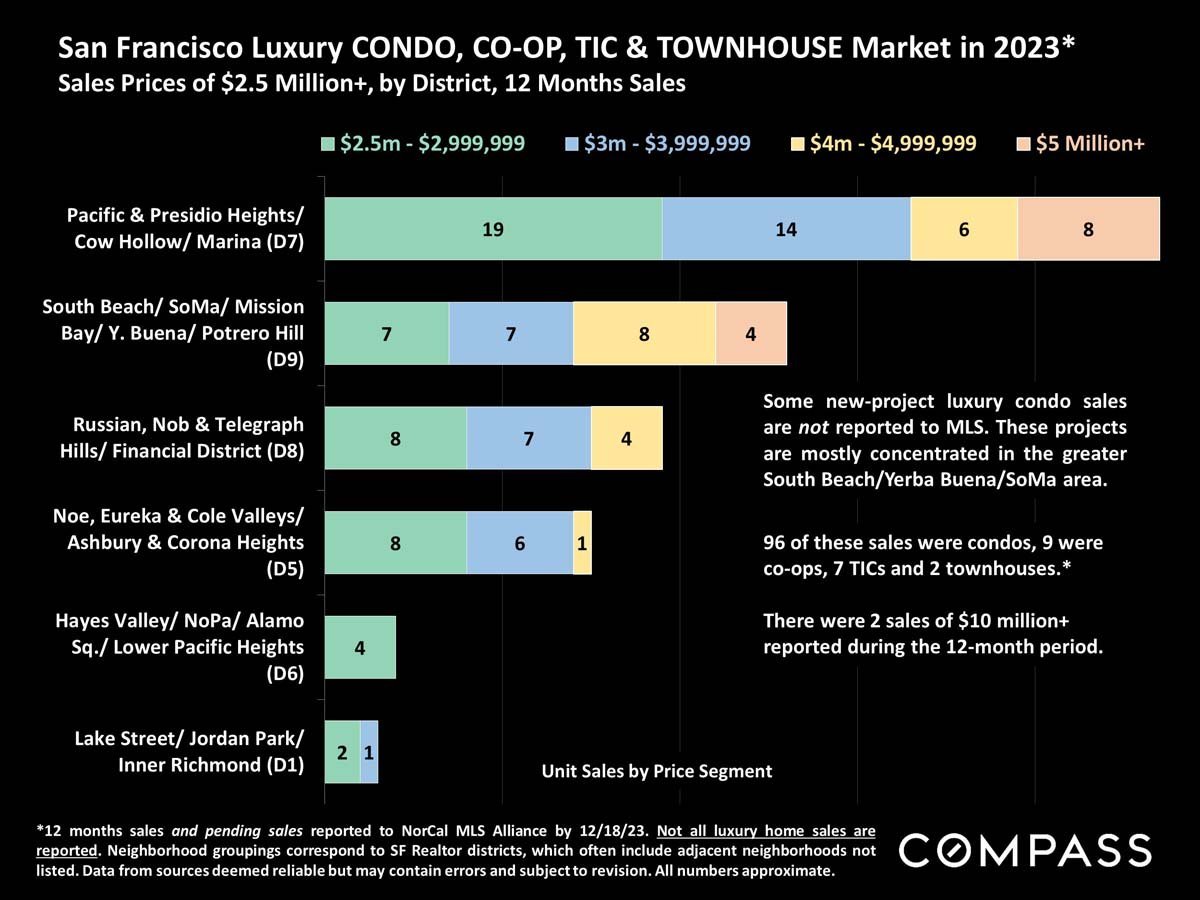
Chart of 2023 San Francisco luxury home sales by district and price segment.
 
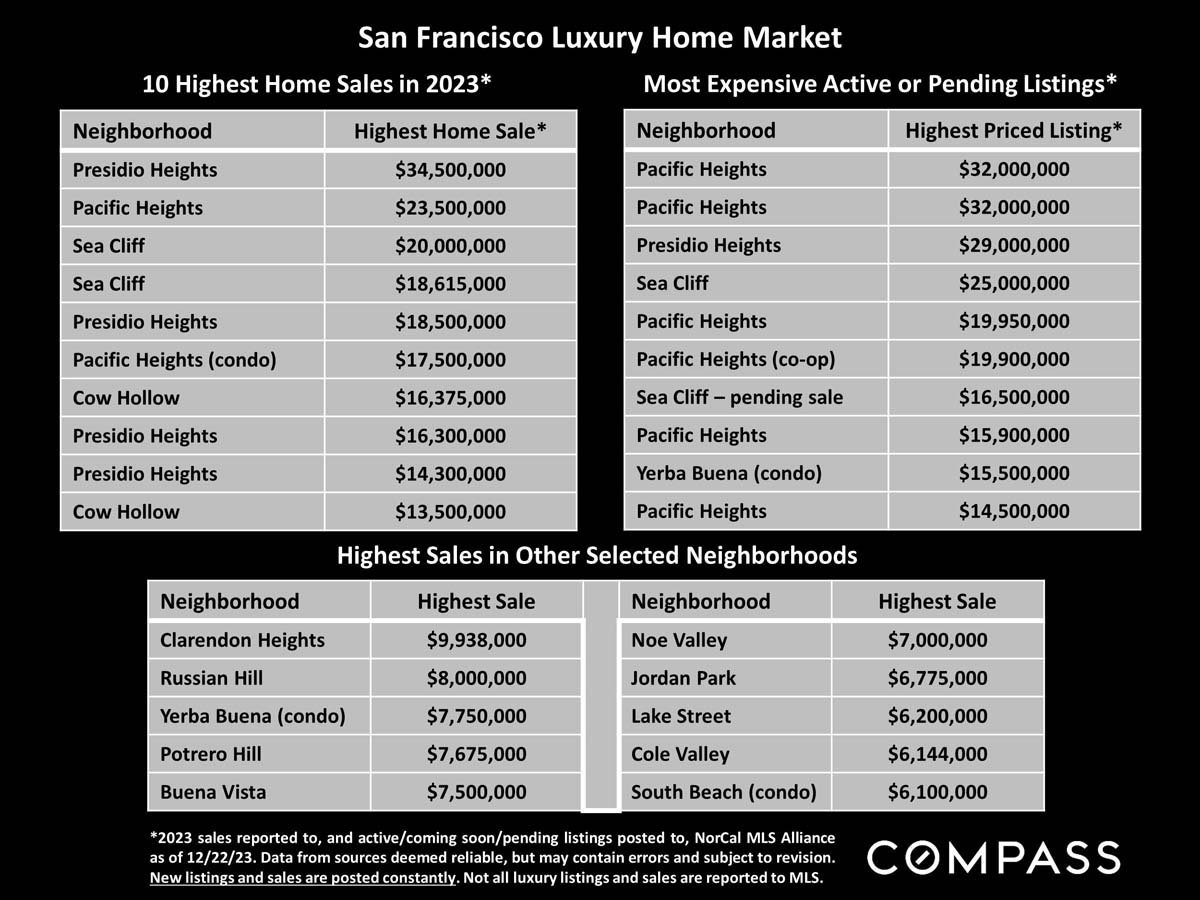
San Francisco luxury home market infographic comparing neighborhood sale prices and active or pending listings.
 
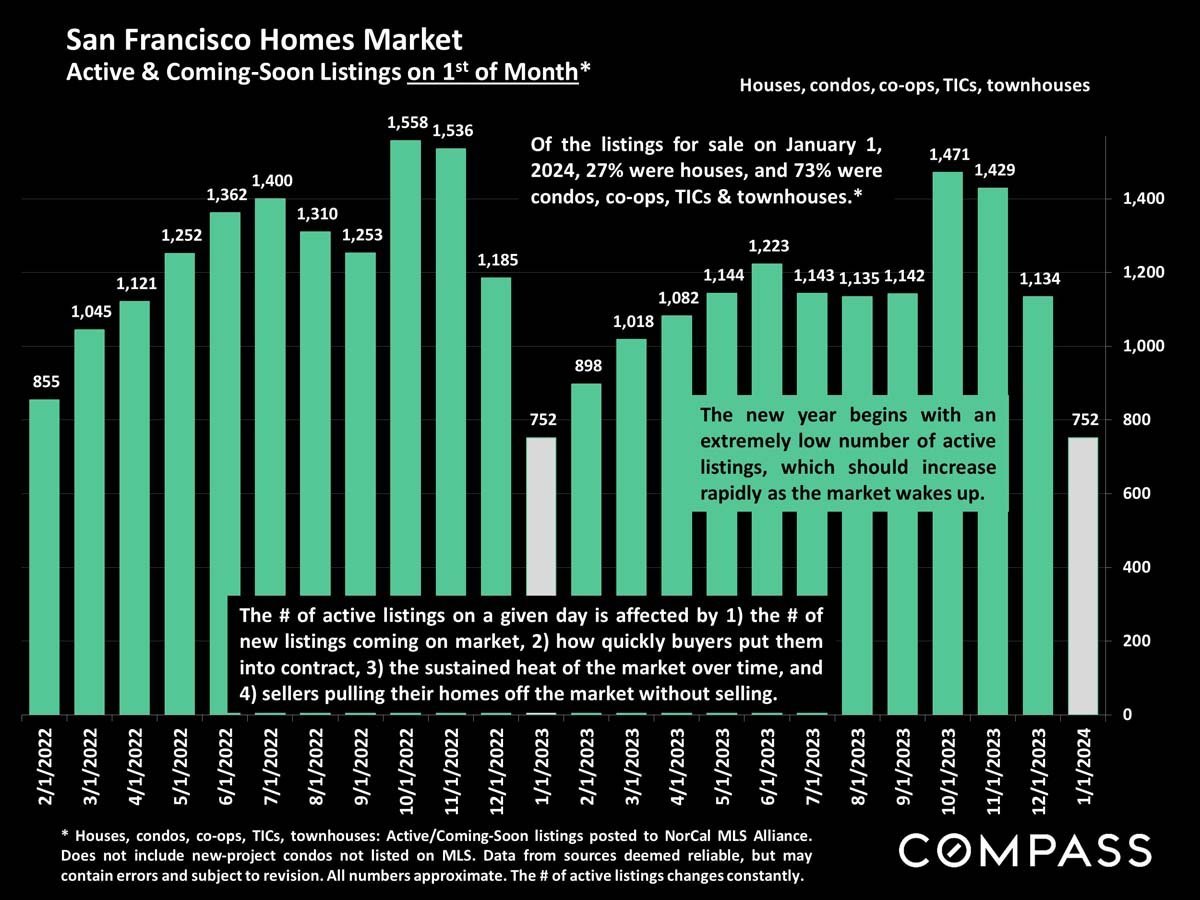
Bar chart of San Francisco active and coming-soon home listings, February 2022–January 2024.
 
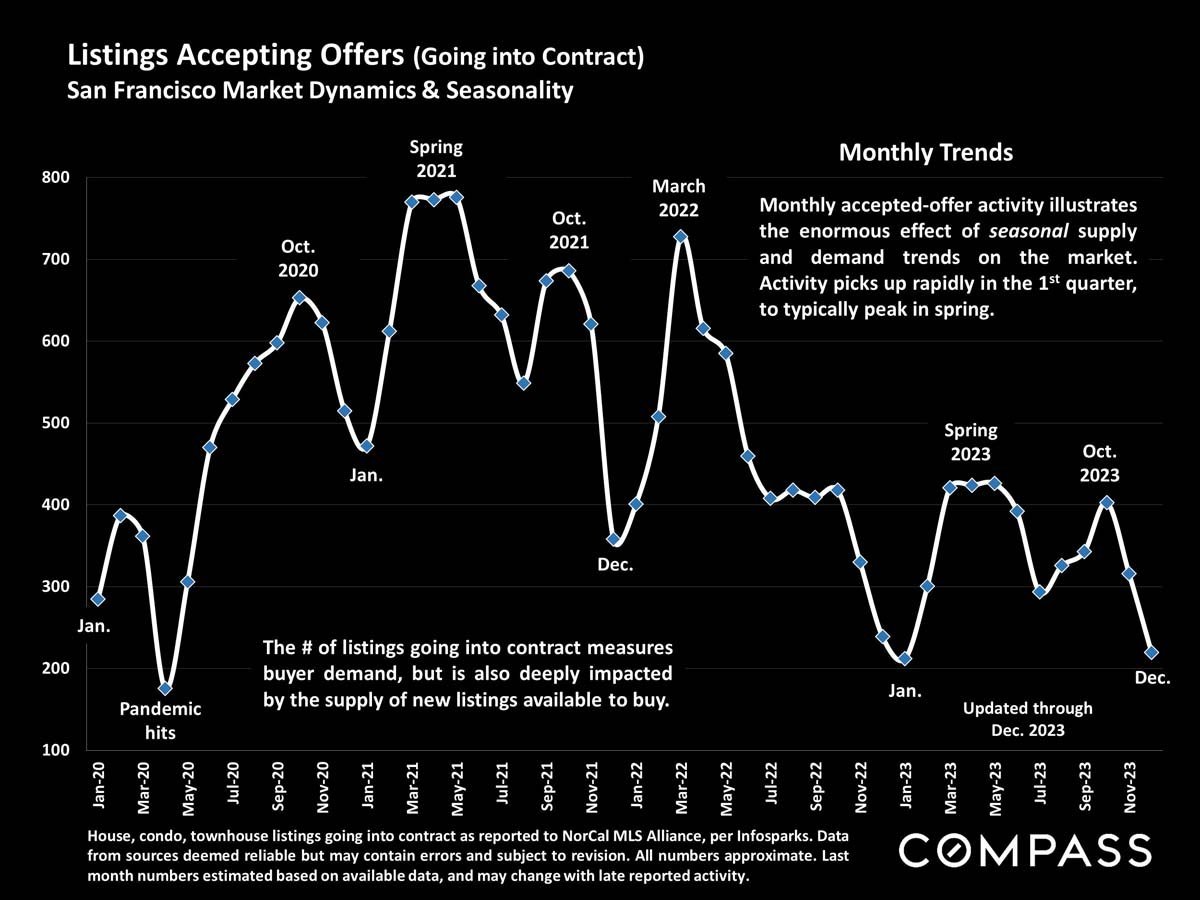
San Francisco accepted-offer listings chart, showing seasonal peaks and a decline from 2021 highs through December 2023.
 
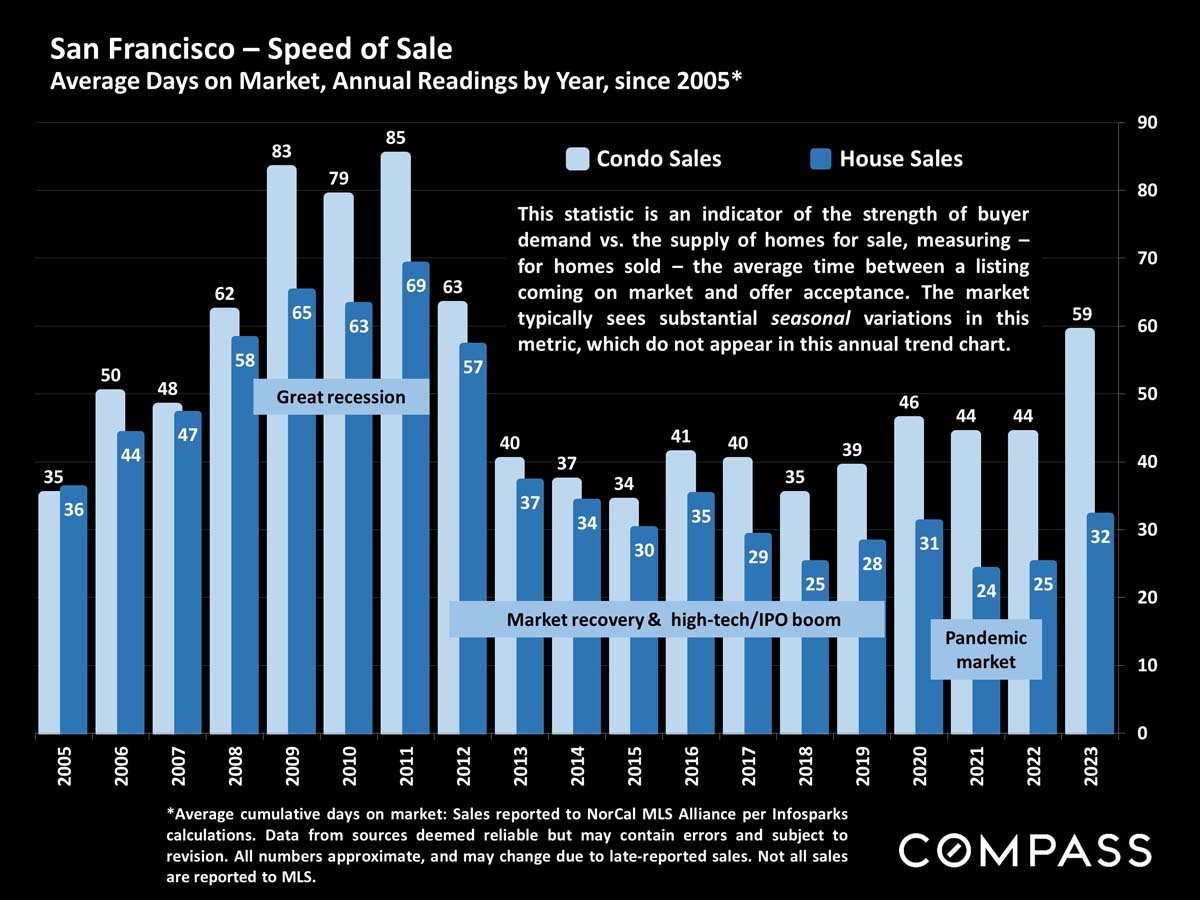
Chart comparing San Francisco condo and house average days on market from 2005 to 2023.
 
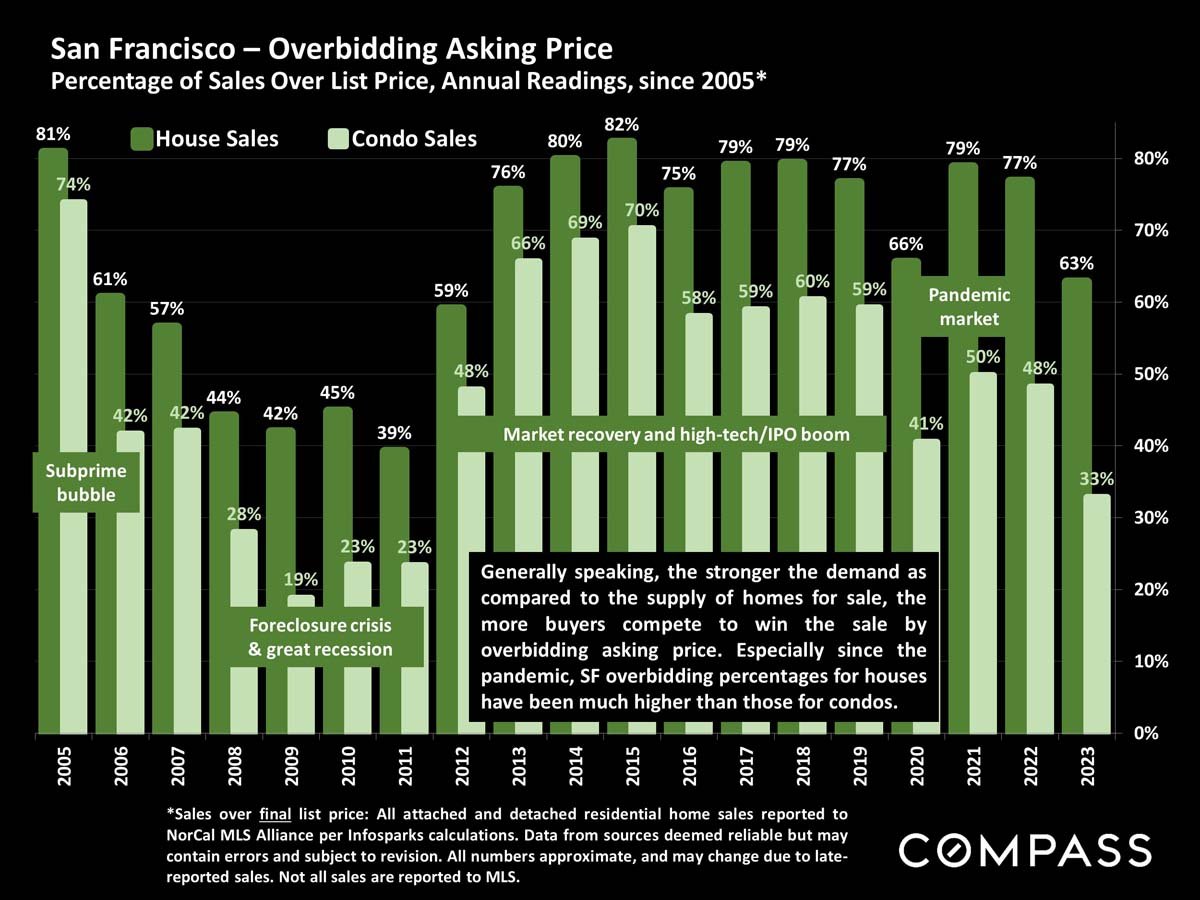
Chart comparing San Francisco house and condo sales above list price from 2005 to 2023, with market-era annotations.
 
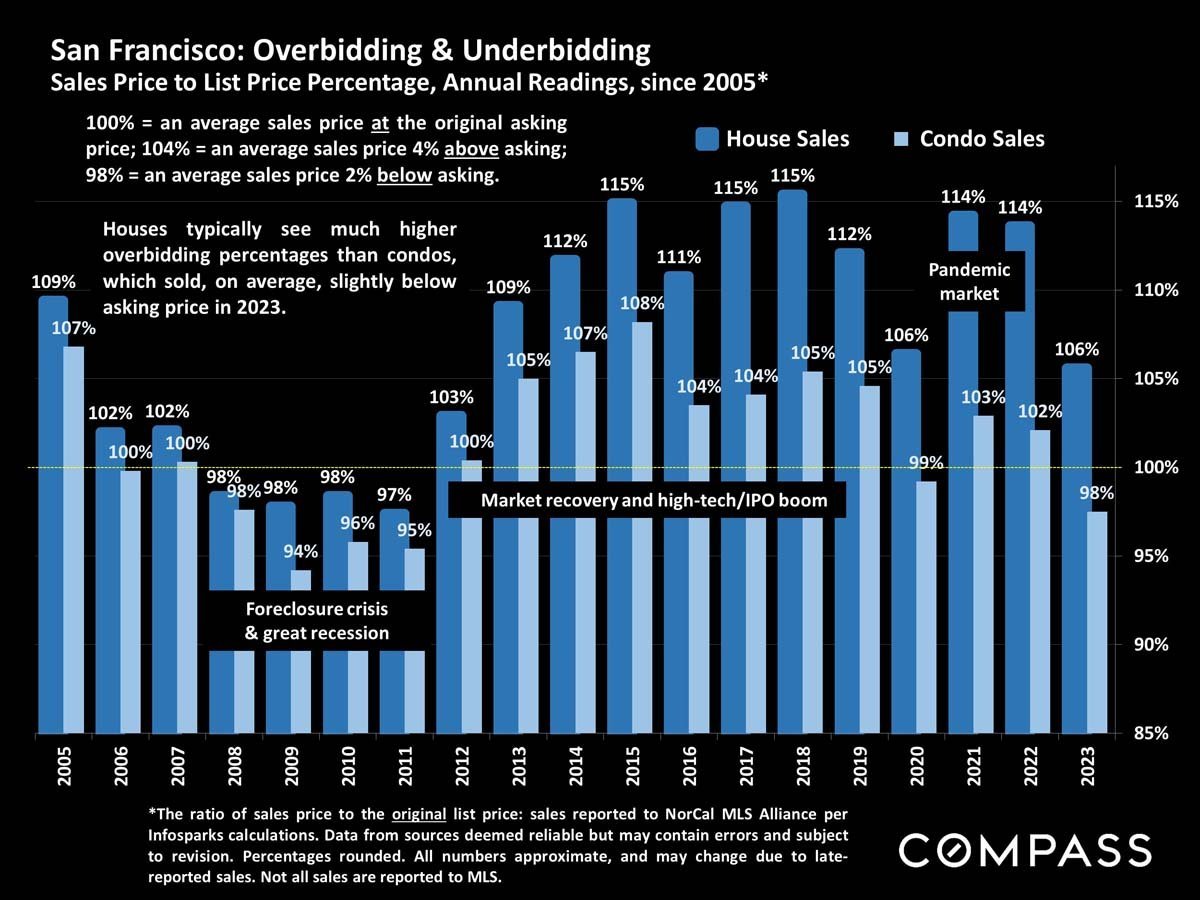
San Francisco house and condo sale prices versus list prices, charted annually from 2005 to 2023.
 
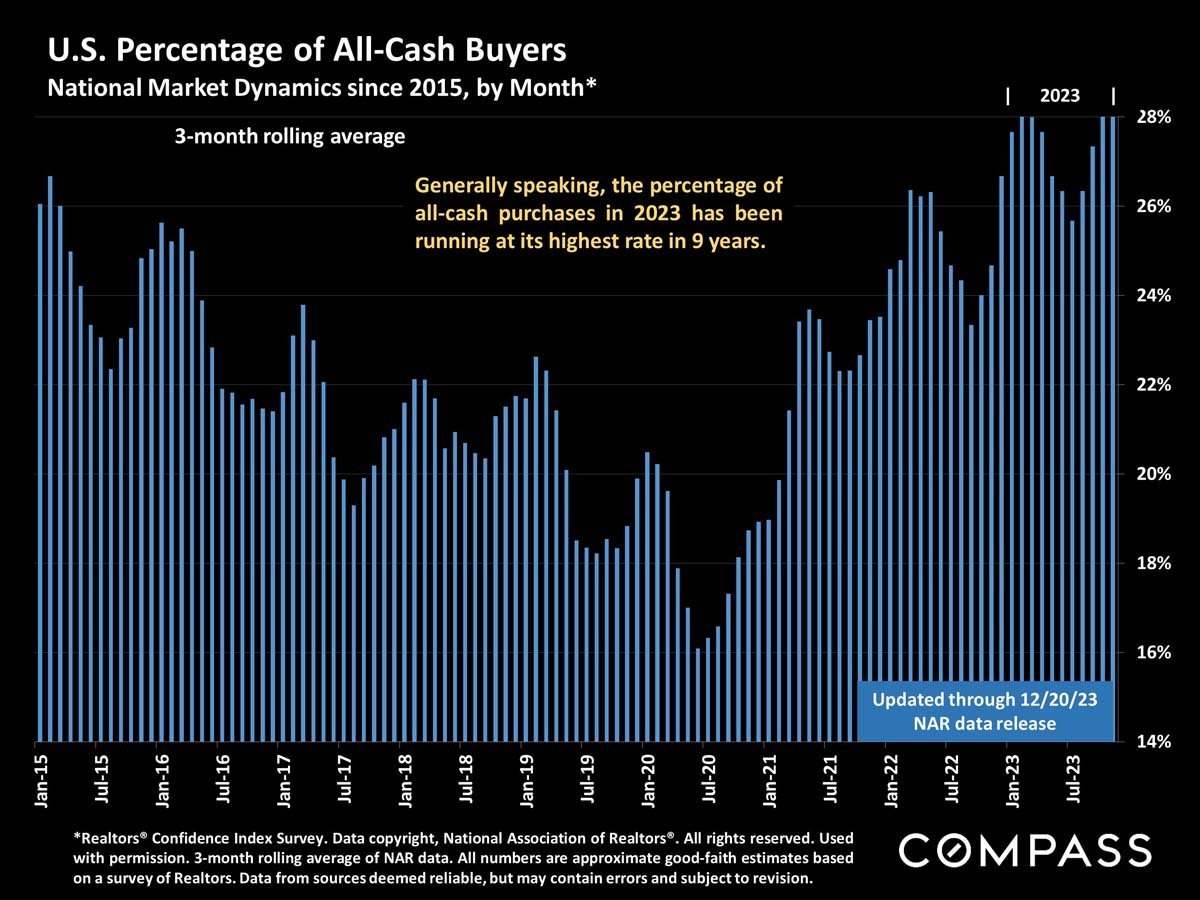
Bar chart showing the U.S. all-cash buyer share rising to about 28% in 2023.
 
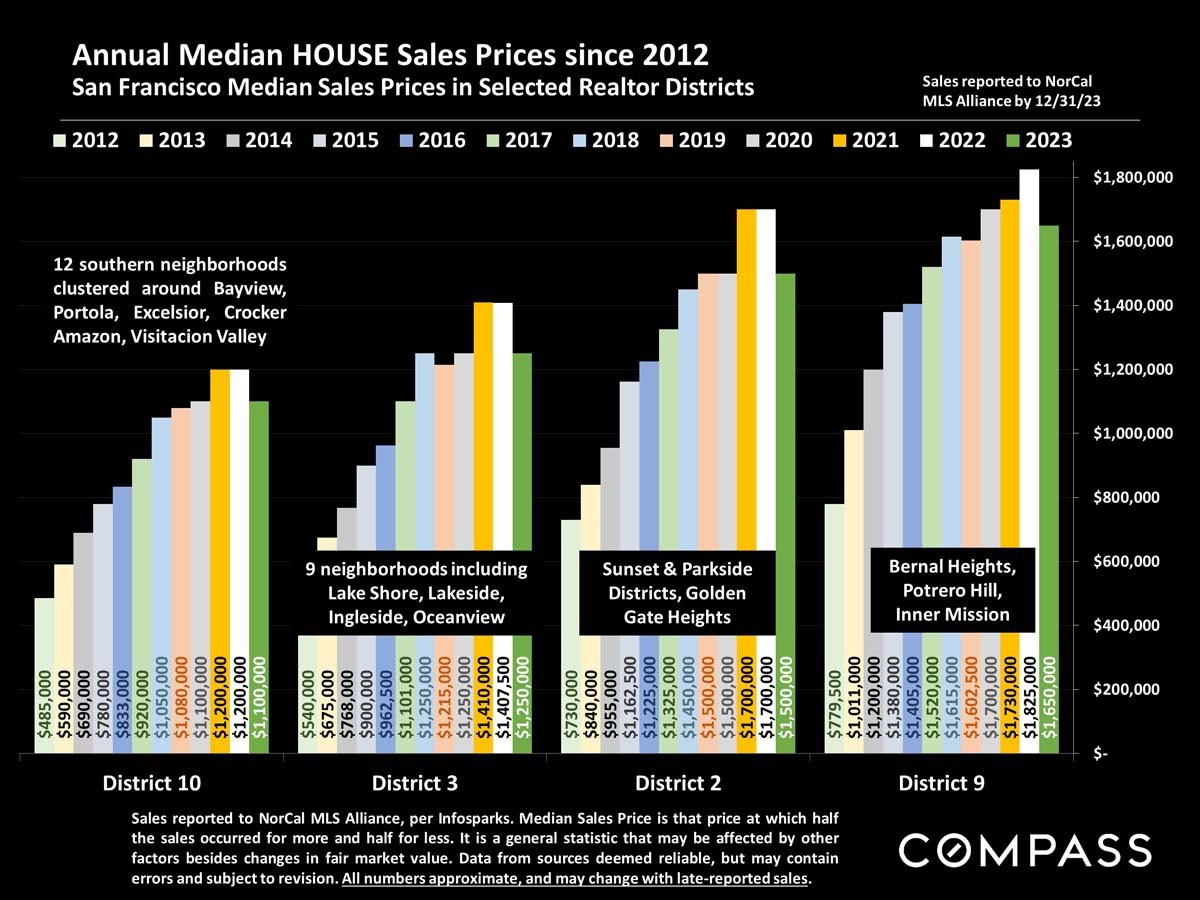
Chart comparing annual median San Francisco house prices from 2012–2023 across Districts 10, 3, 2, and 9.
 
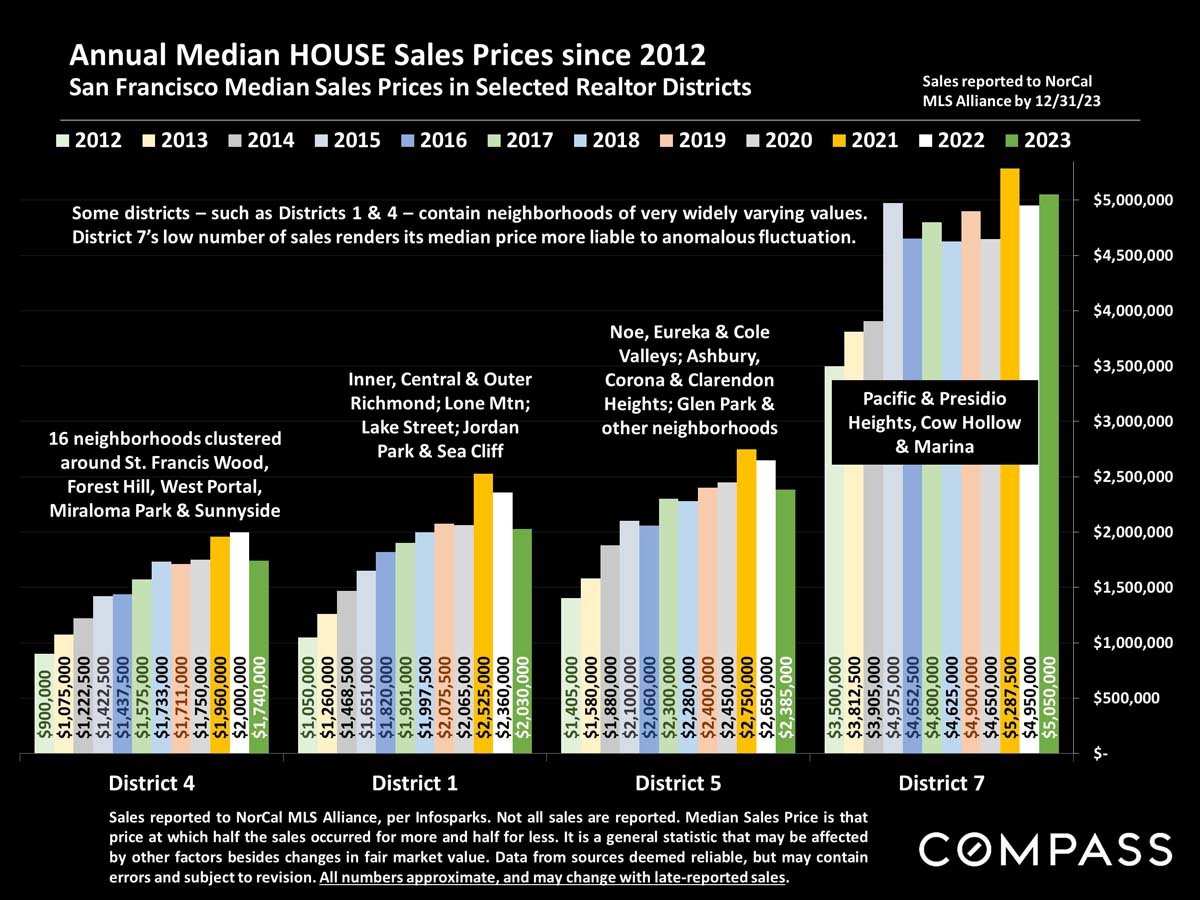
Chart of annual median San Francisco home sale prices by Realtor district, 2012–2023.
 
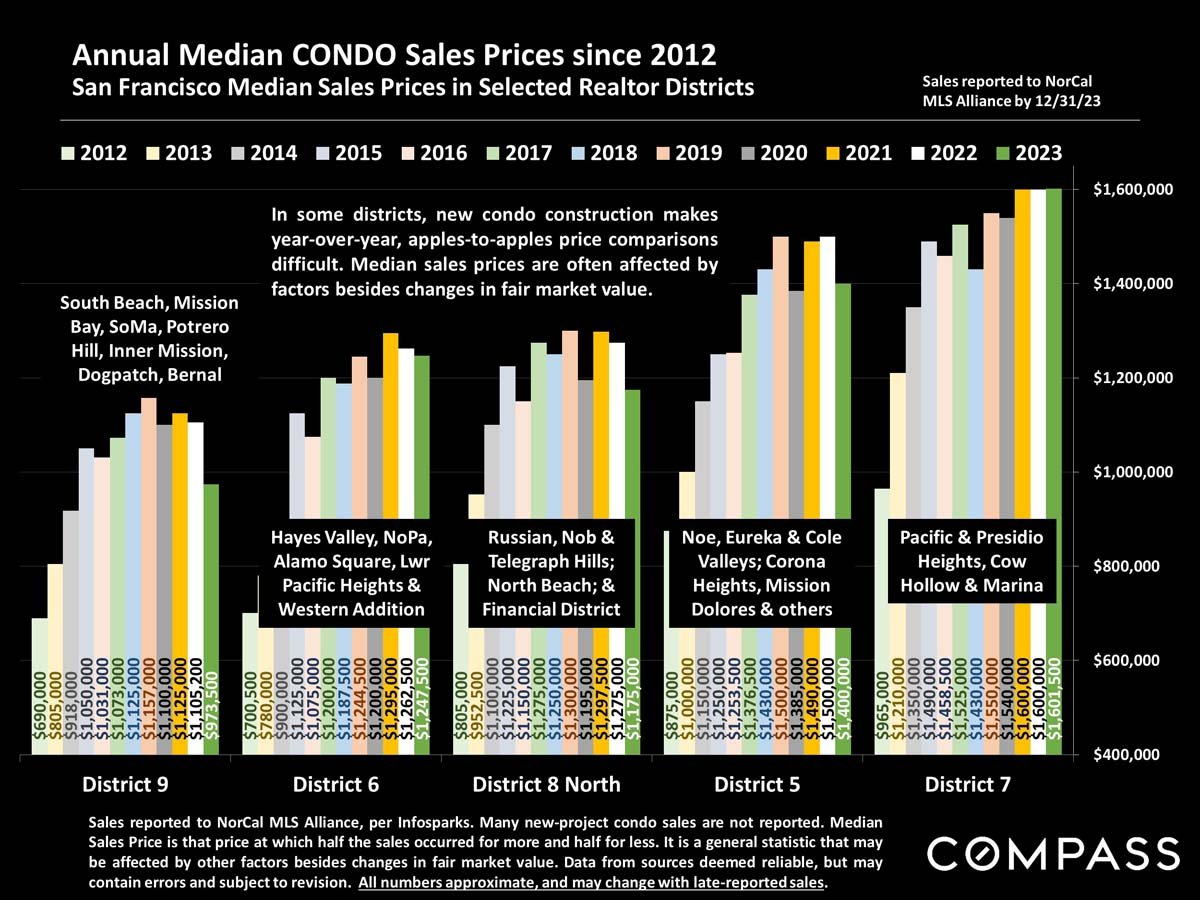
Chart of annual median San Francisco condo prices, 2012–2023, across five Realtor districts.
 
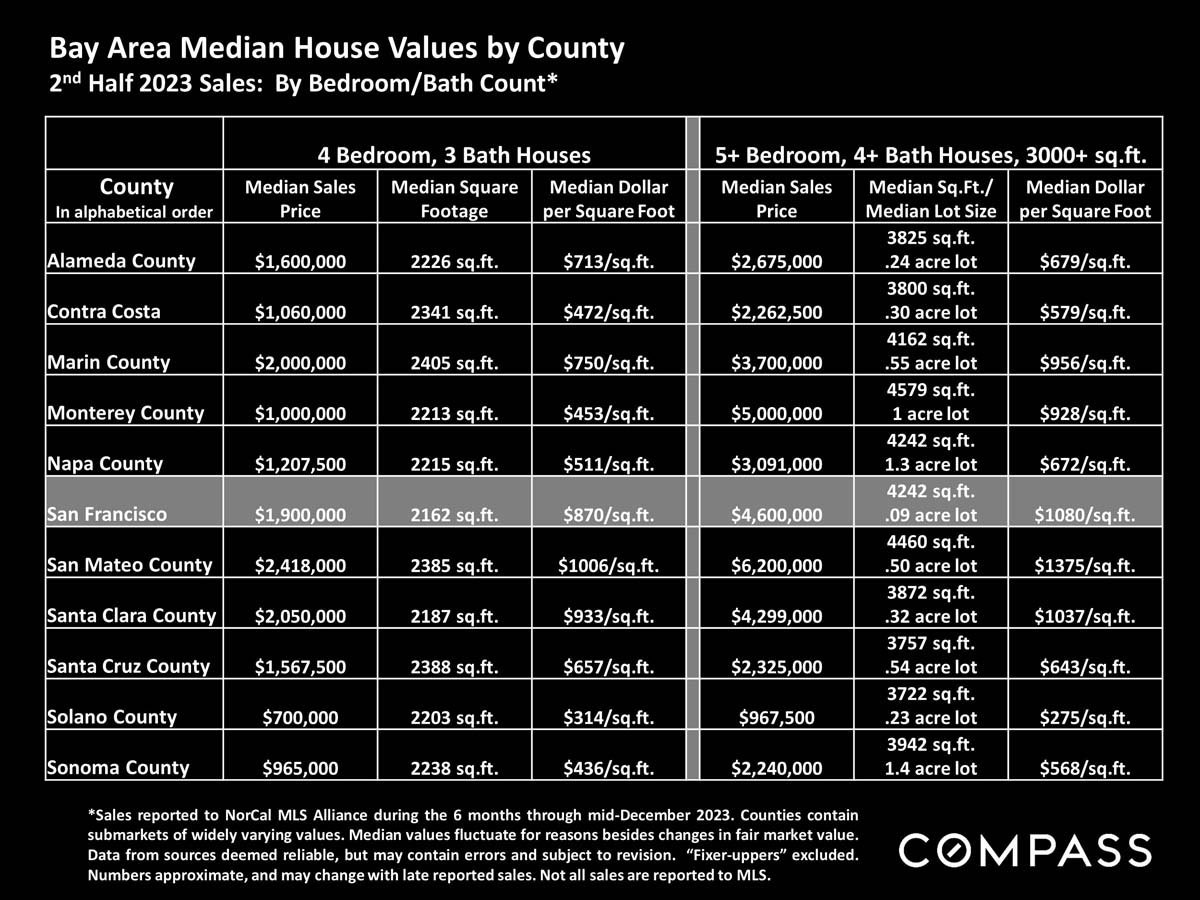
Chart comparing second-half 2023 home prices by county and house size, with San Francisco highlighted.
 
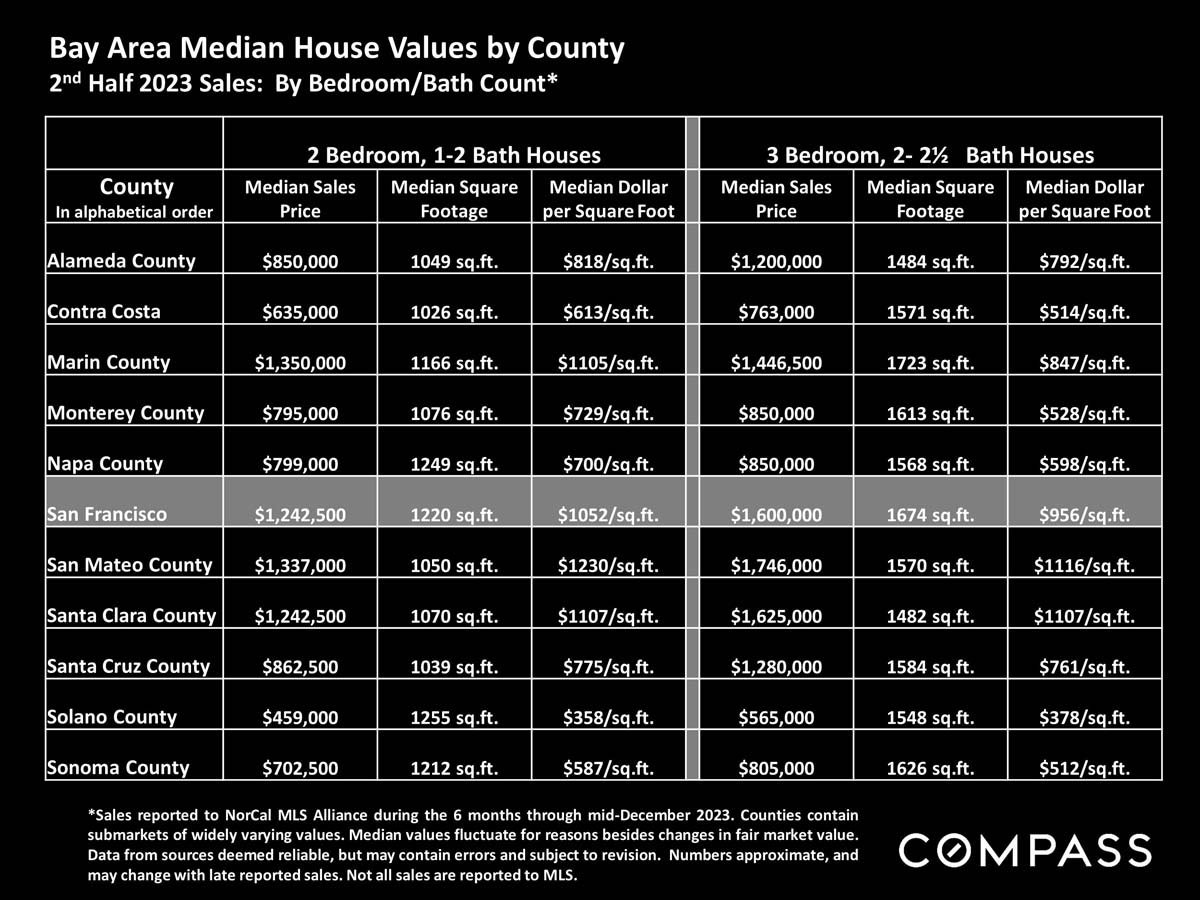
Chart comparing median prices, home sizes, and price per square foot by Bay Area county and bedroom count.
 
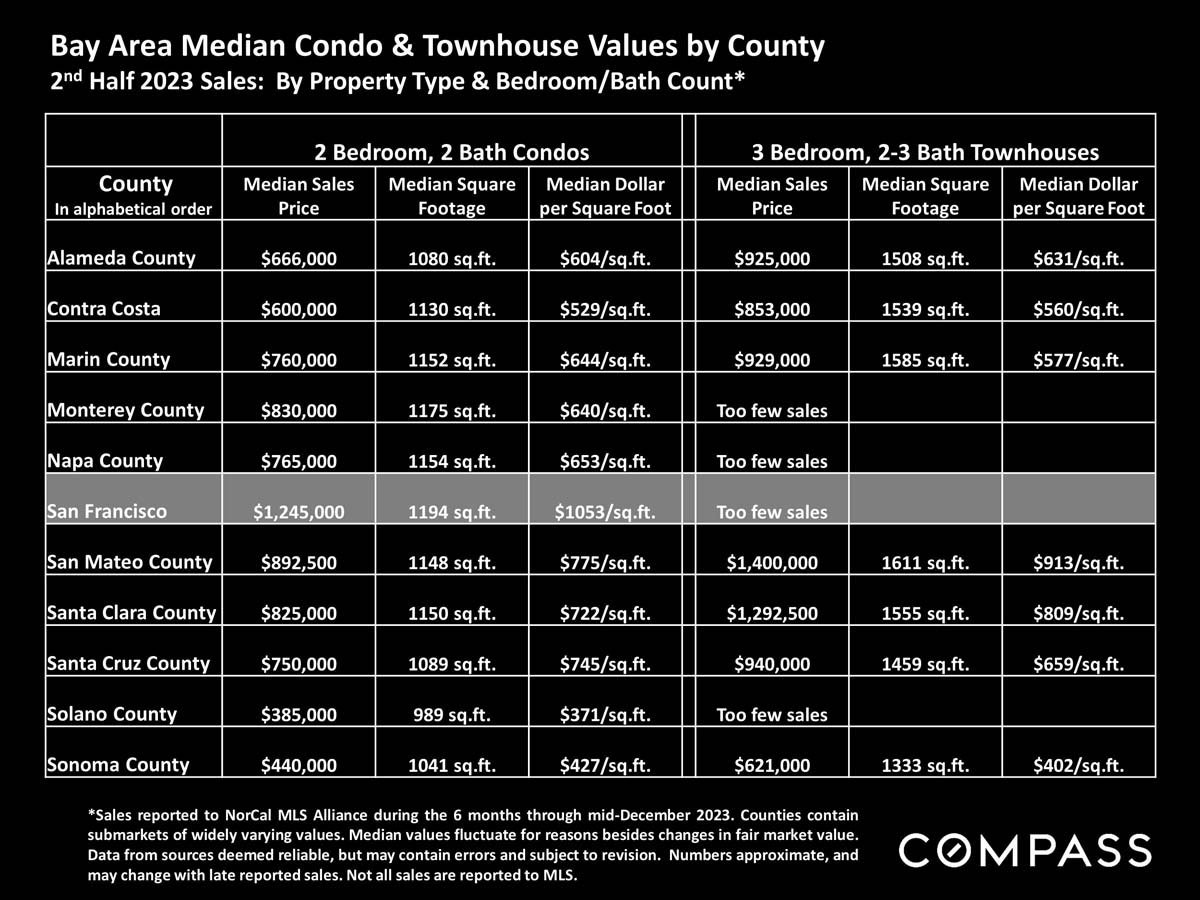
Bay Area condo and townhouse values by county, with median prices, square footage, and price per square foot.
 
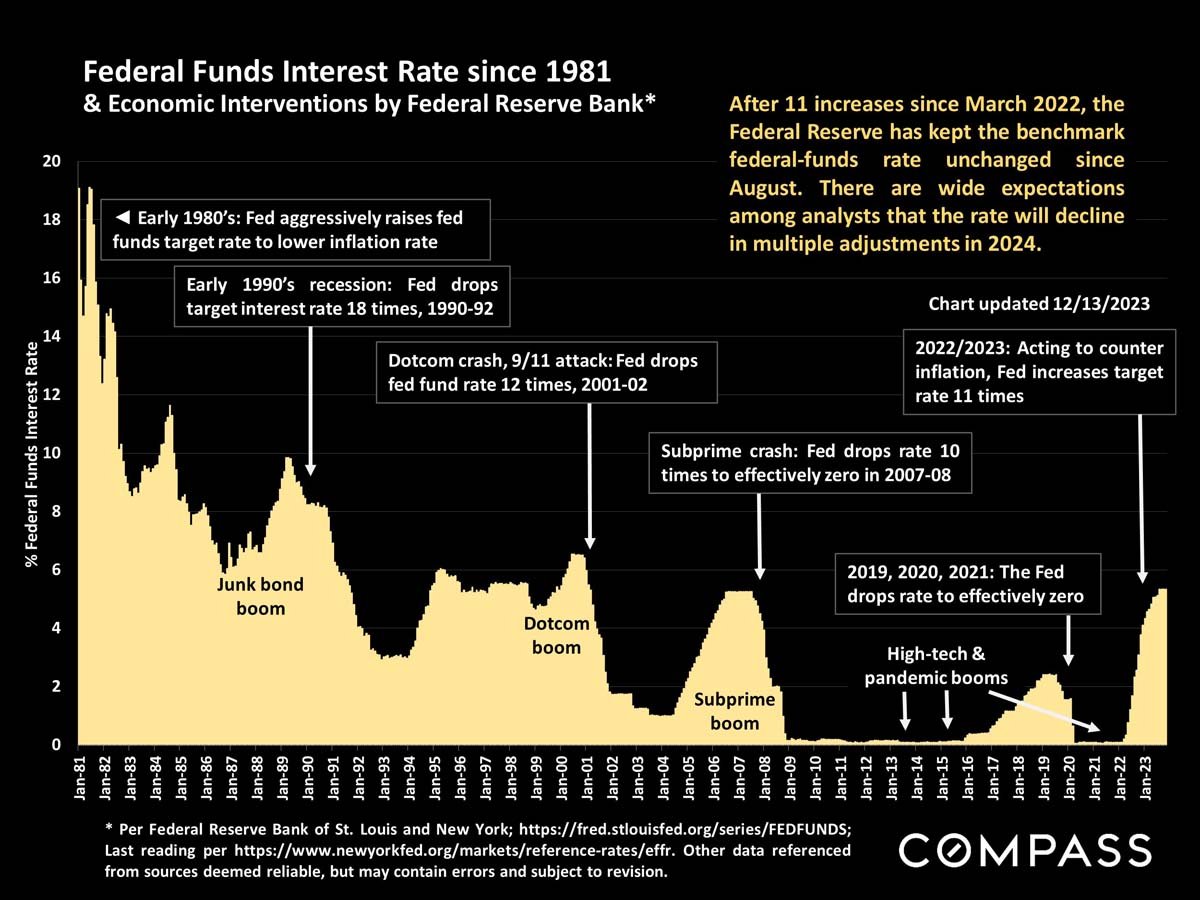
Chart of federal funds rates from 1981 to 2023, annotated with major economic interventions and a 2024 outlook.
 
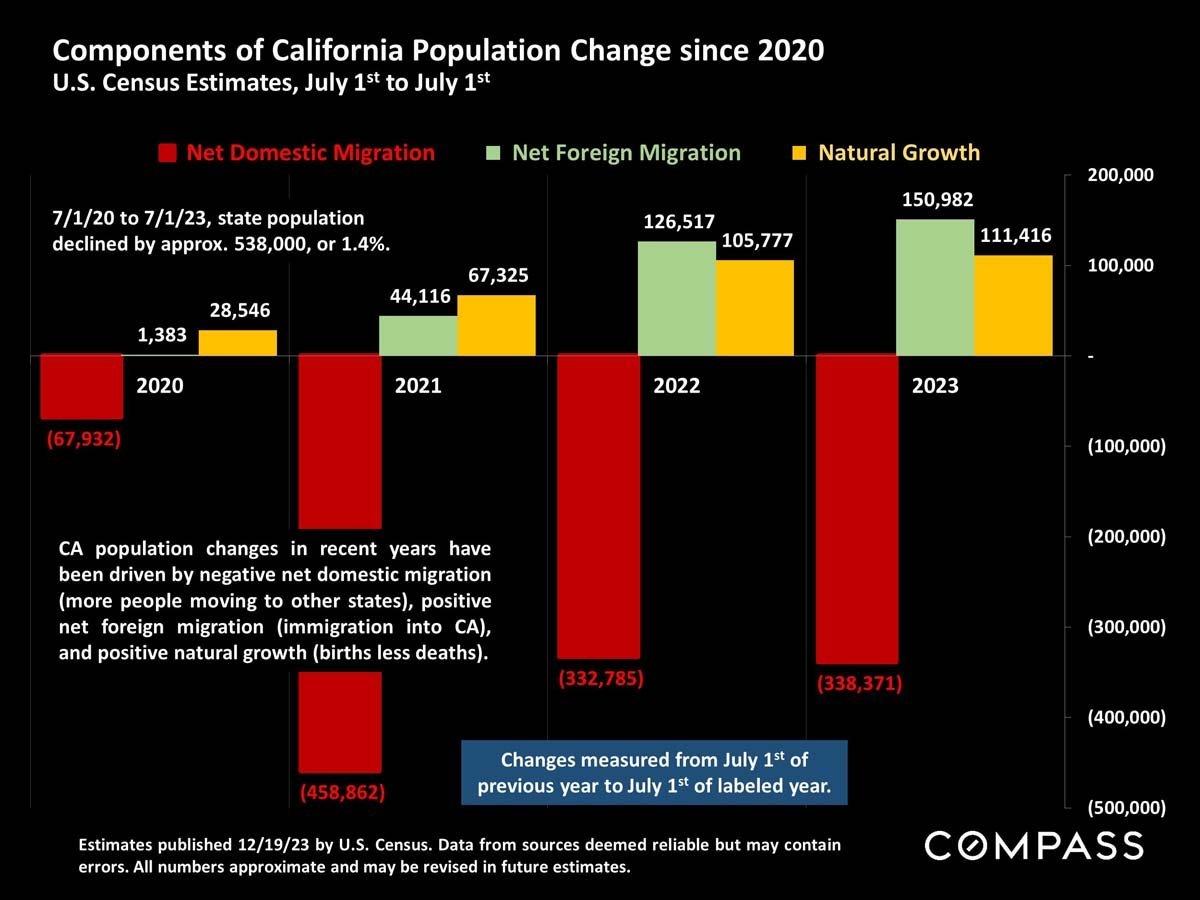
Chart shows California’s 2020–2023 population decline driven by domestic outmigration, partly offset by foreign migration and natural growth.
 
Real estate market report disclaimer and statistical definitions.

Work With Jane

Get assistance in determining the current property value, crafting a competitive offer, writing and negotiating a contract, and much more. Contact me today.
Follow Me on Instagram