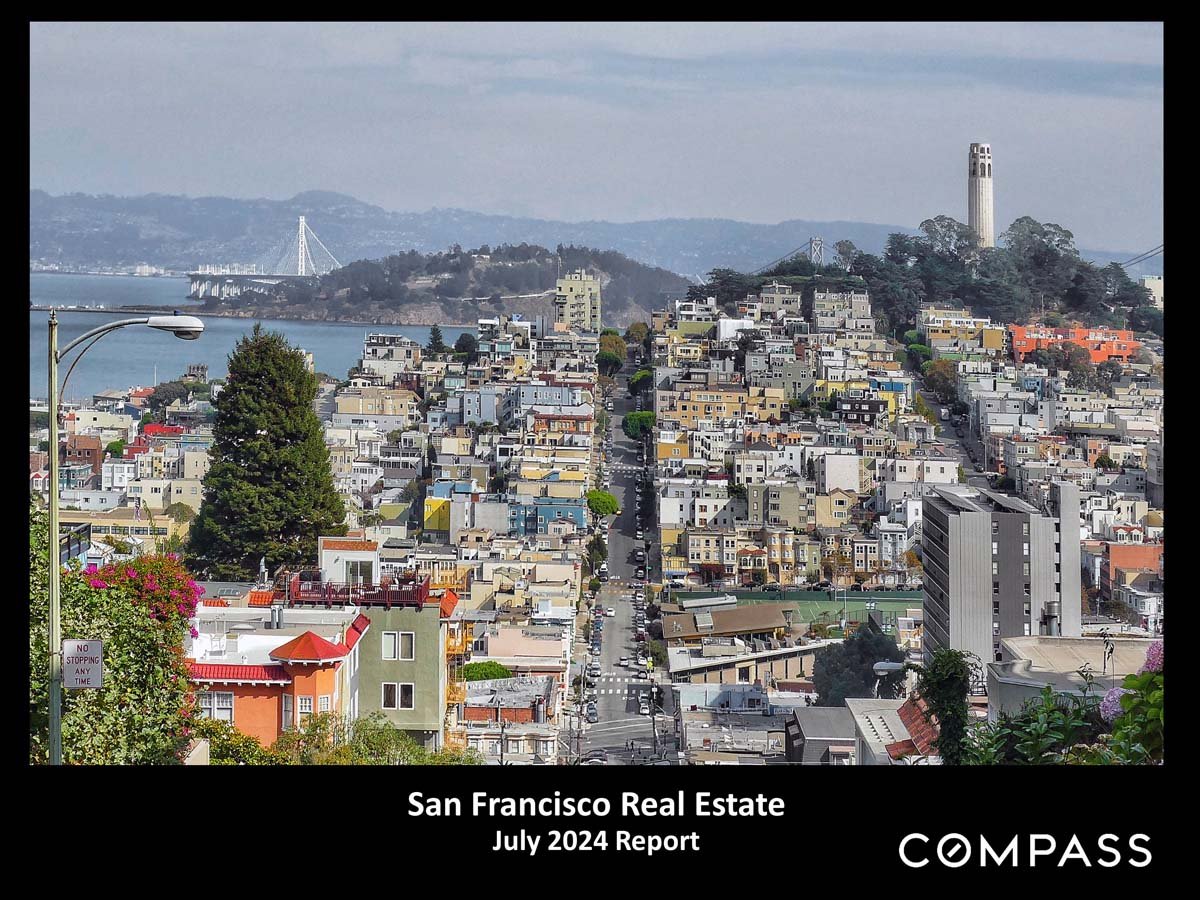
San Francisco real estate report cover with a city view, titled July 2024 Report.

San Francisco Home Prices, Market Conditions & Trends July 2024

The median house sales price in Q2 2024 rose 6% from Q2 2023, while the median condo sales price declined by 2.5%.
 
San Francisco real estate July 2024 report cover with a city panorama and Compass branding.
 
Report highlights on San Francisco home prices, sales, listings, and market conditions in July 2024.
 
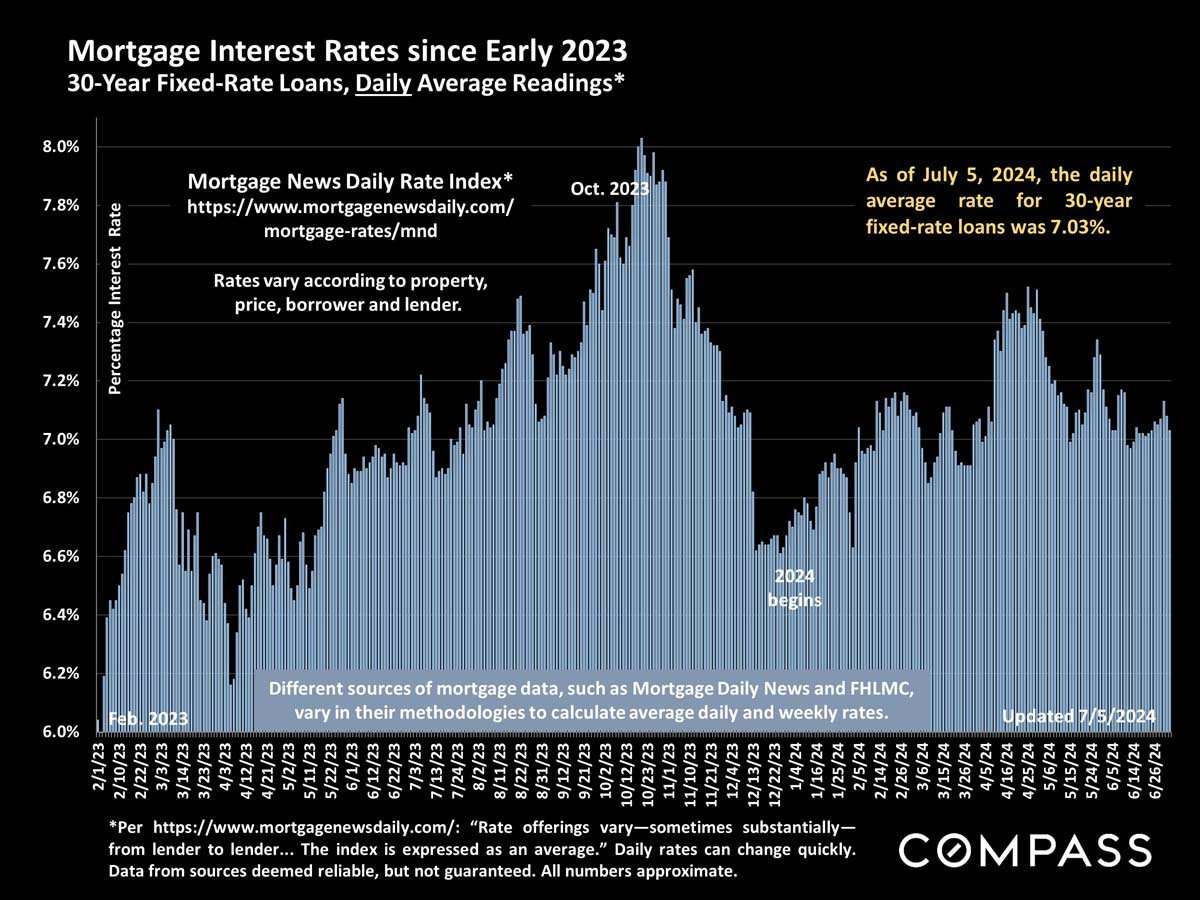
Chart of daily 30-year fixed mortgage rates from February 2023 to July 2024, ending at 7.03%.
 
Nasdaq Composite Index chart, January 1995 to 2024 YTD, rising to a record high above 18,000.
 
San Francisco quarterly median house prices, 2012–2024, peaking in Q2 2022 and up 6% year over year in Q2 2024.
 
Bar chart of San Francisco condo median prices, 2012–Q2 2024, peaking in 2022 and down 2.5% year over year.
 
Chart comparing San Francisco condo prices: non-Downtown prices end near $1.27 million, Downtown/SoMa near $900,000 in June 2024.
 
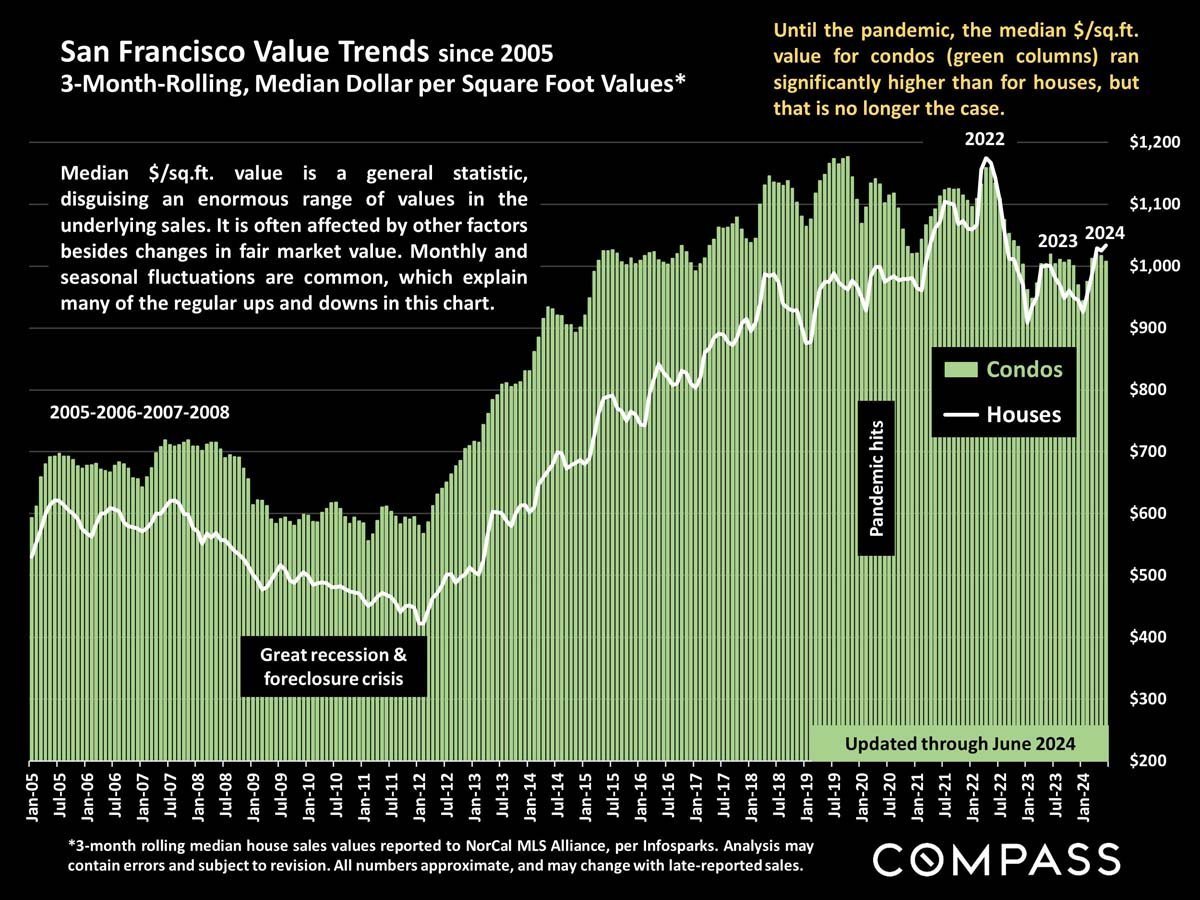
Chart tracks San Francisco condo and house values per square foot from 2005 to June 2024, highlighting recession and pandemic trends.
 
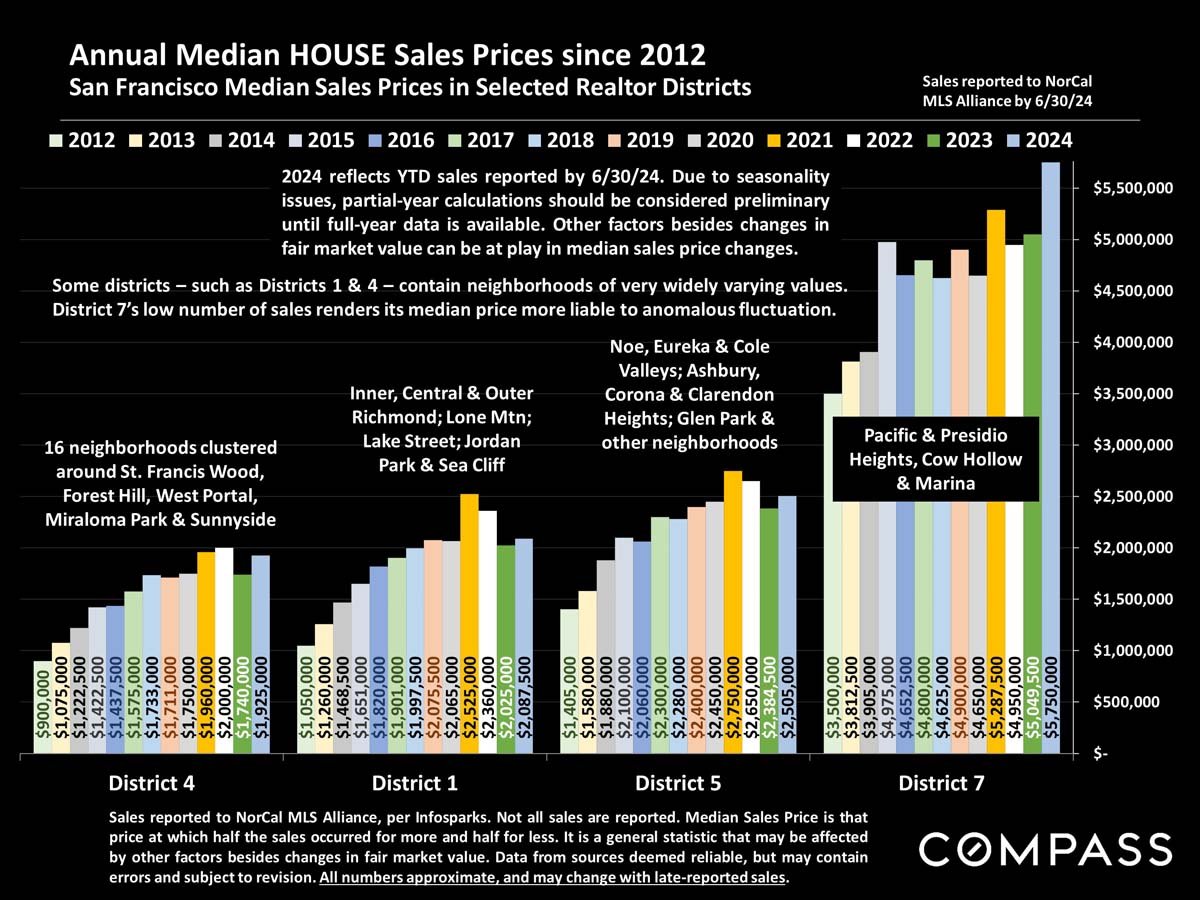
Bar chart compares annual median house sale prices across four San Francisco districts from 2012 to 2024.
 
Bar chart comparing annual median San Francisco home sale prices across four Realtor districts, 2012–2024.
 
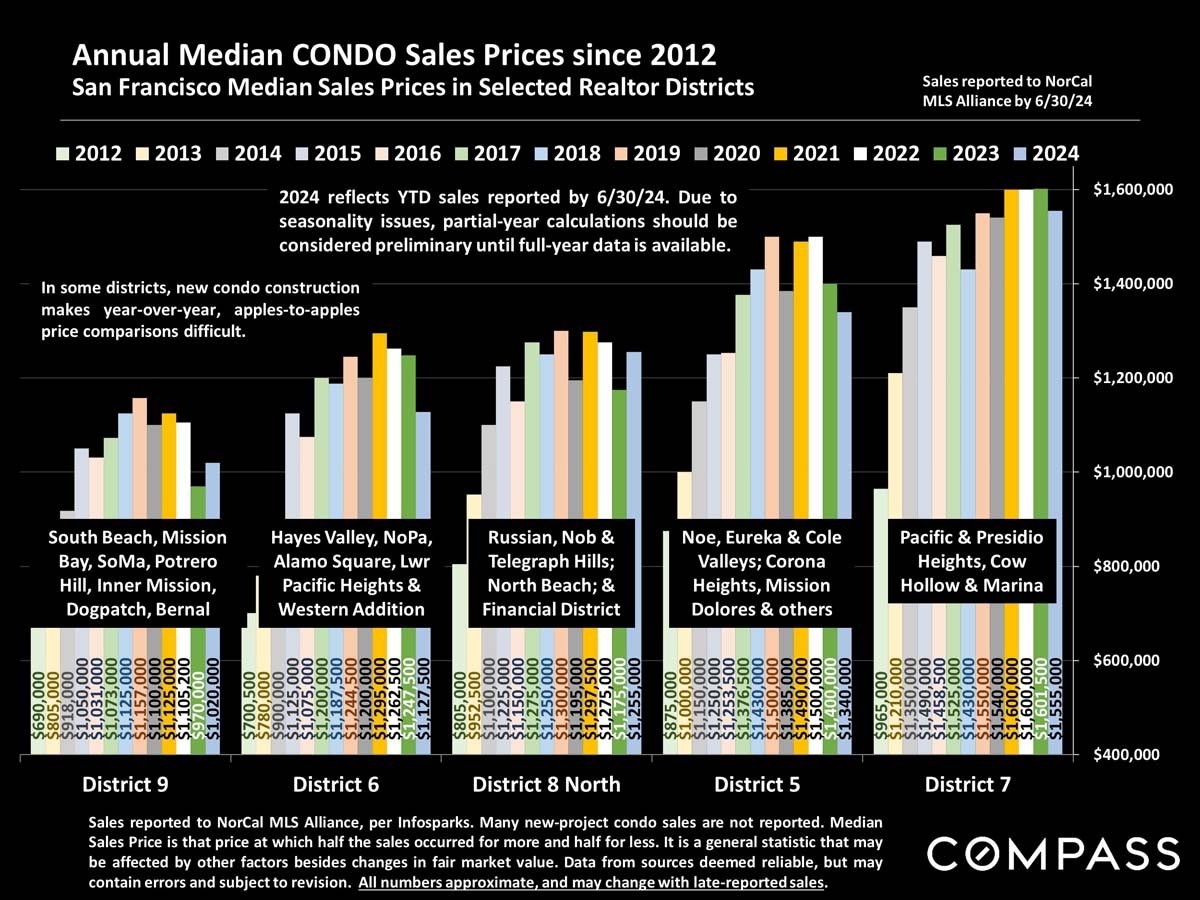
Chart comparing annual median condo sale prices across five San Francisco districts from 2012 to 2024.
 
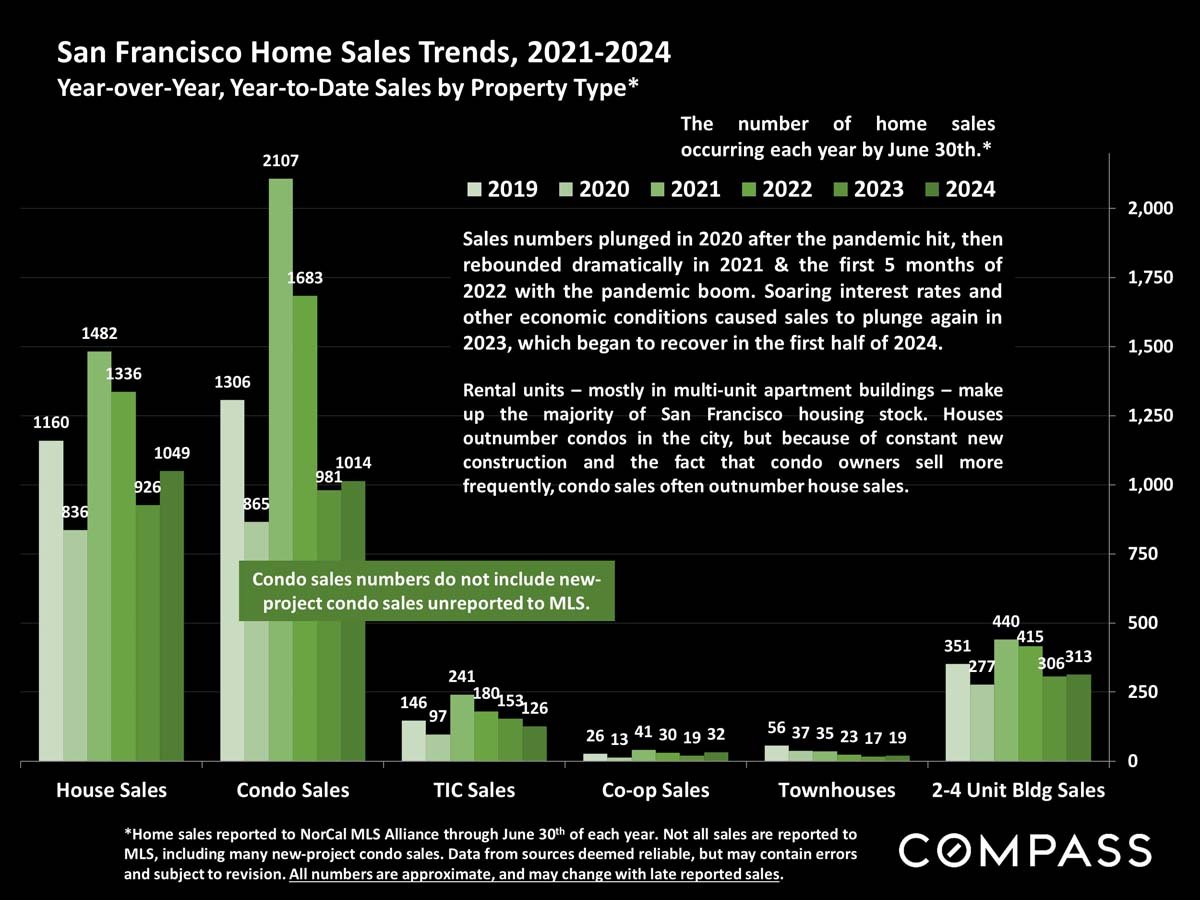
Chart comparing San Francisco year-to-date home sales by property type from 2019 to 2024.
 
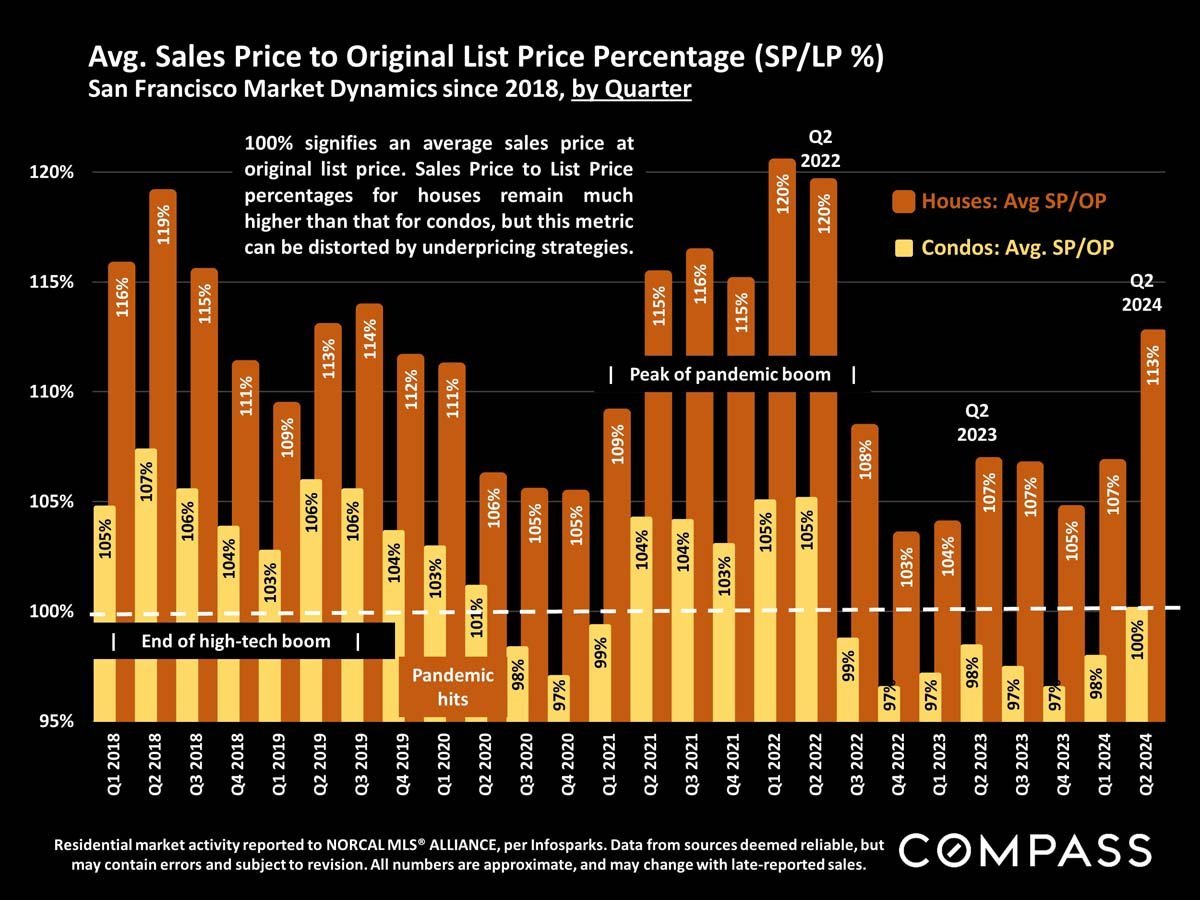
Chart comparing San Francisco house and condo sale prices to original list prices by quarter from 2018 to 2024.
 
Chart of San Francisco new listings, December 2019–June 2024, showing seasonal peaks and a 4% year-over-year Q2 increase.
 
Bar chart of San Francisco active and coming-soon home listings, February 2022–July 2024.
 
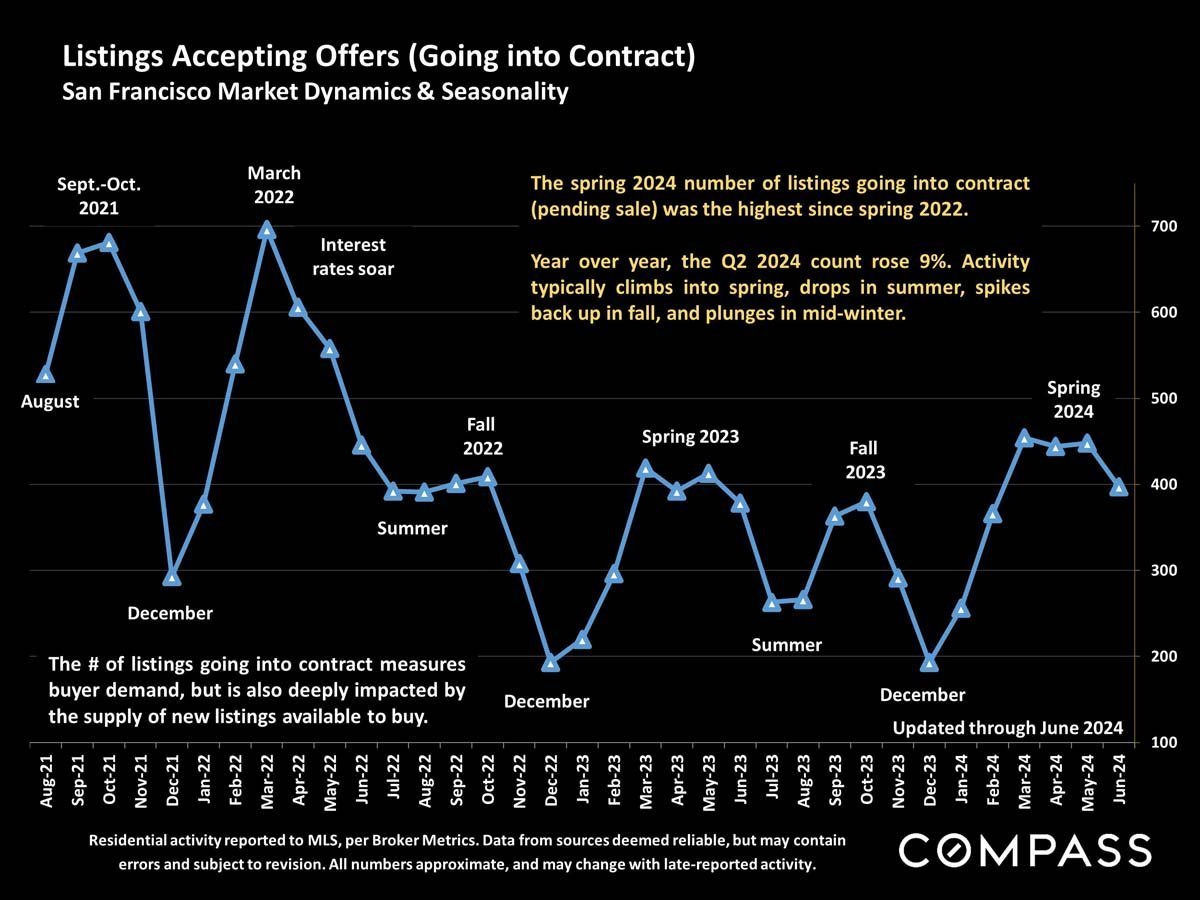
Chart of San Francisco listings going into contract, showing seasonal trends and a spring 2024 high.
 
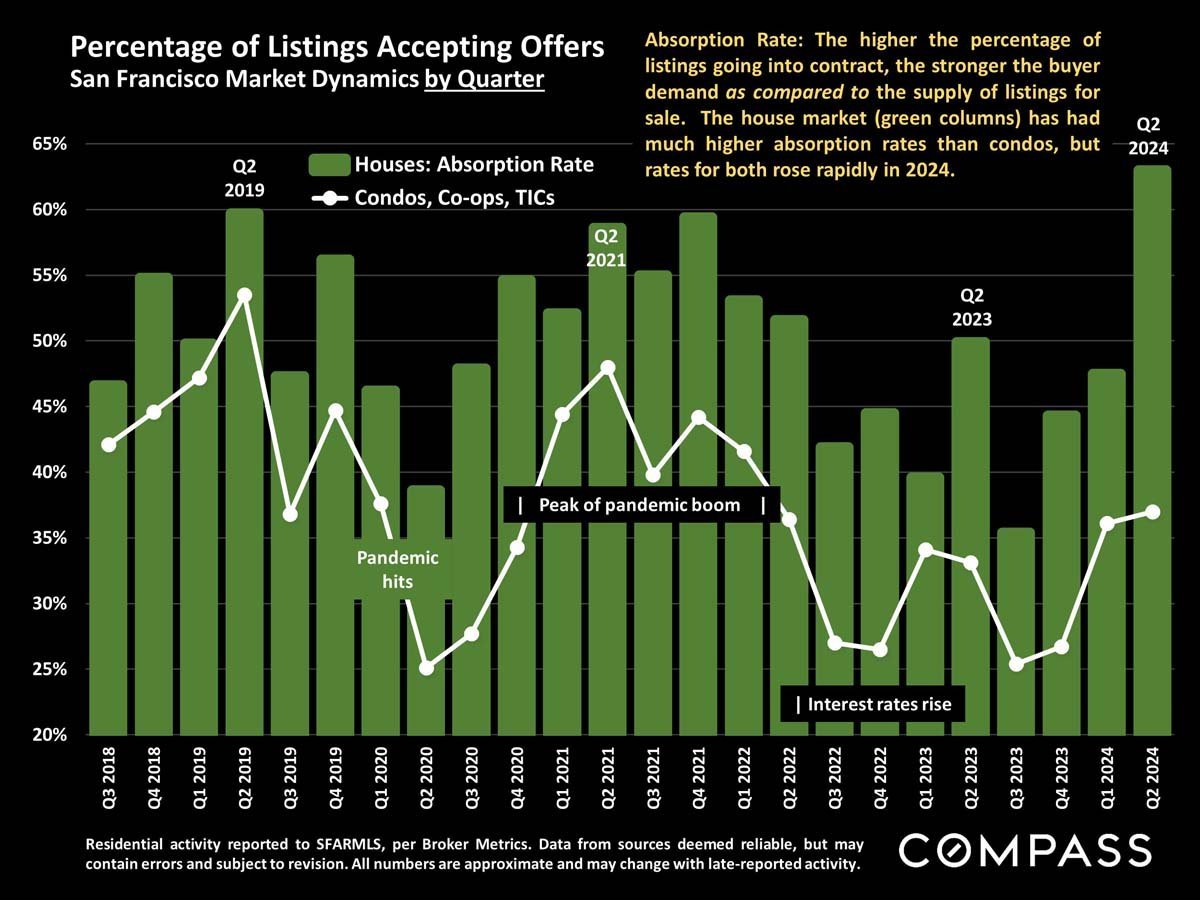
Chart comparing quarterly San Francisco home and condo listing absorption rates from 2018 to 2024.
 
Bar chart of San Francisco monthly home sales from January 2020 through June 2024, with seasonal and pandemic annotations.
 
Chart of San Francisco home sales from 2005 to June 2024, showing a sharp pandemic-era spike followed by a steep decline.
 
Chart comparing quarterly San Francisco sales of $3m+ houses and $2m+ condos, co-ops, and TICs since 2018.
 
Bar chart tracking San Francisco sales of homes priced at $5 million or more, with a 54% year-over-year Q2 2024 increase.
 
Chart comparing average days on market for San Francisco houses and condos from Q2 2019 to Q2 2024.
 
Chart of San Francisco active-listing price reductions, with October peaks and a 10% year-over-year decline in June 2024.
 
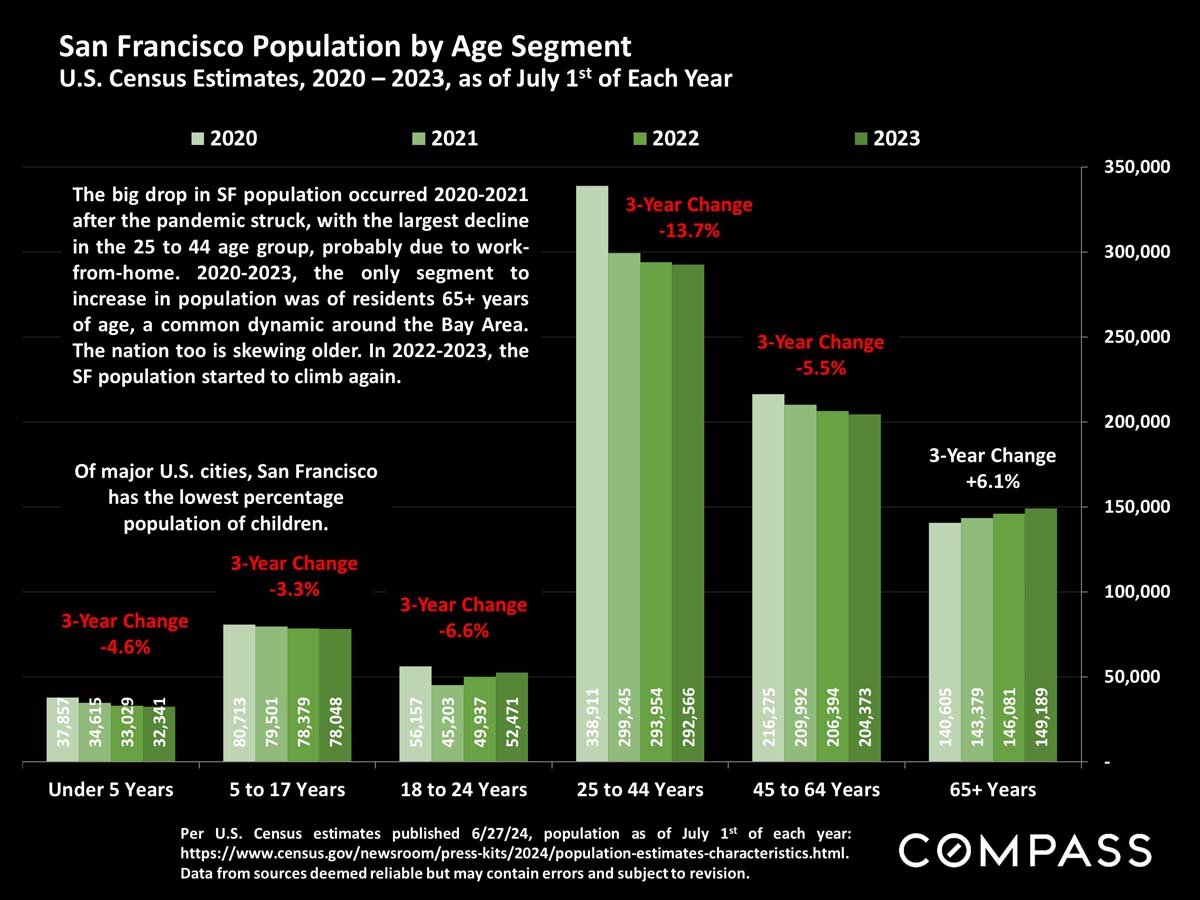
Infographic chart of San Francisco population by age segment from 2020 to 2023.
 
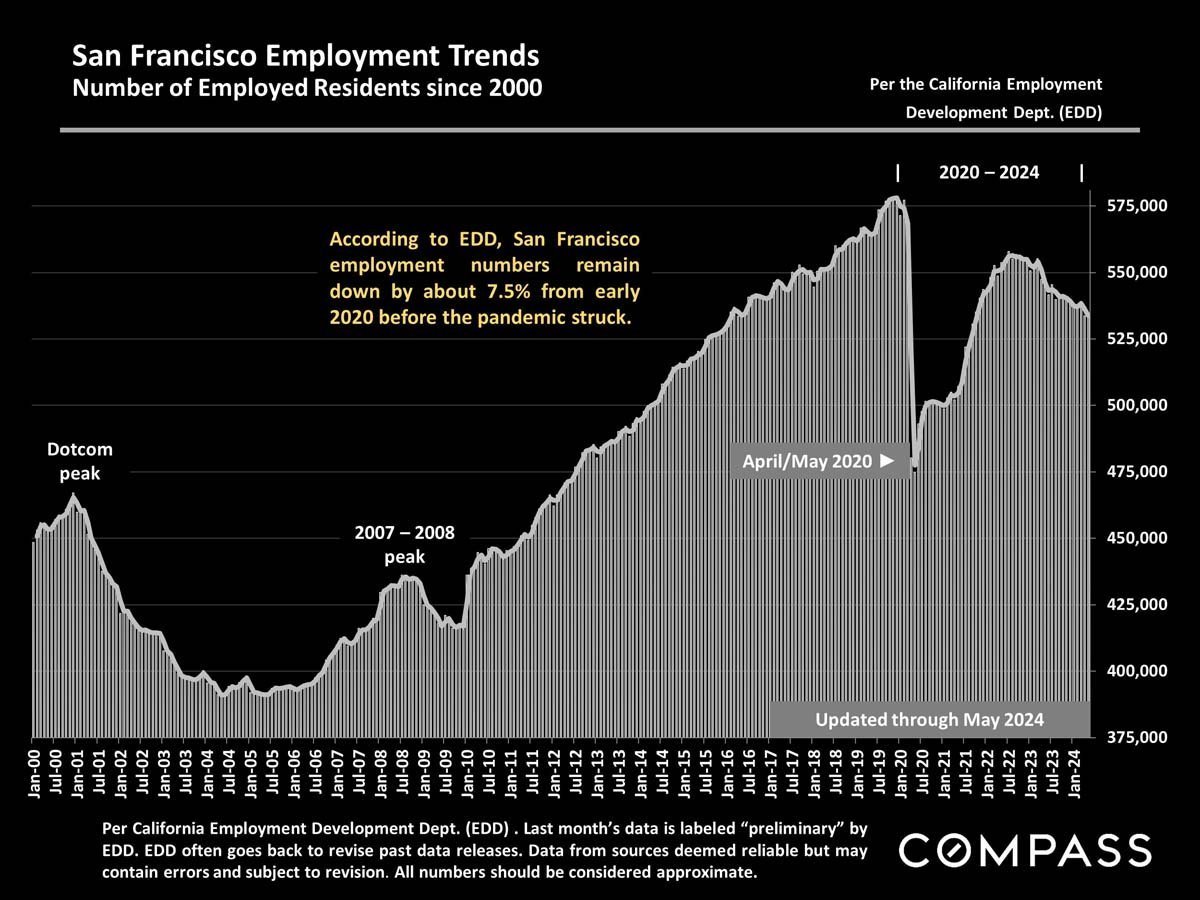
Chart of San Francisco employment, 2000–2024, showing a sharp 2020 drop and employment still below early 2020 levels.
 
Market report disclaimer explaining data limitations, sales statistics, photo licensing, and legal terms.

Work With Jane

Get assistance in determining the current property value, crafting a competitive offer, writing and negotiating a contract, and much more. Contact me today.

Follow Me on Instagram