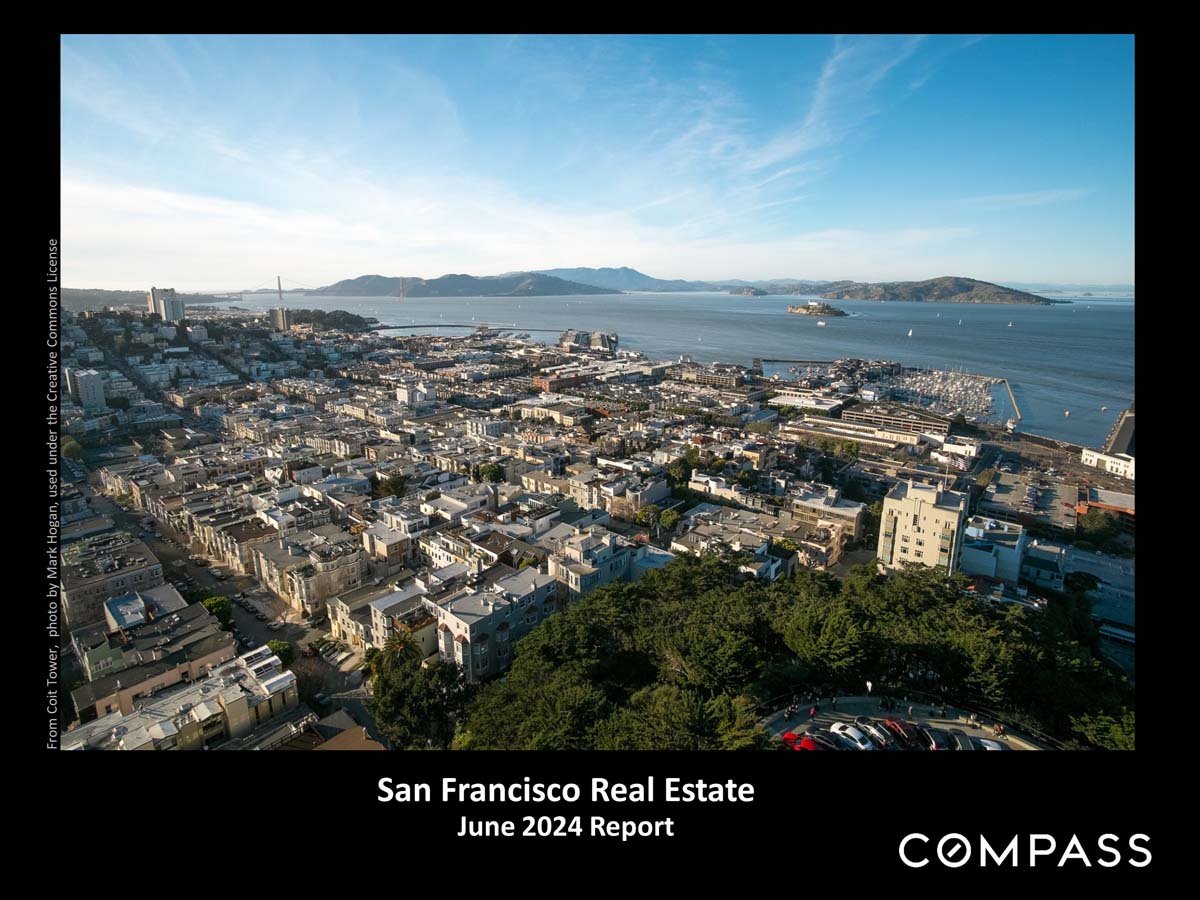
San Francisco Real Estate June 2024 Report, with an aerial view of the city and bay.

San Francisco Home Prices, Market Conditions & Trends June 2024

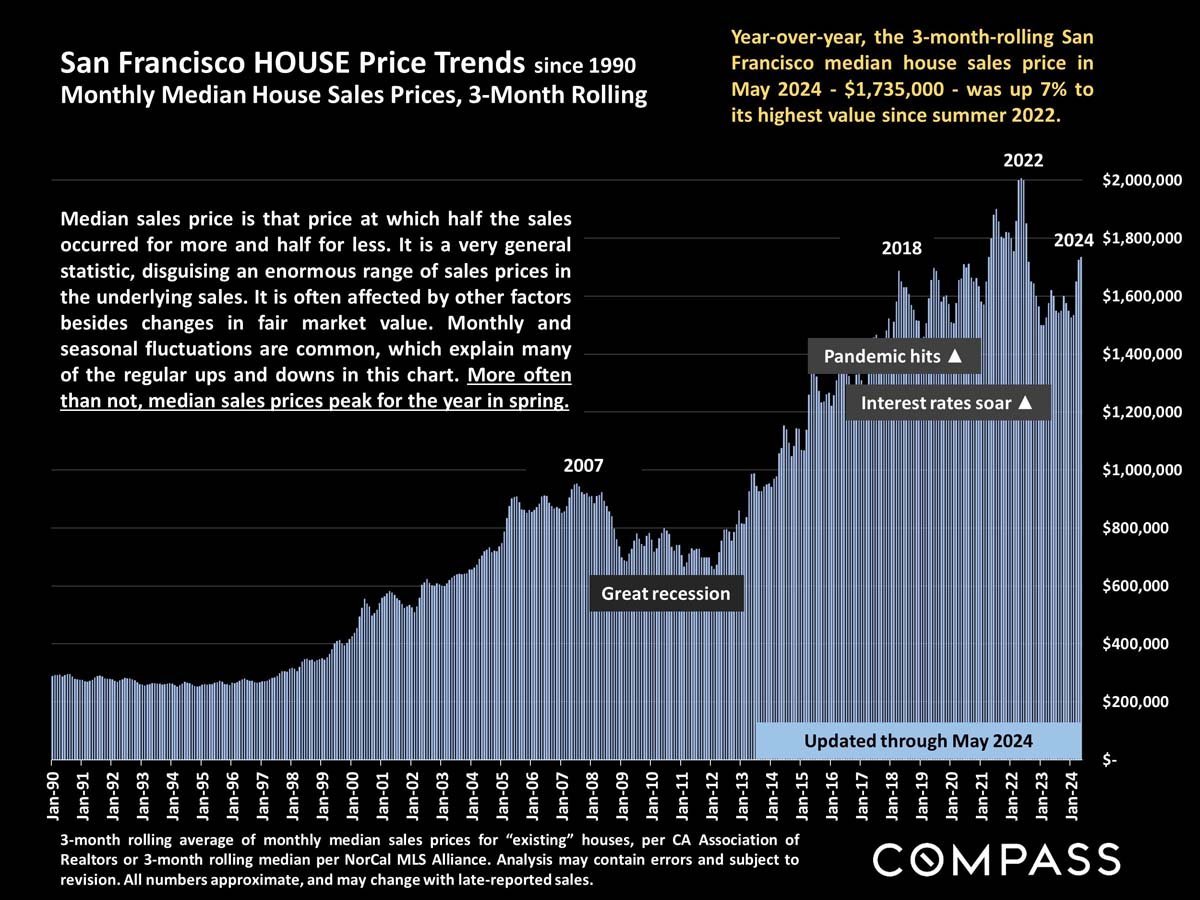
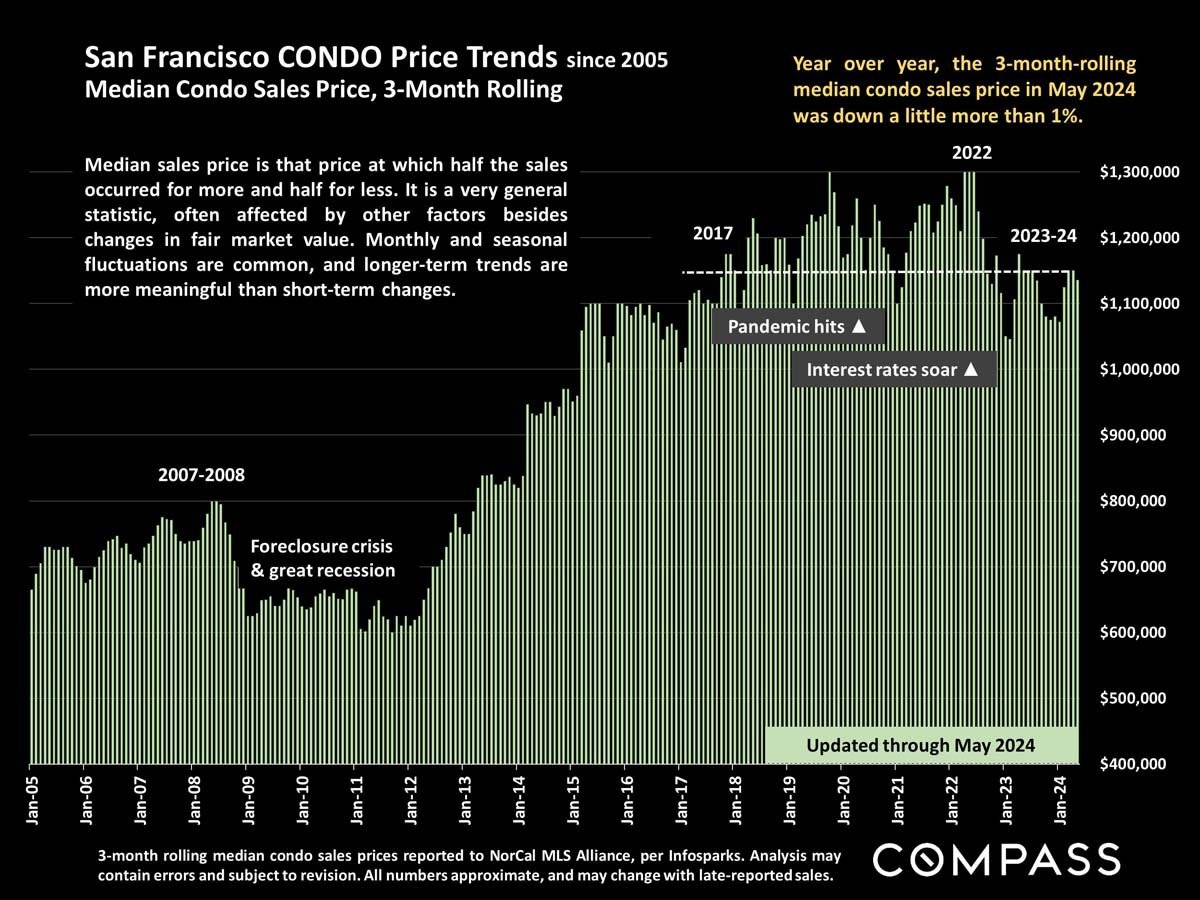
The 3-month-rolling median house sales price in May, at $1,735,000, hit its highest value since mid-2022. The median condo sales price, $1,135,500, declined about 1% year over year.
 
San Francisco Real Estate June 2024 Report, with an aerial view of the city and bay.
 
Report highlights summarize San Francisco home prices, sales trends, over-asking sales, and days on market.
 
Chart of San Francisco median home prices from 1990 to 2024, with a May 2024 median of $1.735 million.
 
San Francisco condo price trend chart, 2005–2024, with median prices and market event annotations.
 
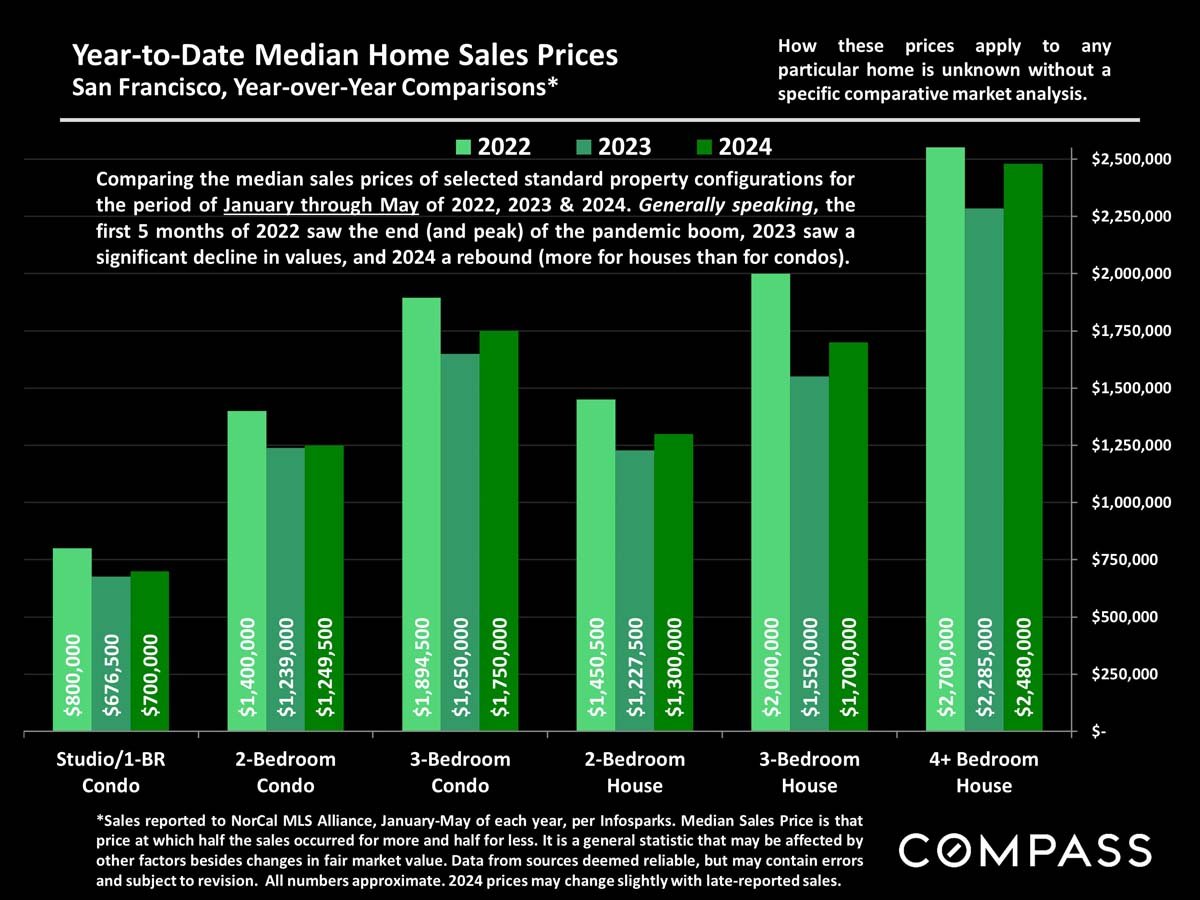
Chart comparing San Francisco median home sale prices by property type in 2022, 2023, and 2024.
 
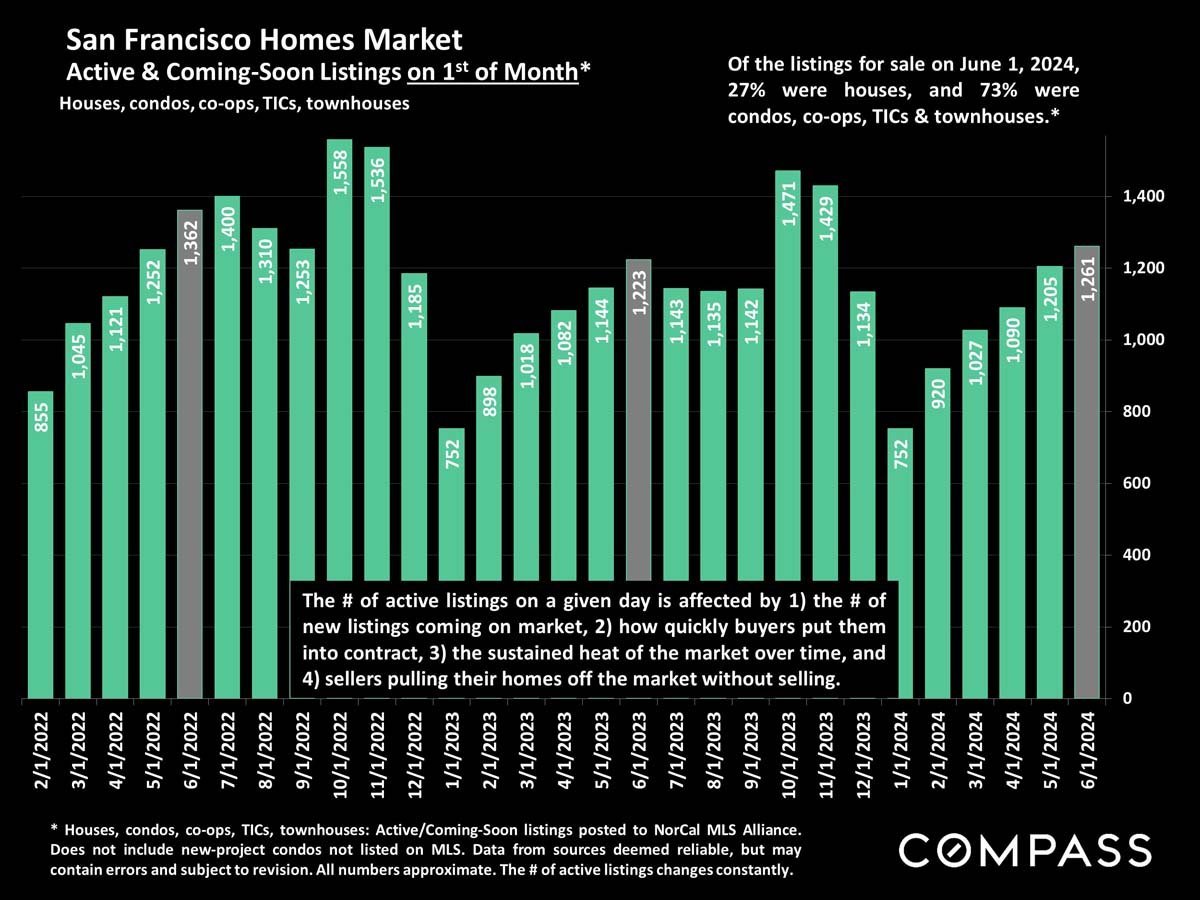
Chart of San Francisco active and coming-soon listings, February 2022–June 2024; June 2024 shows 1,261 listings.
 
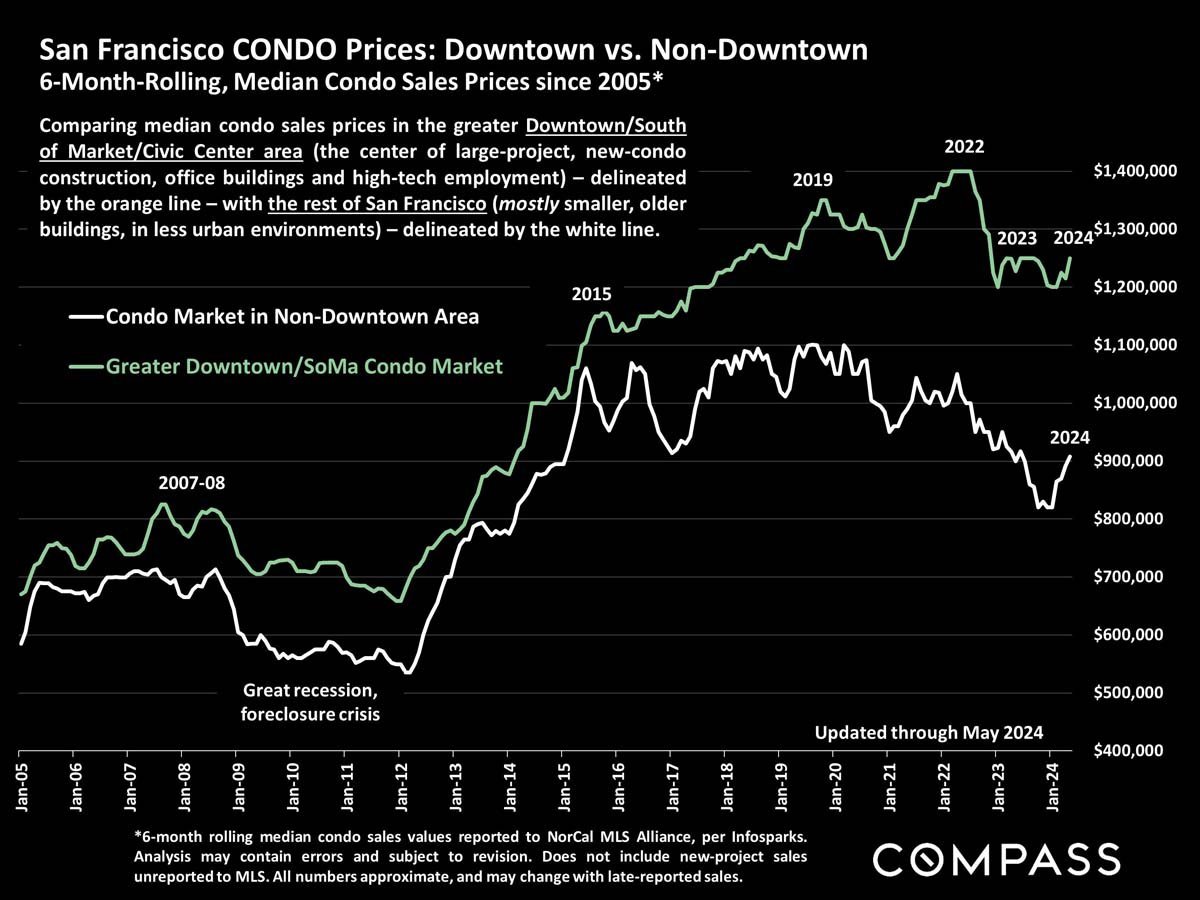
Line chart comparing San Francisco downtown and non-downtown median condo prices from 2005 through May 2024.
 
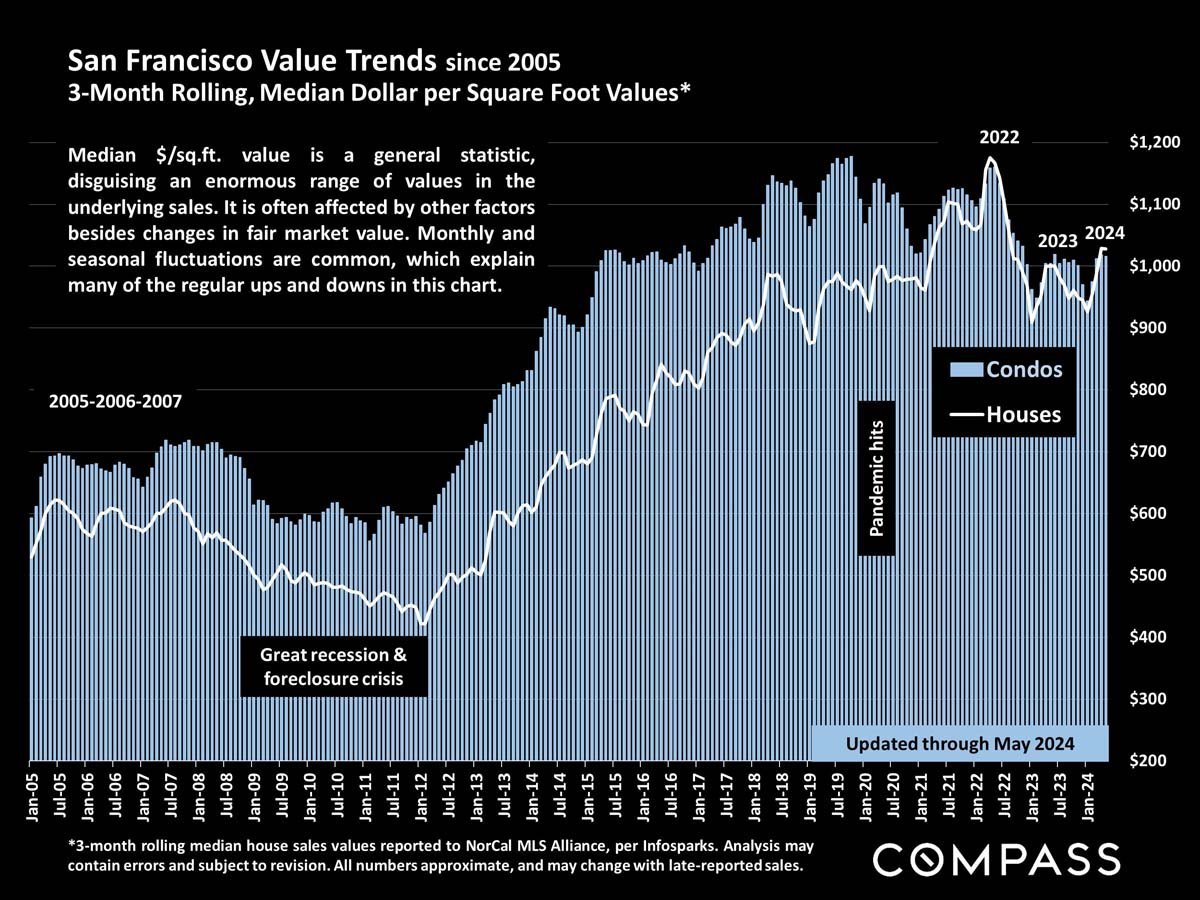
Chart comparing San Francisco median home and condo values per square foot from 2005 through May 2024.
 
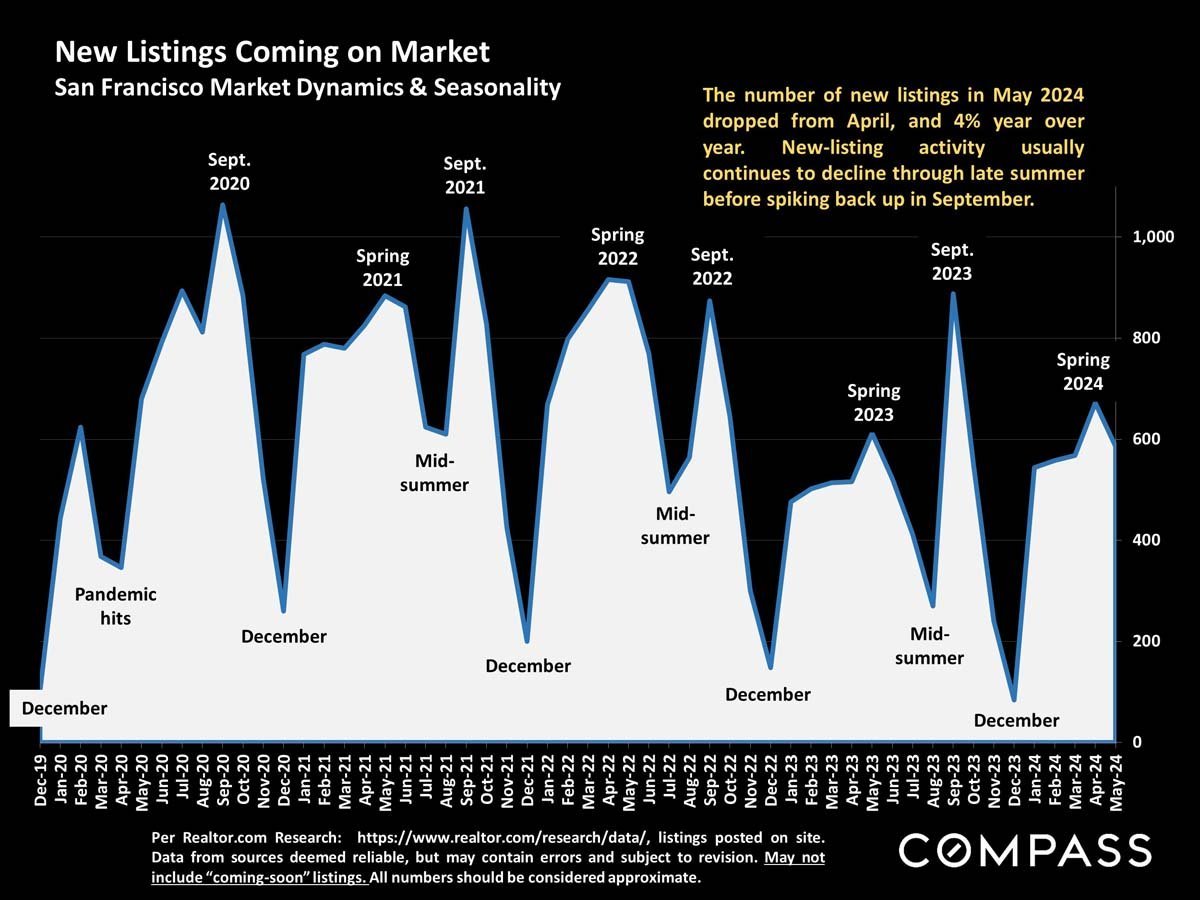
San Francisco new listings chart, December 2019–May 2024, showing seasonal peaks and lows.
 
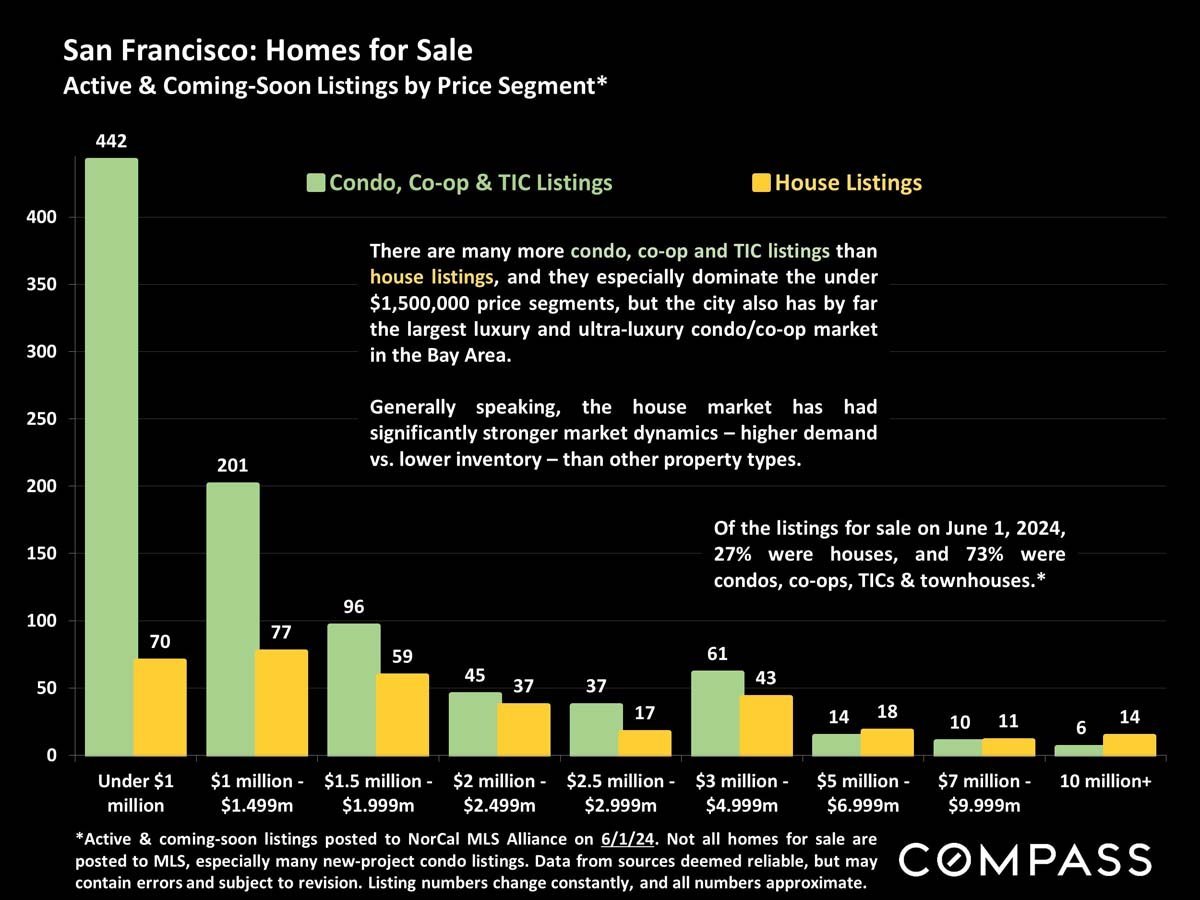
Chart comparing San Francisco house and condo listings by price segment, with condos leading most segments.
 
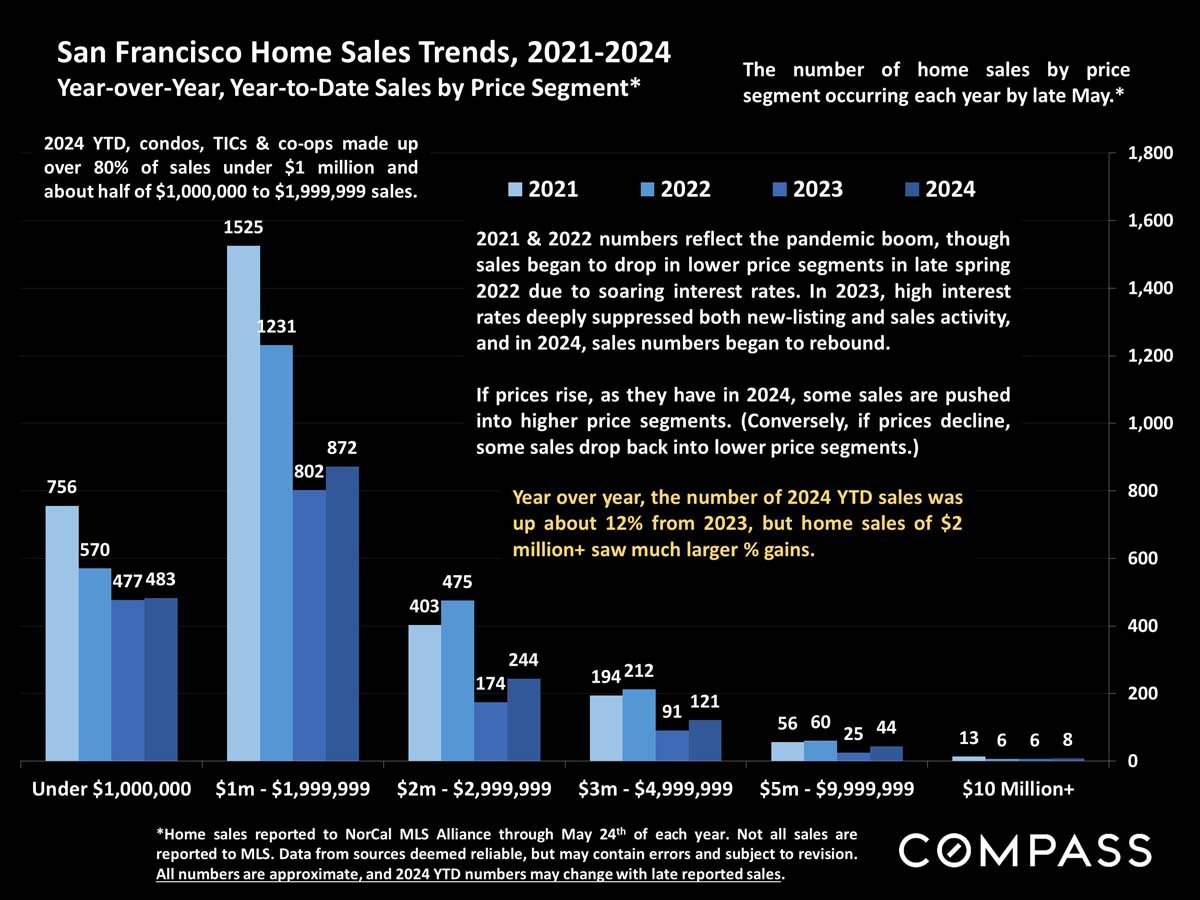
San Francisco home sales by price segment, with grouped bars comparing 2021–2024 year-to-date totals.
 
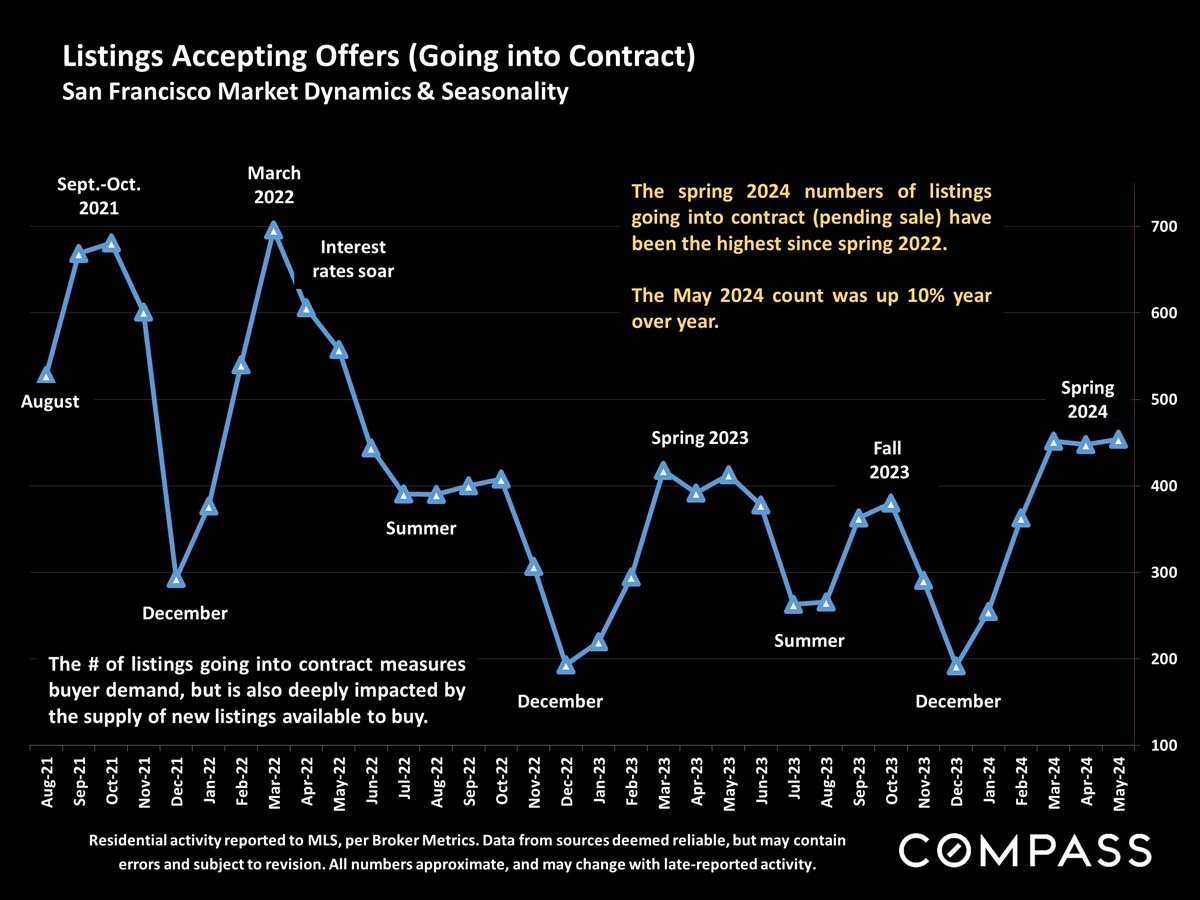
Chart of San Francisco listings entering contract, showing a spring 2024 high and a 10% year-over-year increase in May.
 
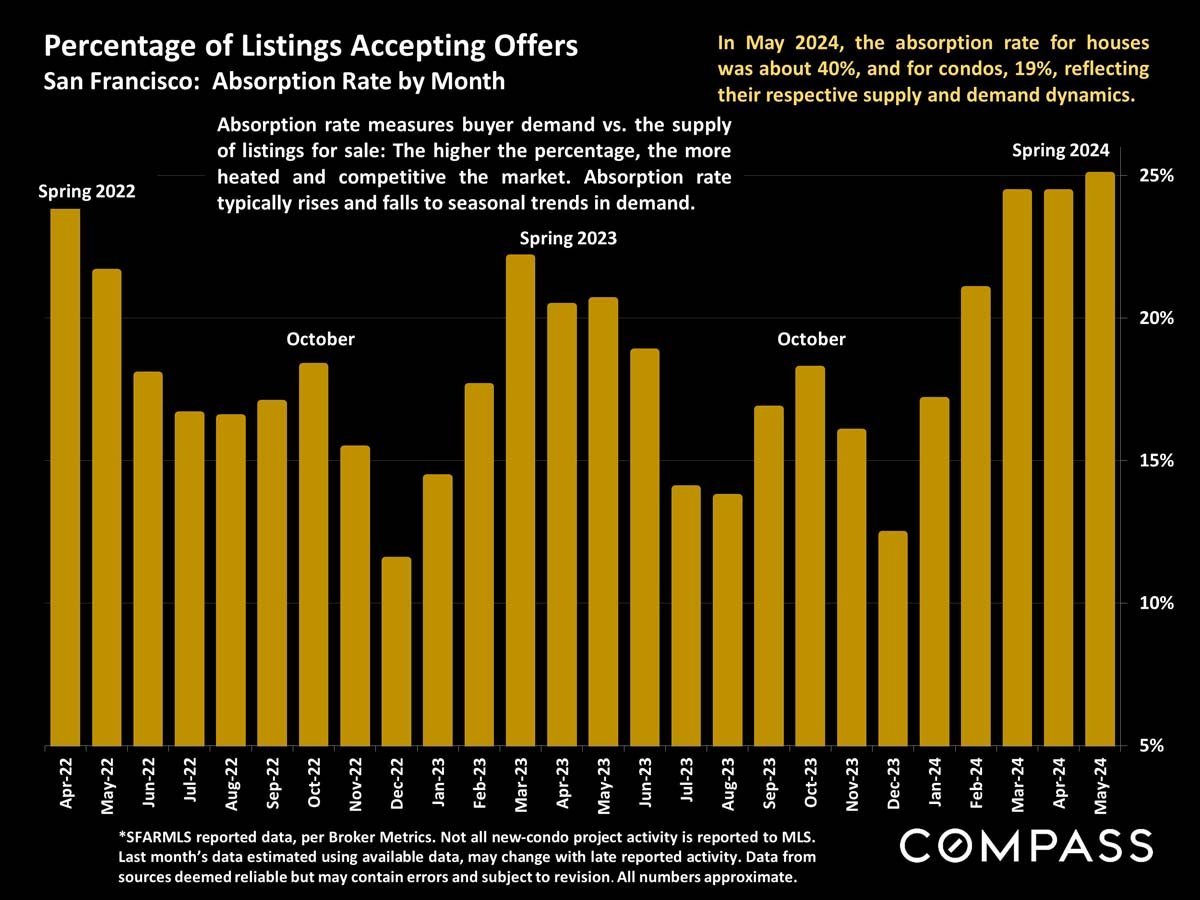
San Francisco monthly listing absorption rates, rising to about 25% in May 2024.
 
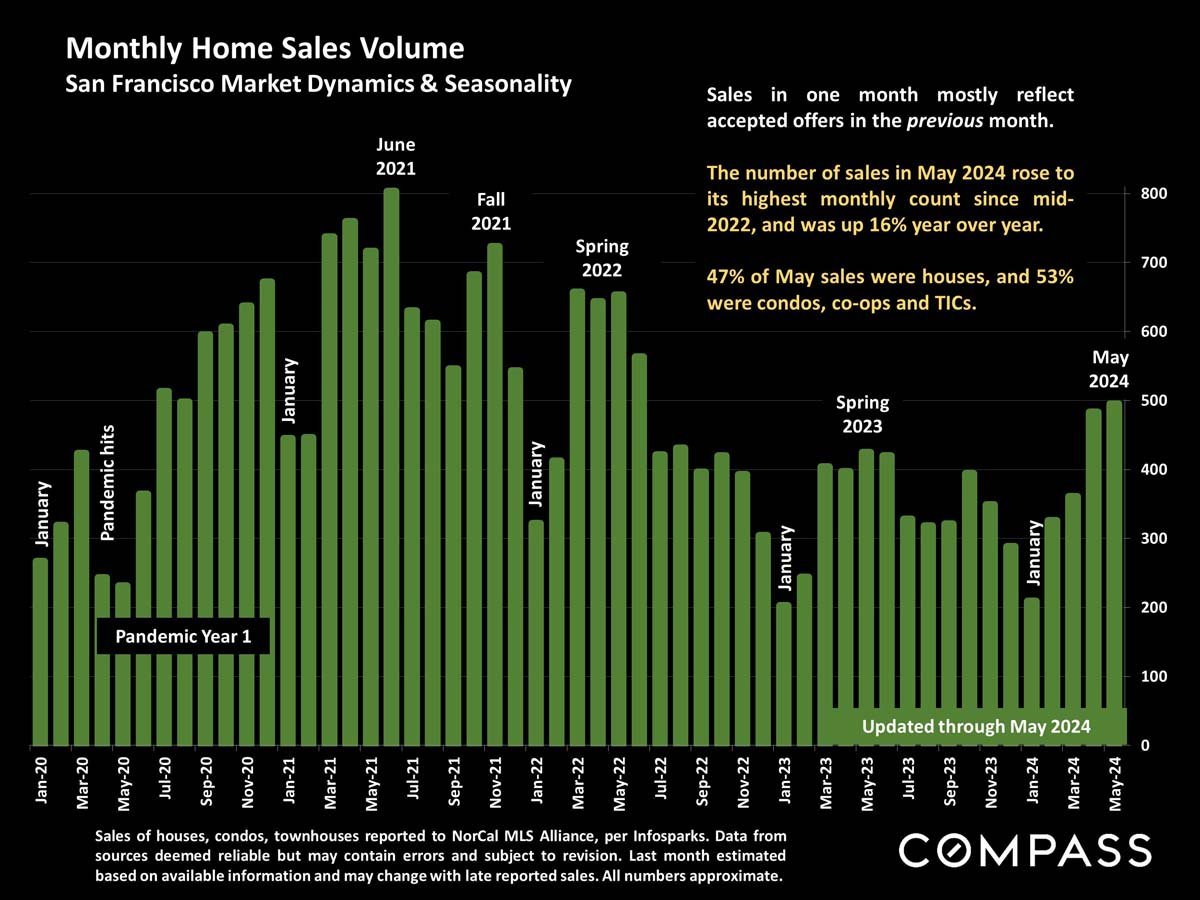
San Francisco monthly home sales volume chart, January 2020–May 2024, with May 2024 sales up 16% year over year.
 
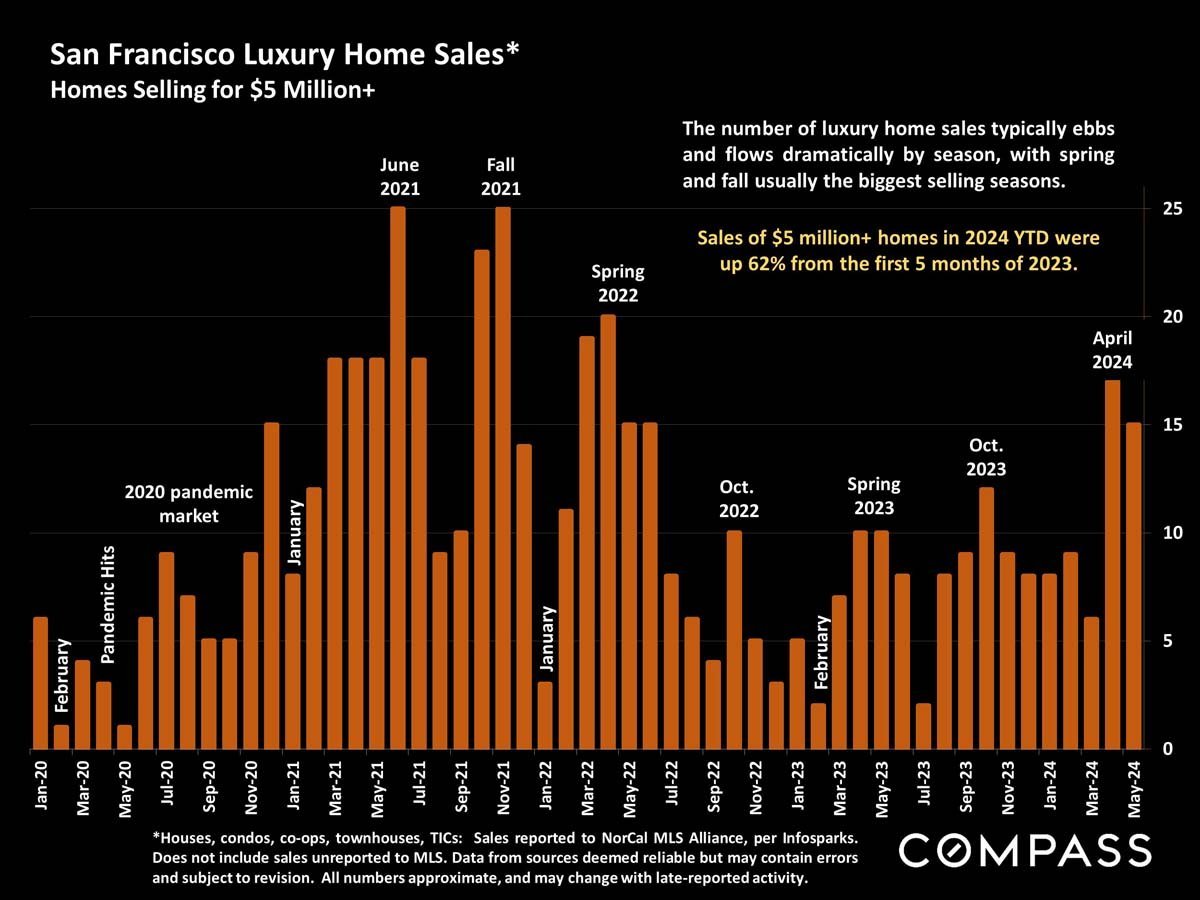
Chart of San Francisco sales of $5 million-plus homes, with monthly totals from 2020 to May 2024.
 
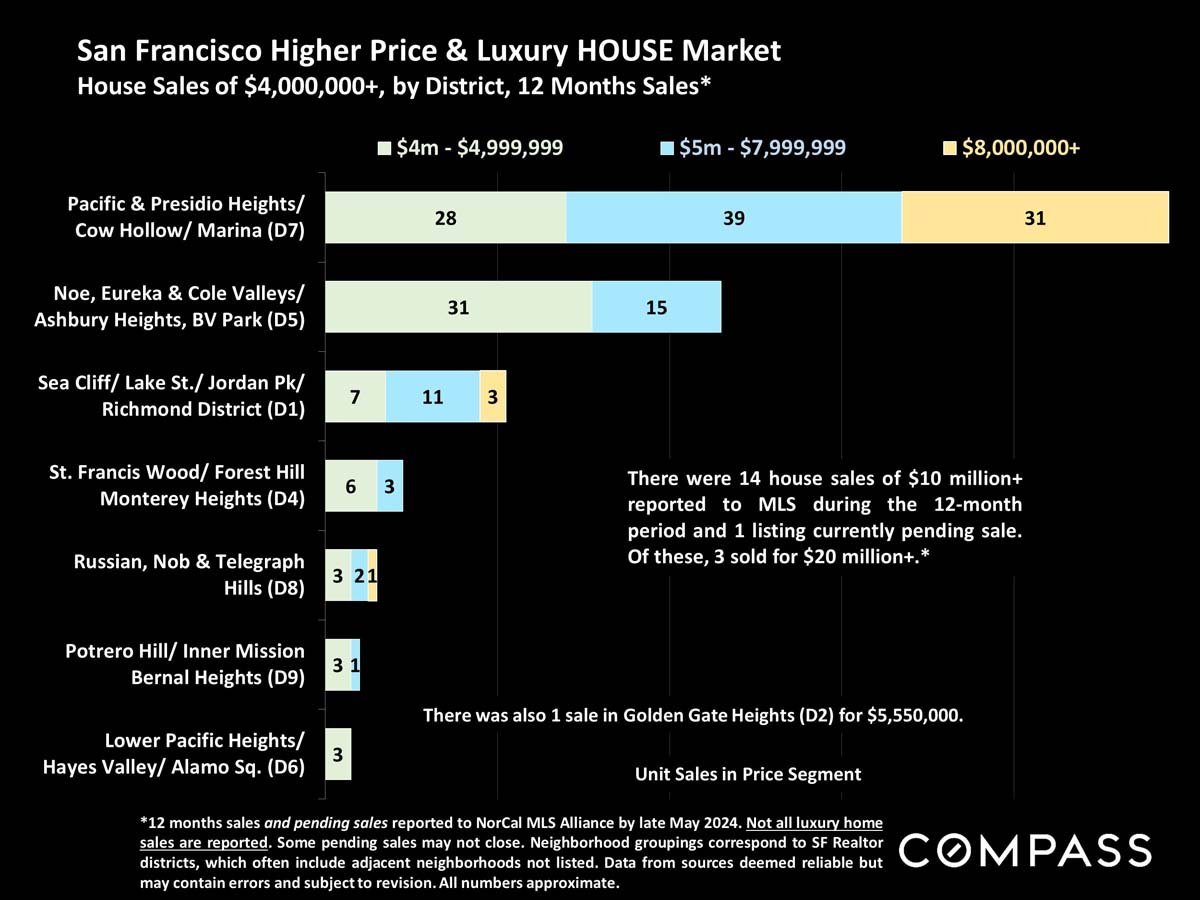
Chart of San Francisco luxury home sales by district and price segment, with Pacific Heights leading.
 
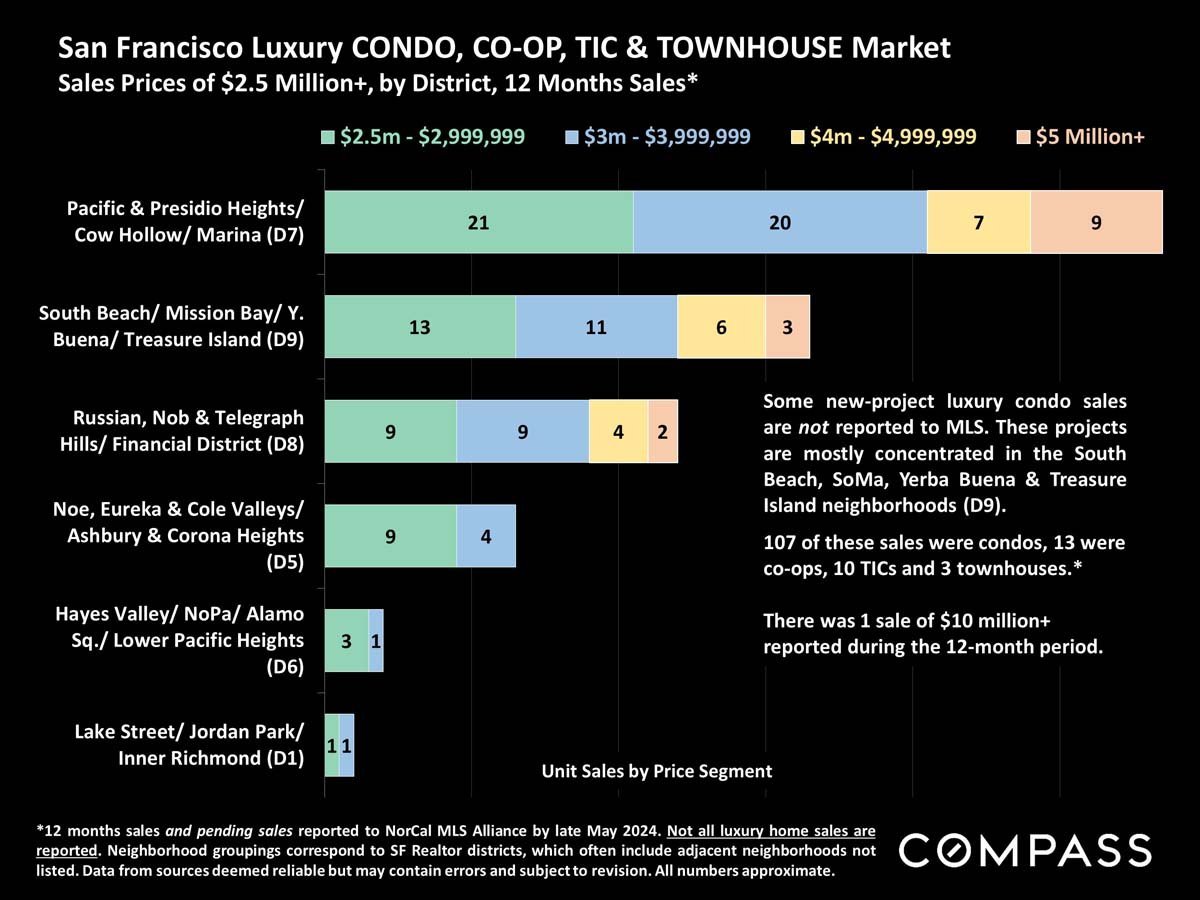
Chart of San Francisco luxury condo, co-op, TIC, and townhouse sales by district and price segment.
 
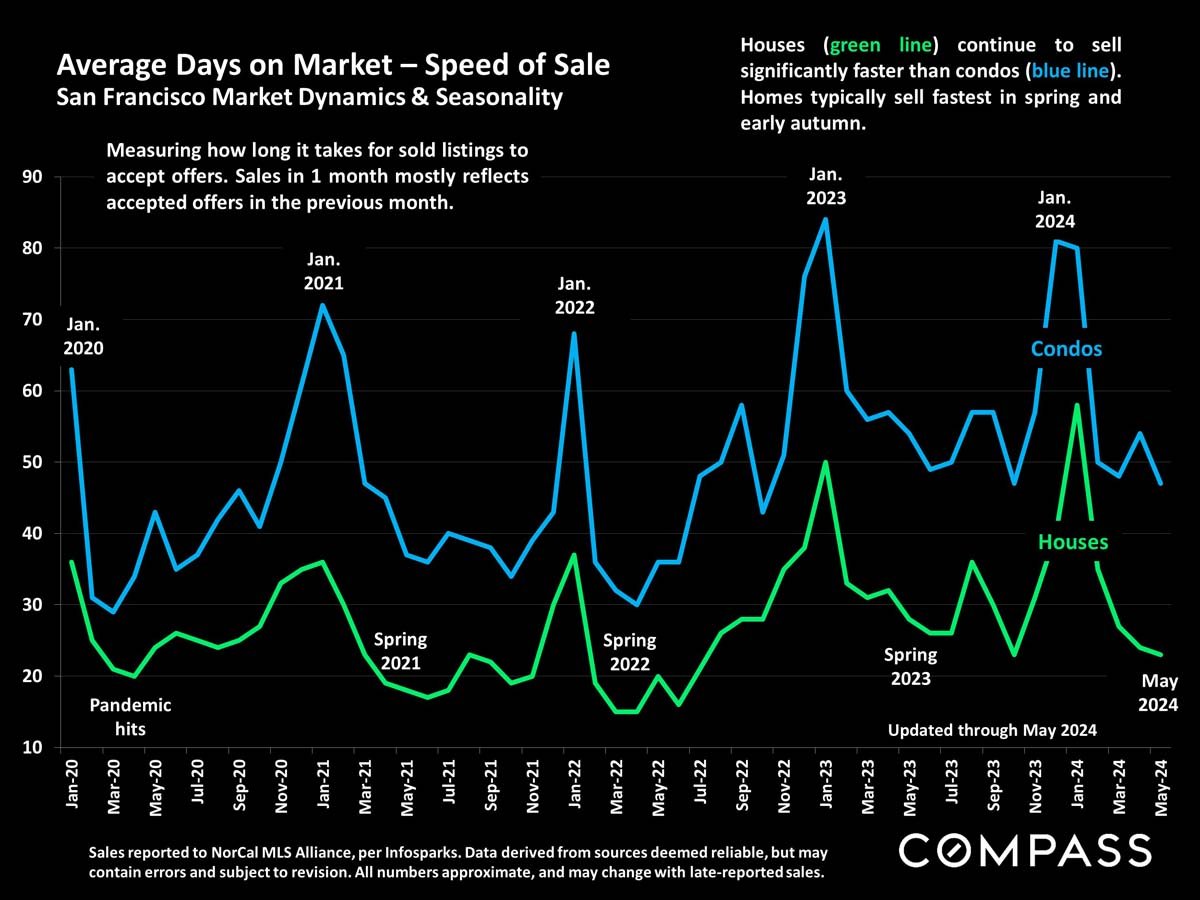
Line chart comparing average days on market for San Francisco houses and condos, January 2020–May 2024.
 
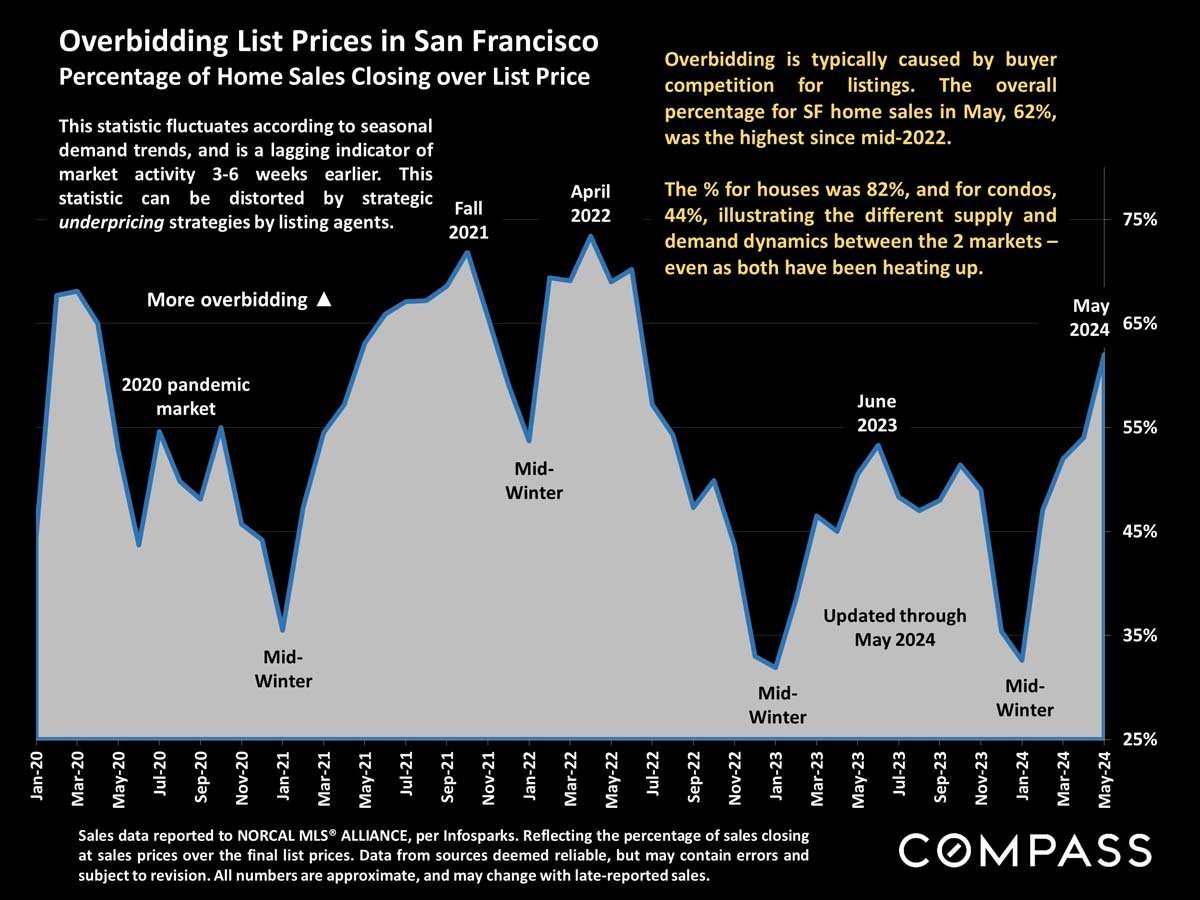
San Francisco overbidding chart, showing 62% of home sales closed over list price in May 2024.
 
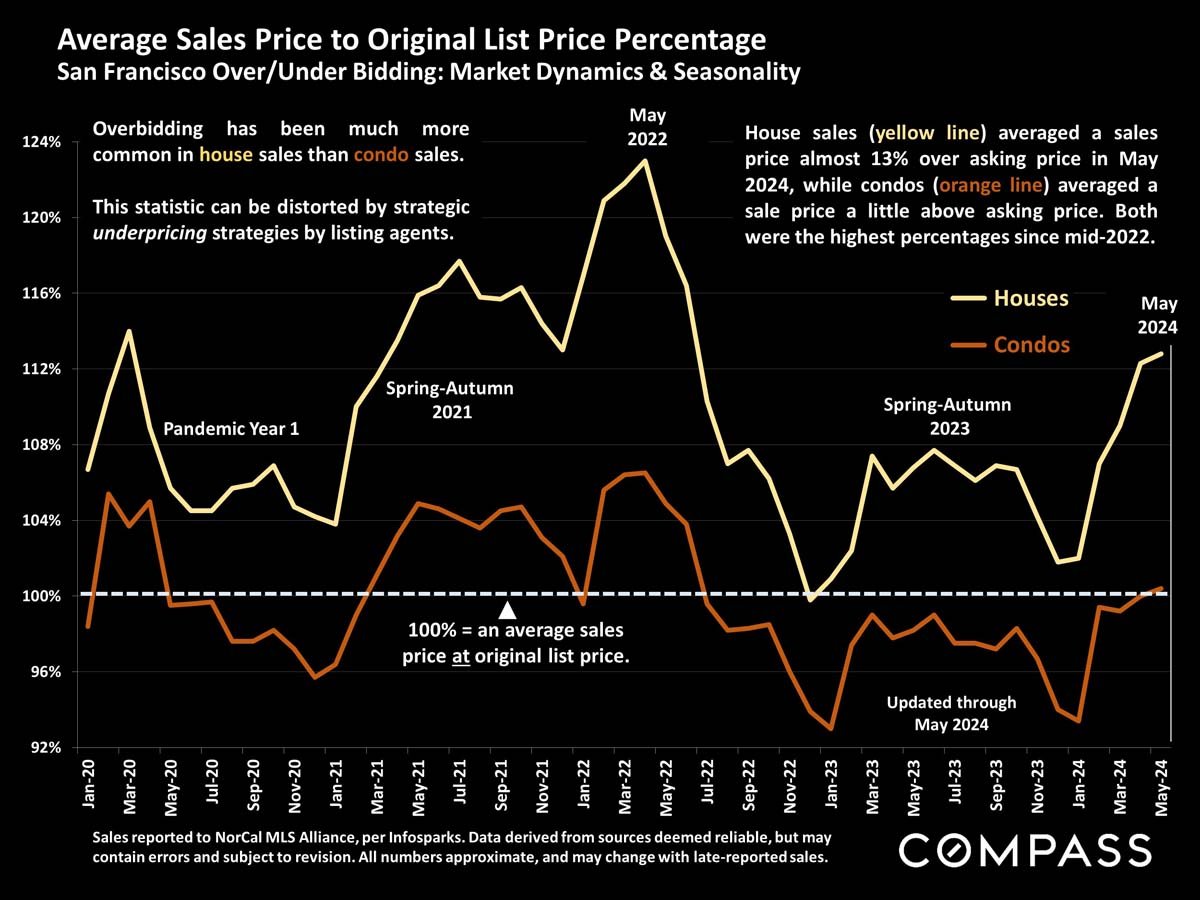
Chart compares San Francisco house and condo sale prices with original list prices, January 2020 to May 2024.
 
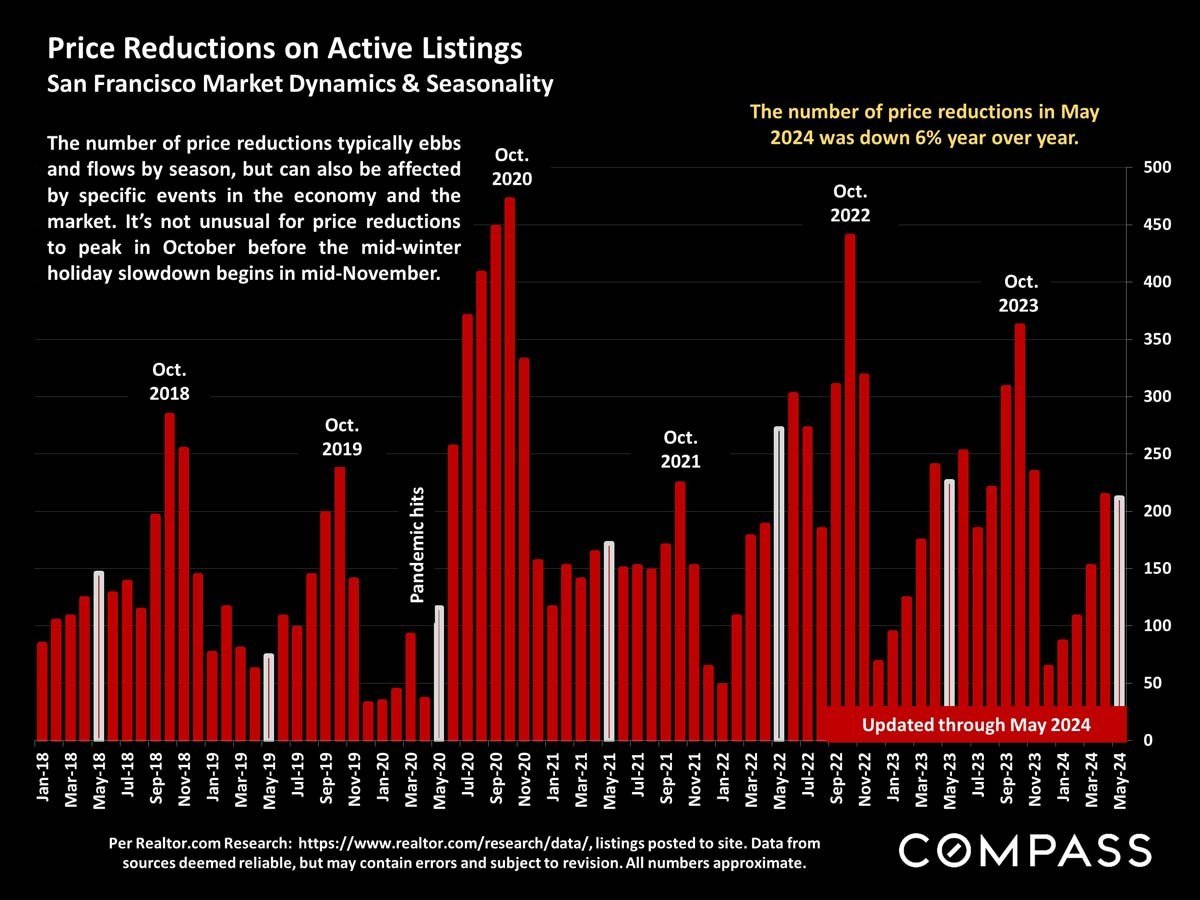
San Francisco price-reduction chart, showing monthly listing counts from 2018 through May 2024 and seasonal October peaks.
 
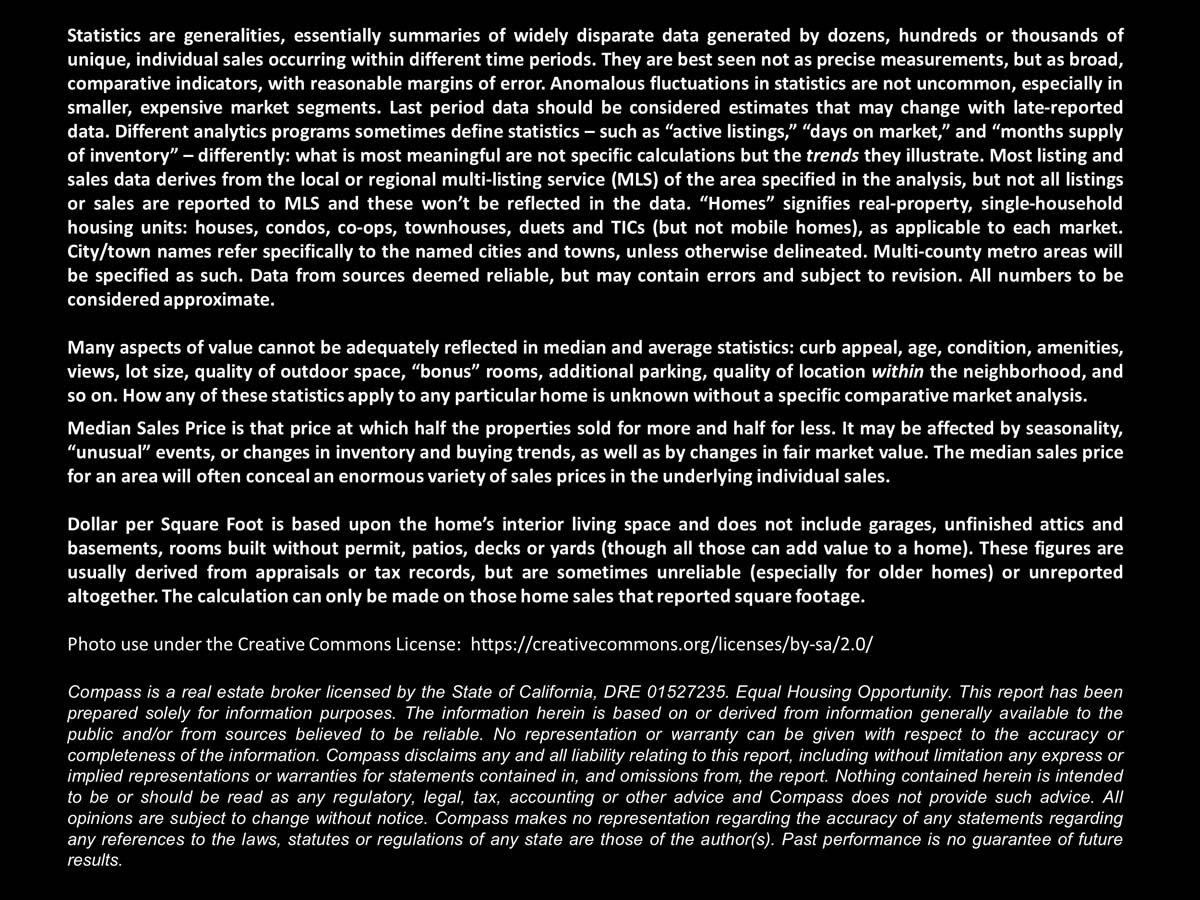
Market report notes explaining statistics, pricing measures, photo licensing, and Compass legal disclaimers.

Work With Jane

Get assistance in determining the current property value, crafting a competitive offer, writing and negotiating a contract, and much more. Contact me today.
Follow Me on Instagram