San Francisco real estate market report cover for June 2025, featuring a beach and Compass branding.

San Francisco Home Prices, Market Conditions & Trends June 2025

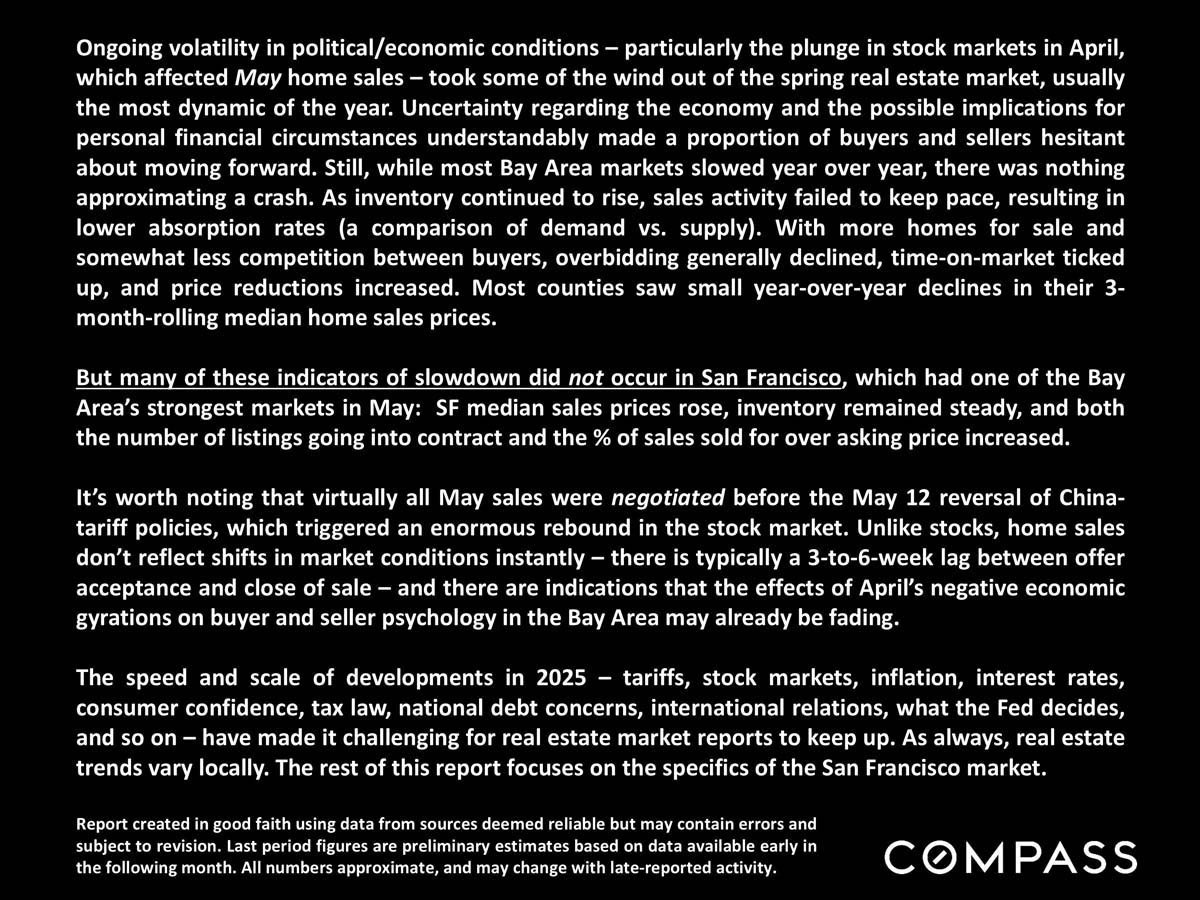
Ongoing volatility in political/economic conditions – particularly the plunge in stock markets in April, which affected May home sales – took some of the wind out of the spring real estate market, usually the most dynamic of the year.
 
San Francisco real estate report cover featuring a beach scene and Compass branding.
 
Text report describing May 2025 Bay Area housing trends and San Francisco’s stronger market.
 
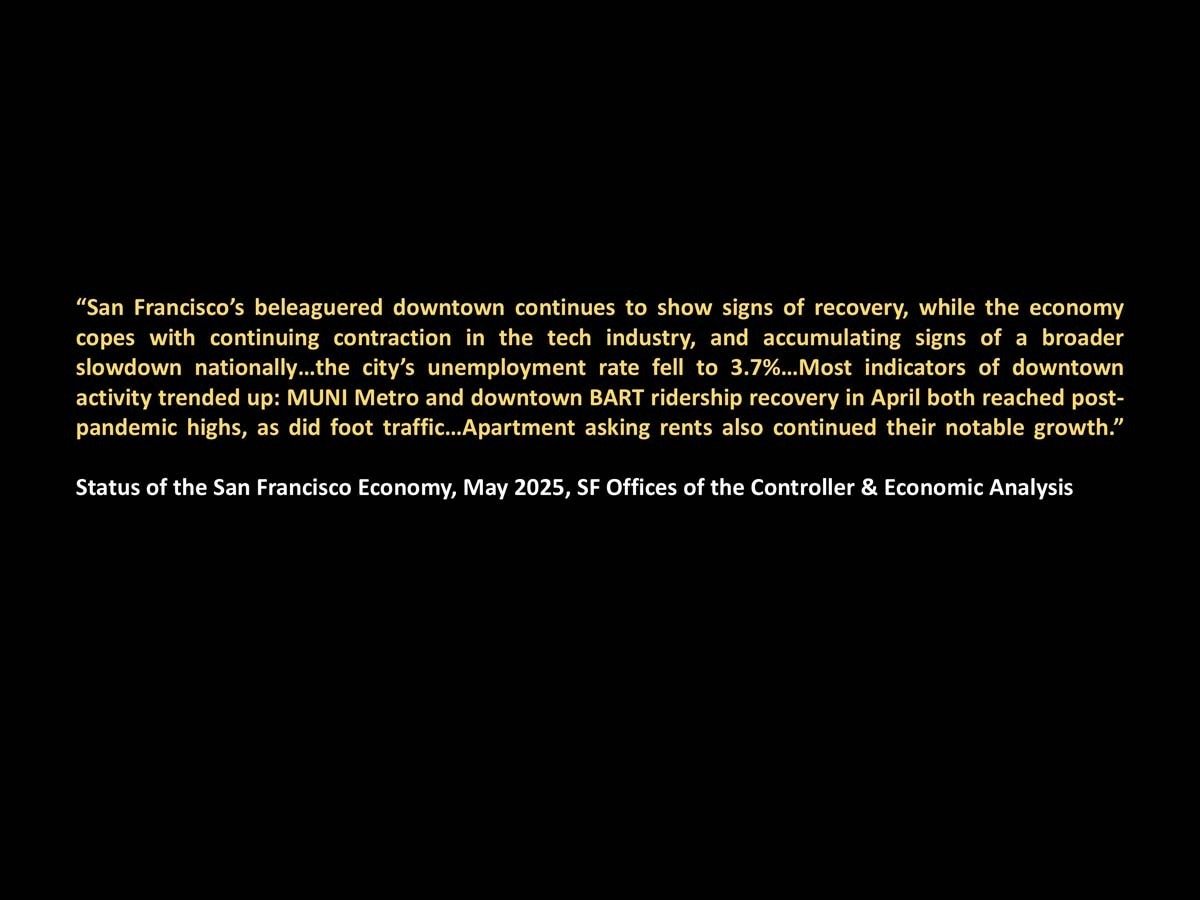
Quote on San Francisco downtown’s economic recovery, citing the May 2025 city economy report.
 
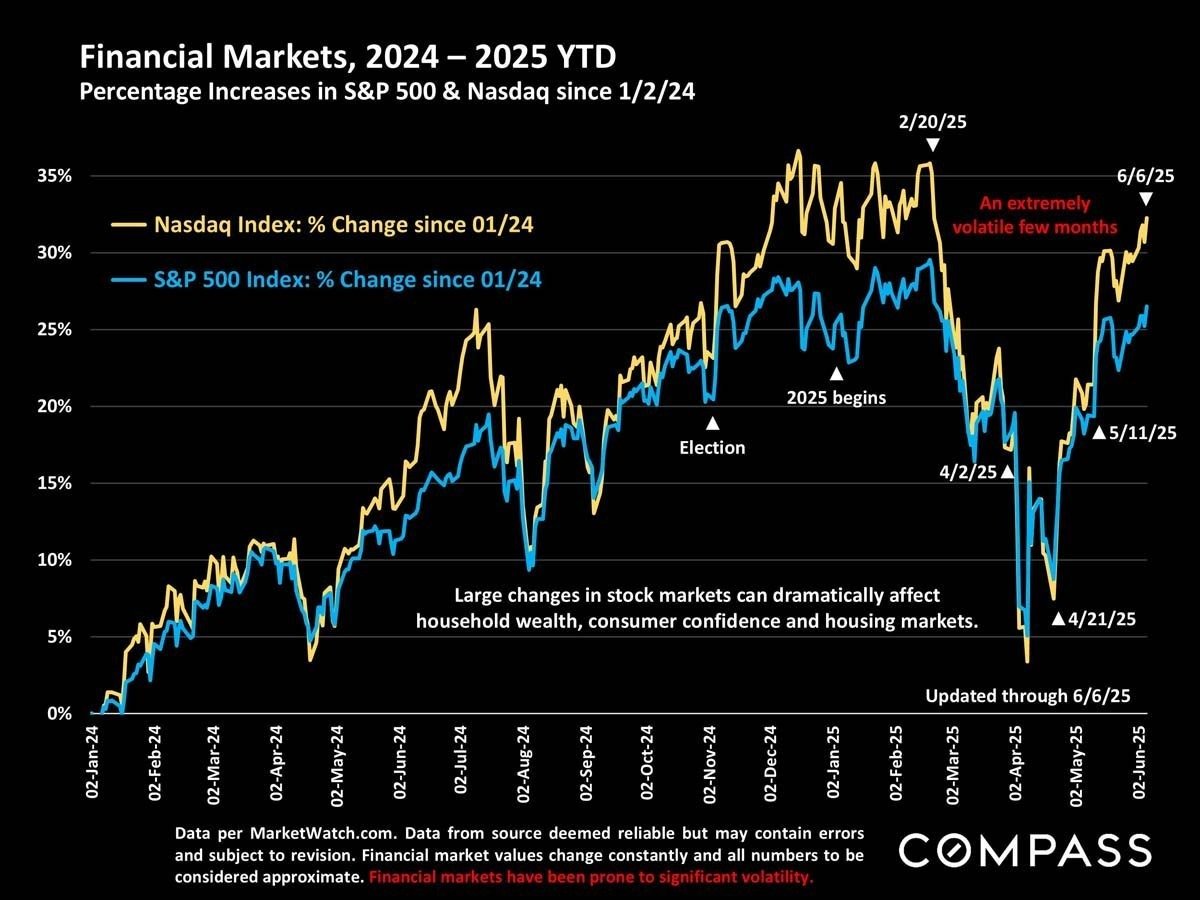
Chart comparing Nasdaq and S&P 500 gains from January 2024 through June 6, 2025, with sharp spring volatility.
 
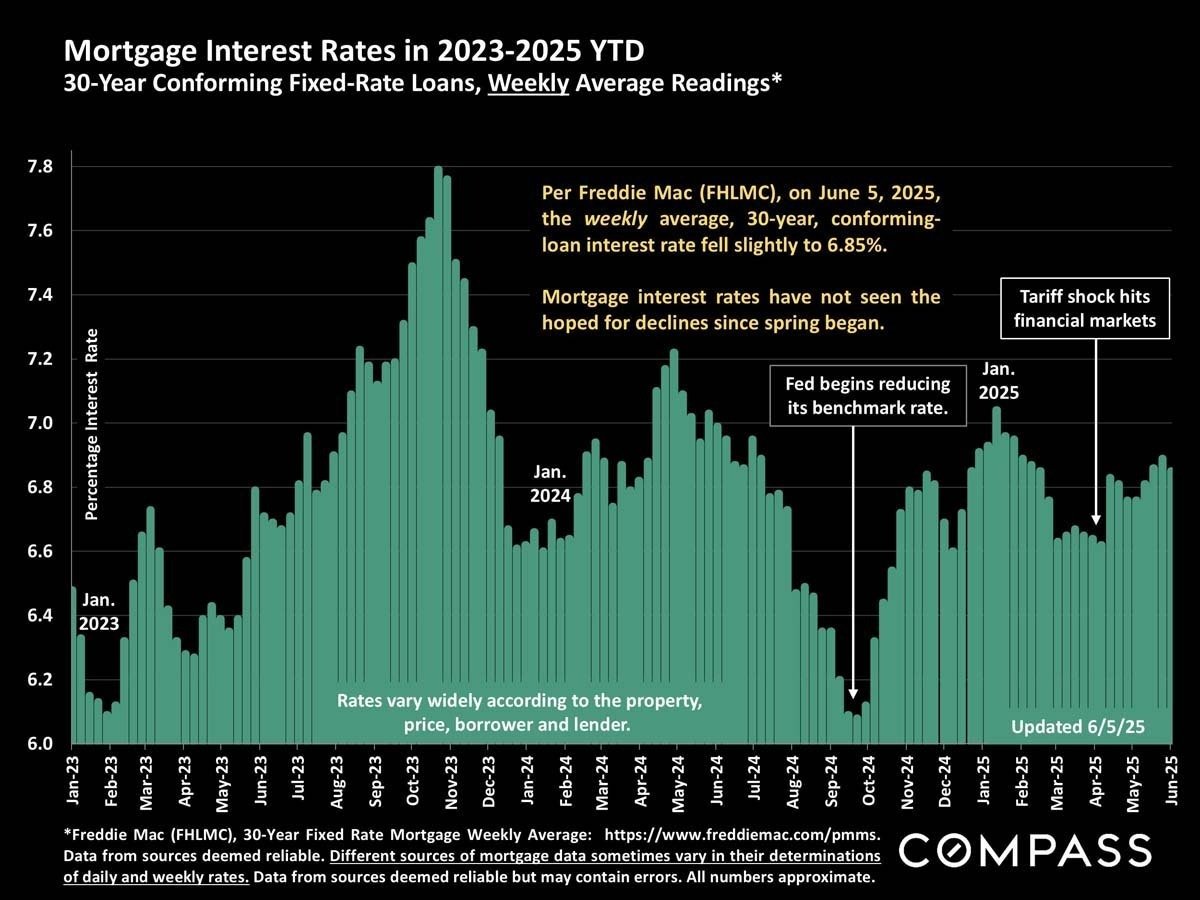
Chart of weekly 30-year fixed mortgage rates from 2023 to June 2025, with market event annotations.
 
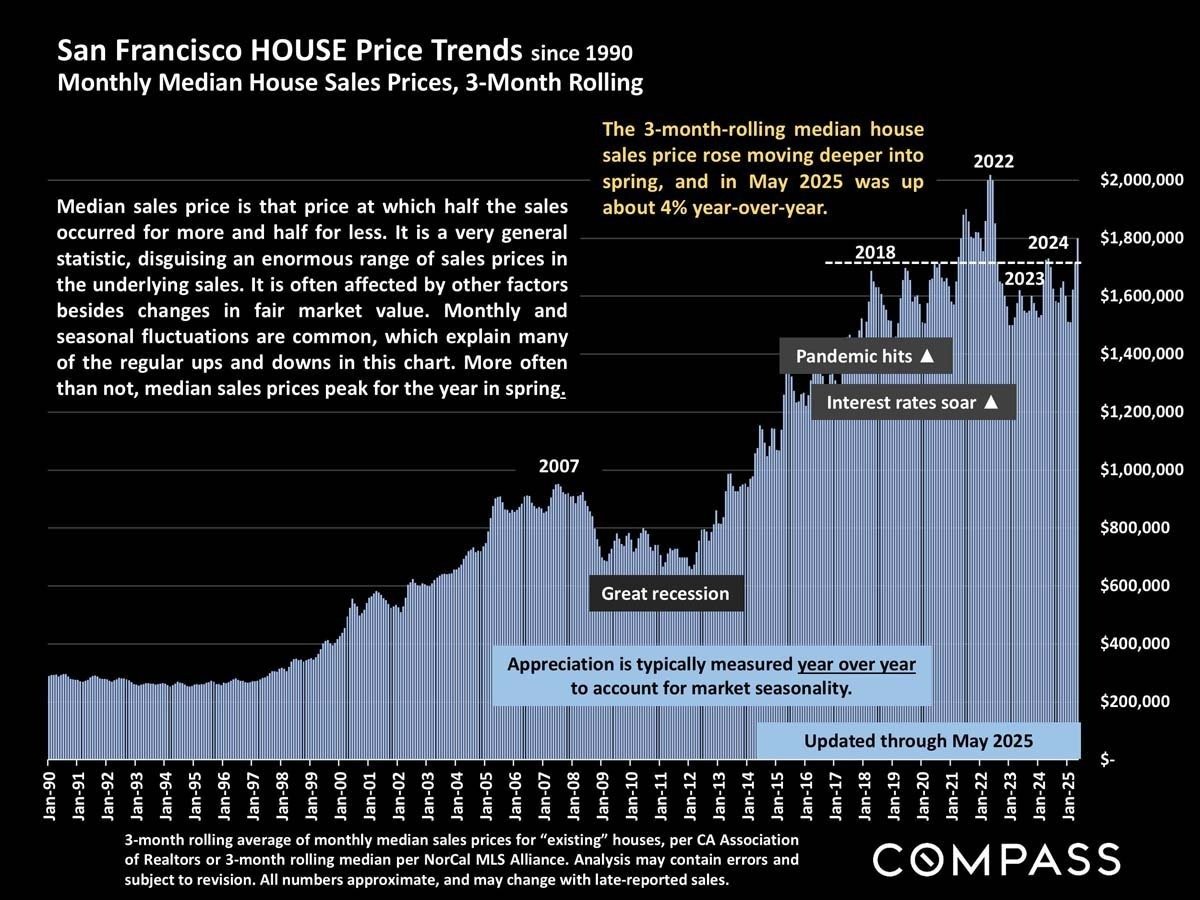
Chart of San Francisco median house prices since 1990, peaking near $2 million in 2022.
 
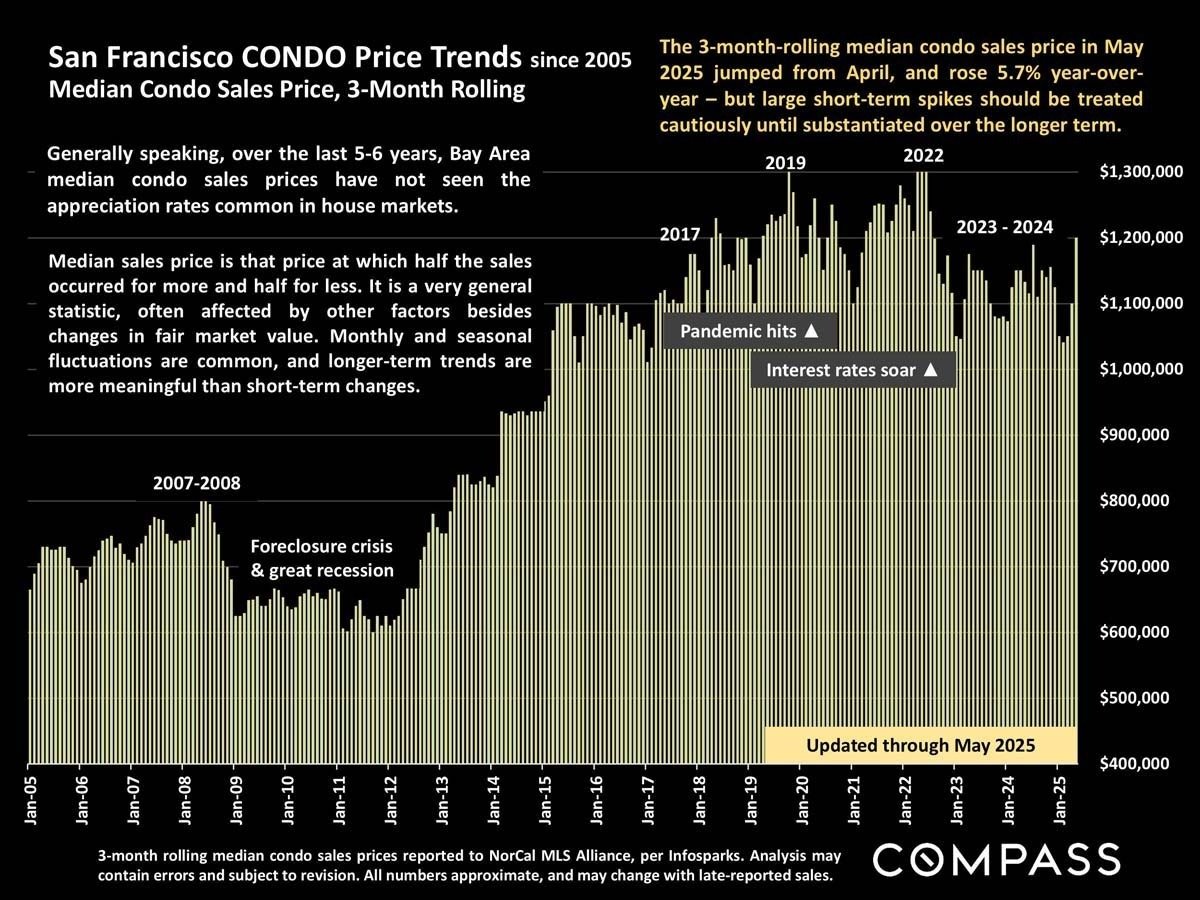
Chart of San Francisco condo price trends since 2005, with a May 2025 update and historical market annotations.
 
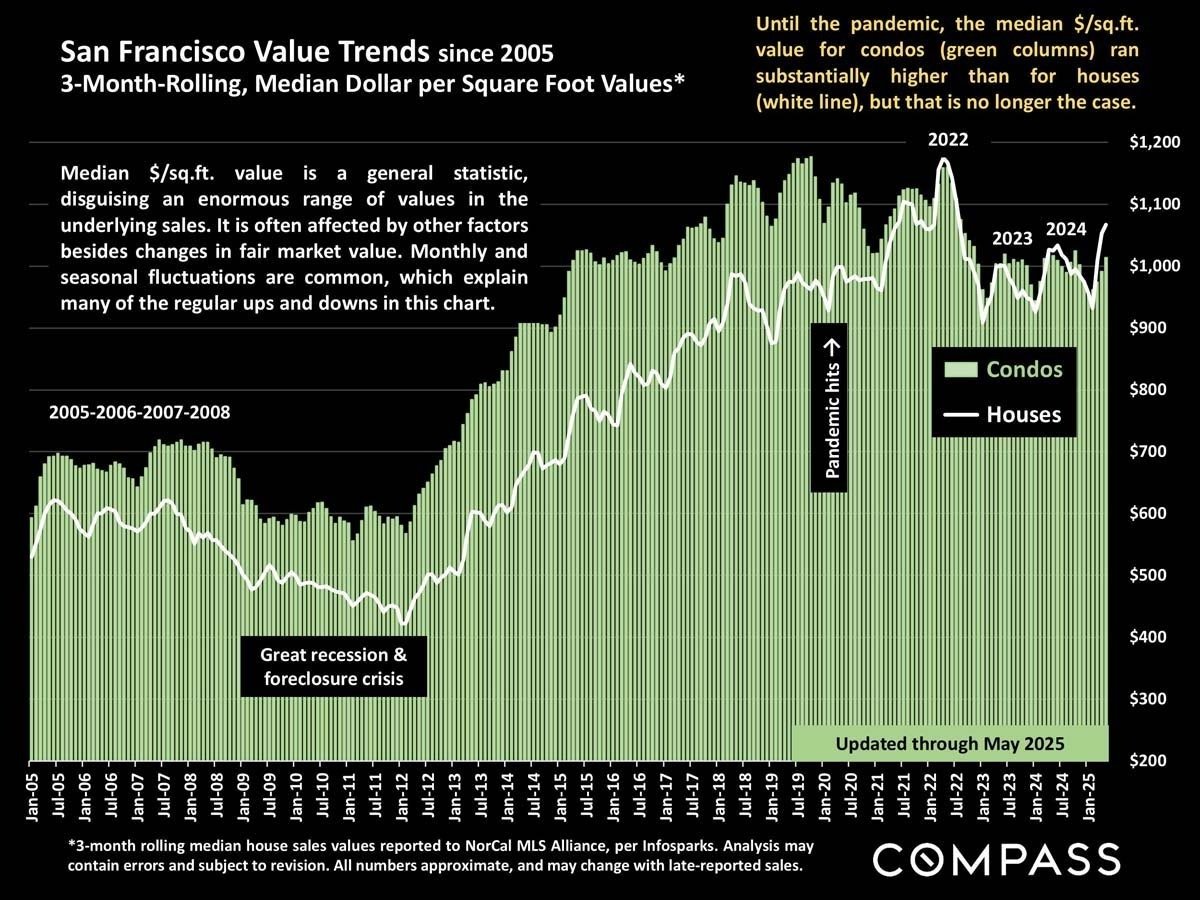
Chart comparing San Francisco condo and house median prices per square foot from 2005 to 2025.
 
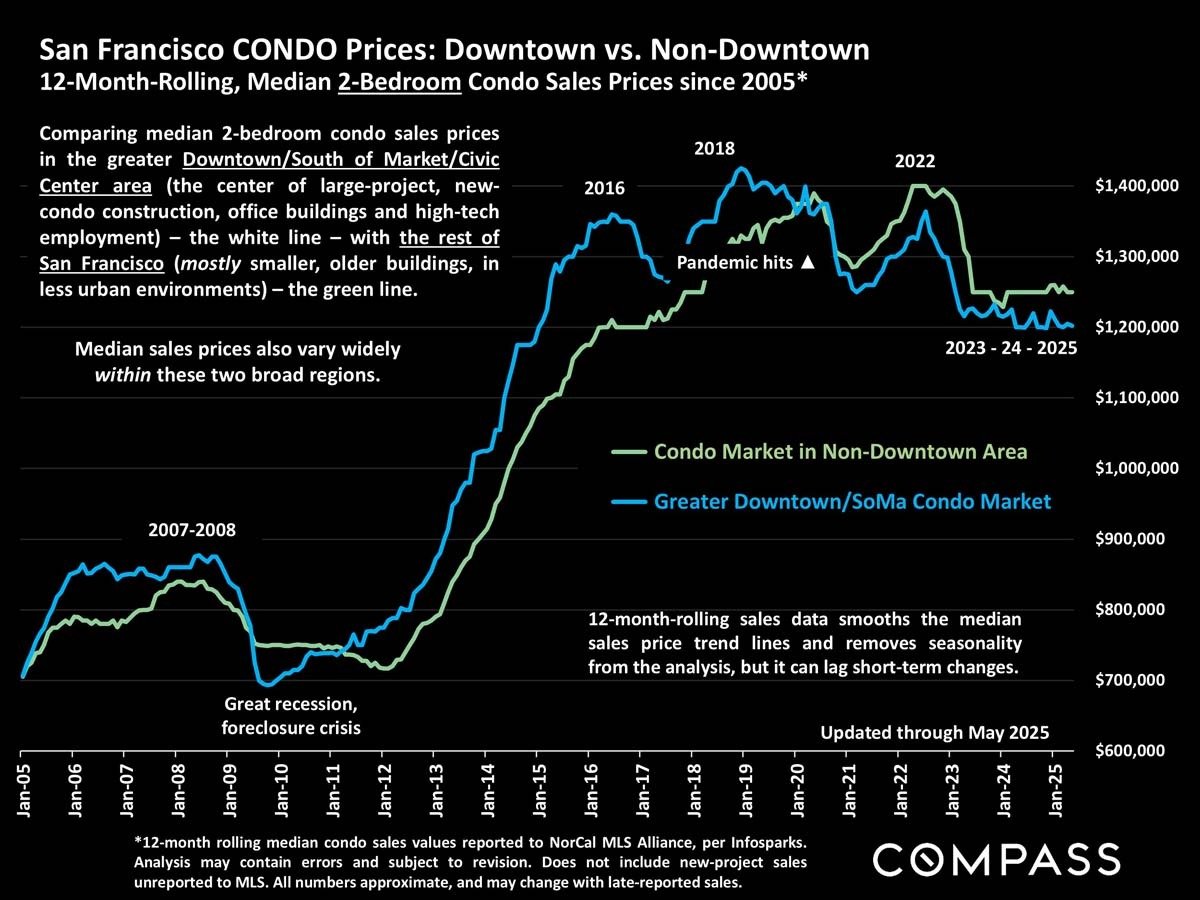
Line chart compares downtown and non-downtown San Francisco two-bedroom condo prices from 2005 to 2025.
 
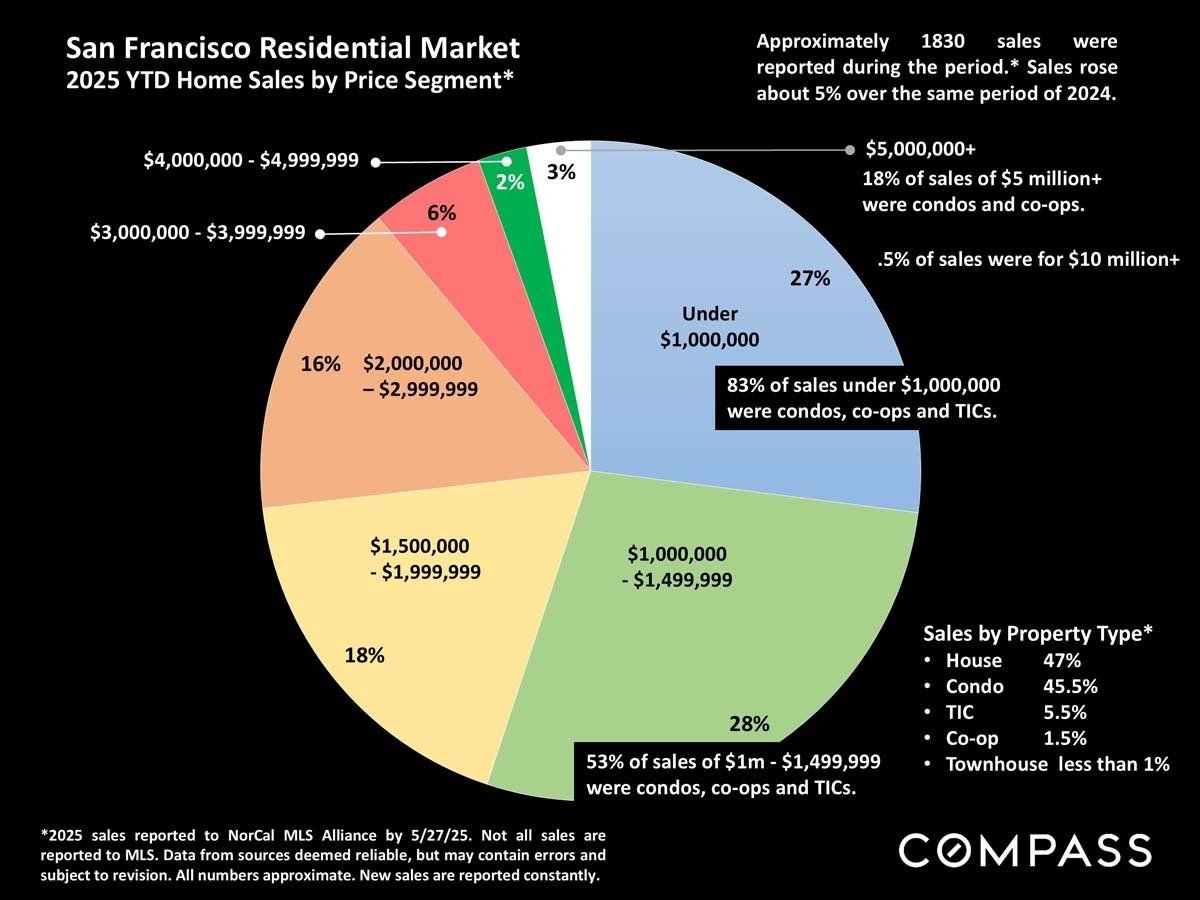
San Francisco 2025 home sales chart by price segment, with notes on property types and sales volume.
 
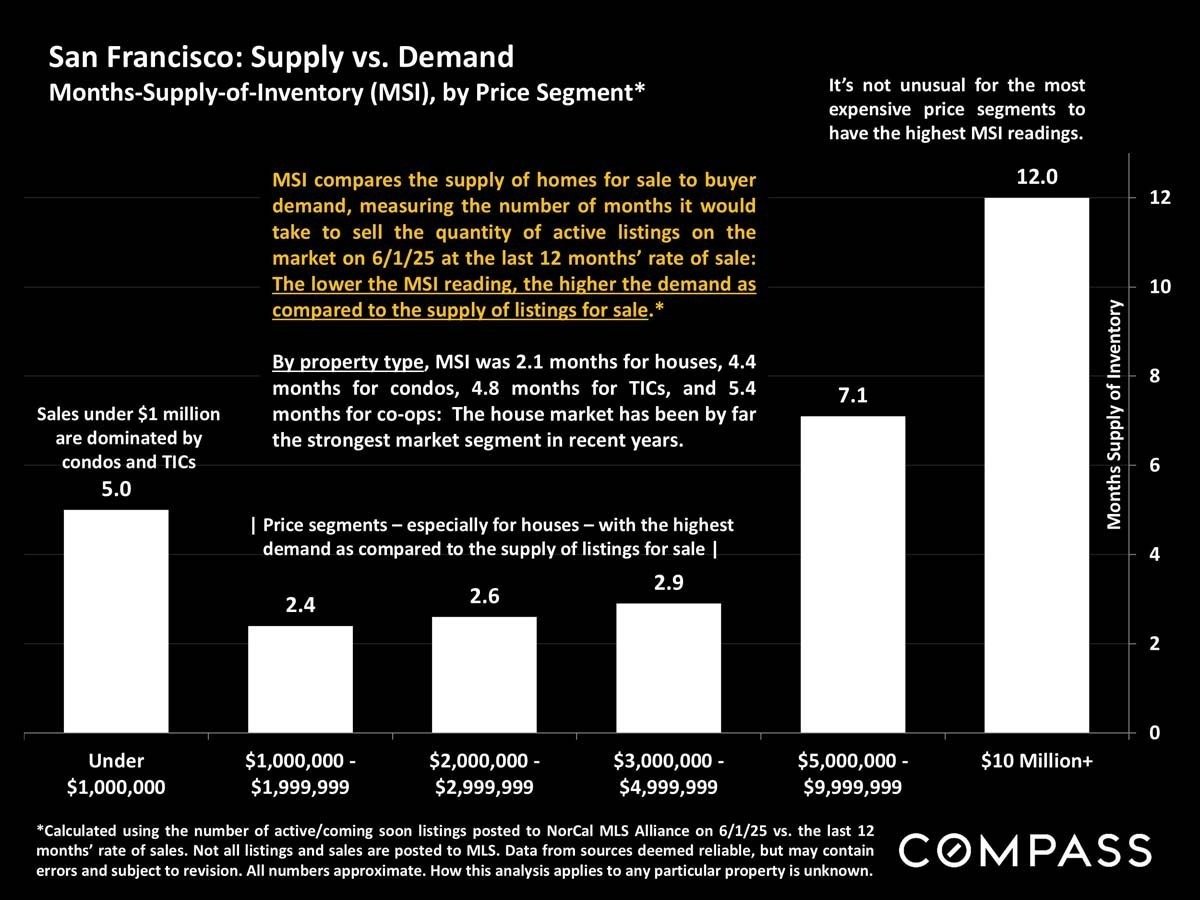
San Francisco housing inventory chart by price segment, showing the highest supply at $10 million and above.
 
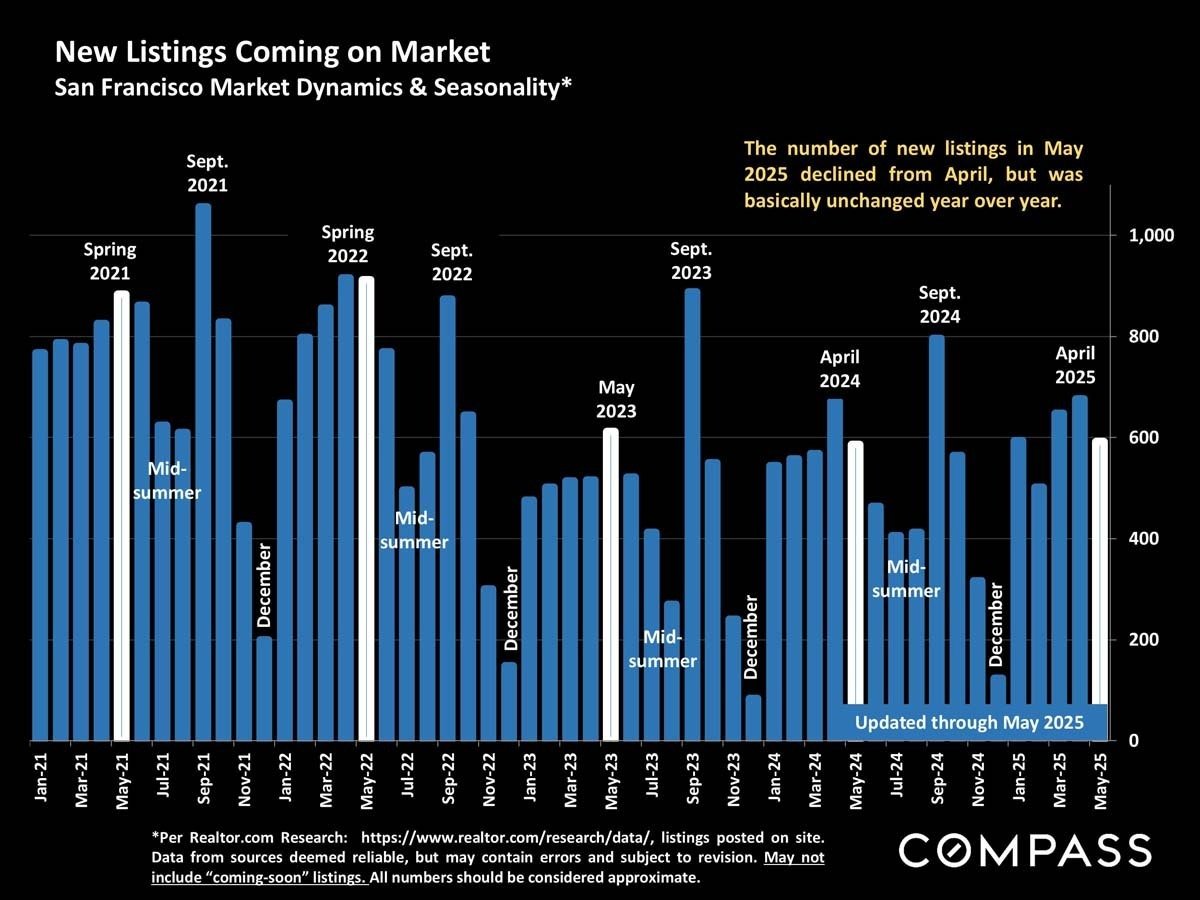
San Francisco monthly new listings chart, January 2021–May 2025, showing seasonal peaks and troughs.
 
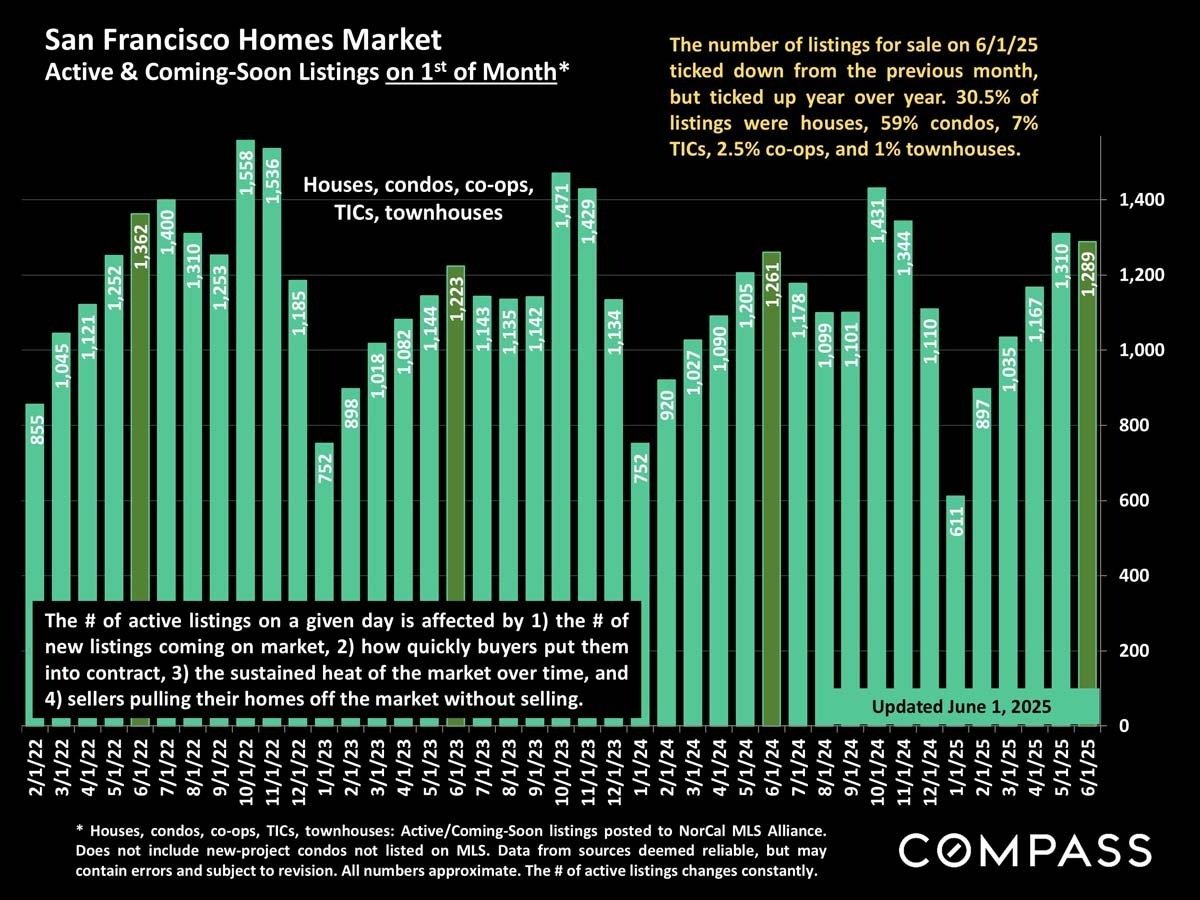
Bar chart tracking San Francisco active and coming-soon home listings monthly from January 2022 to June 2025.
 
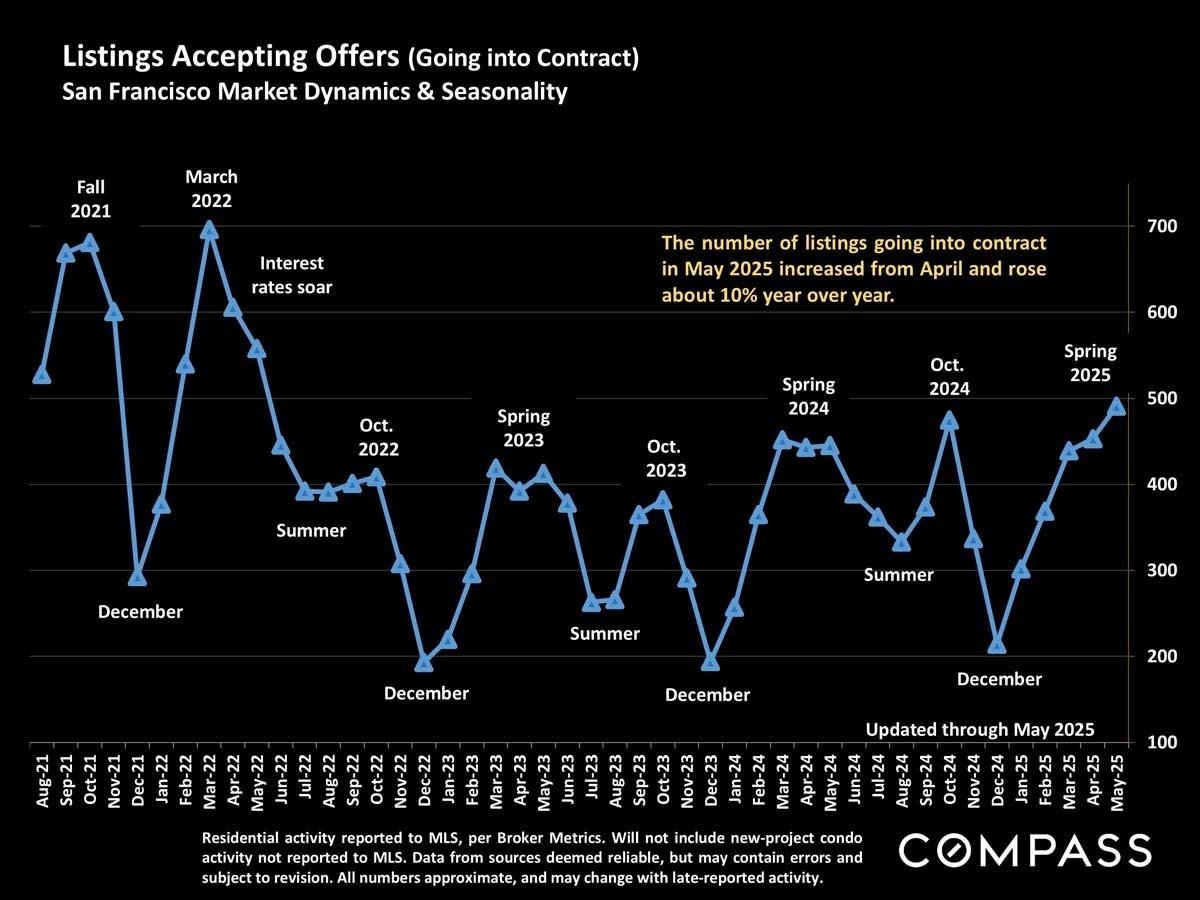
Chart of San Francisco listings entering contract monthly from August 2021 to May 2025, showing seasonal peaks and dips.
 
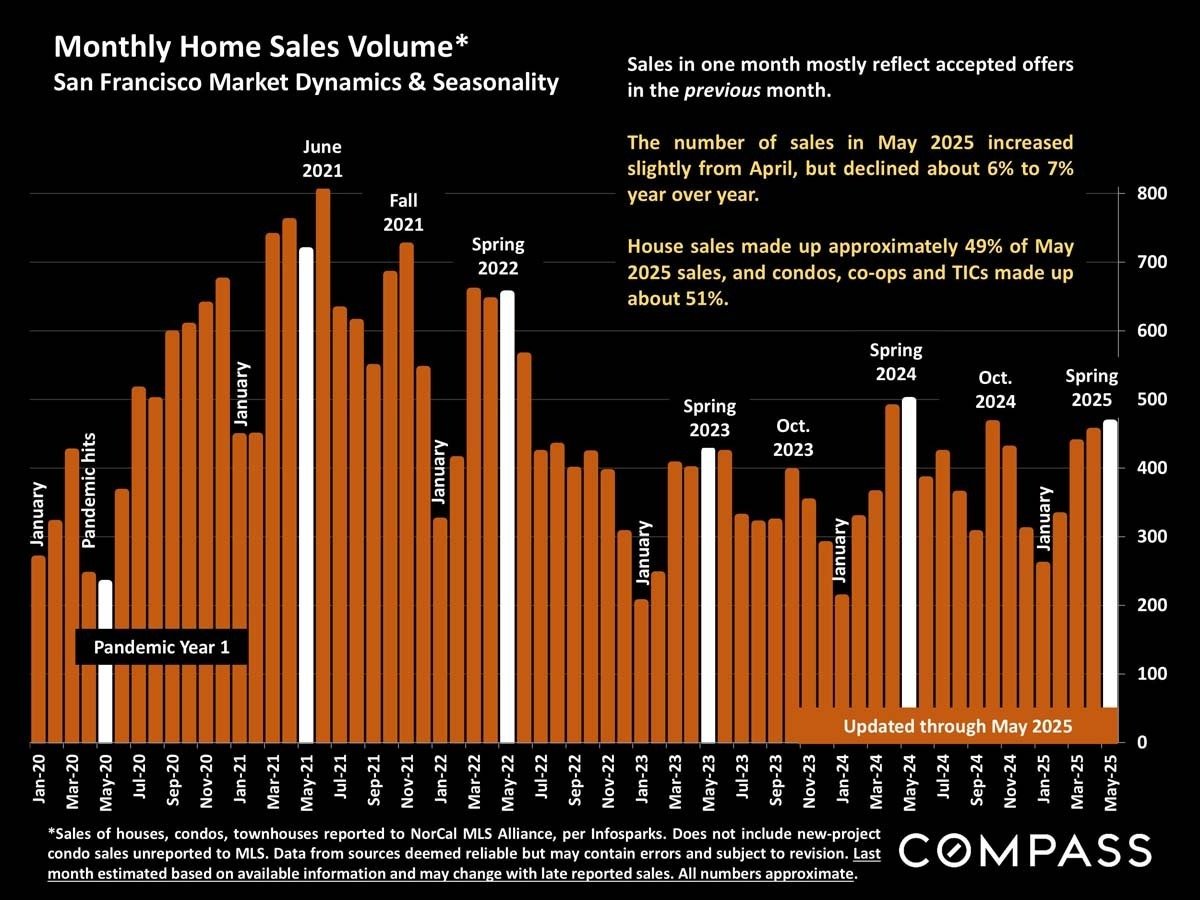
Bar chart of San Francisco monthly home sales, January 2020–May 2025, with seasonal peaks and May 2025 sales notes.
 
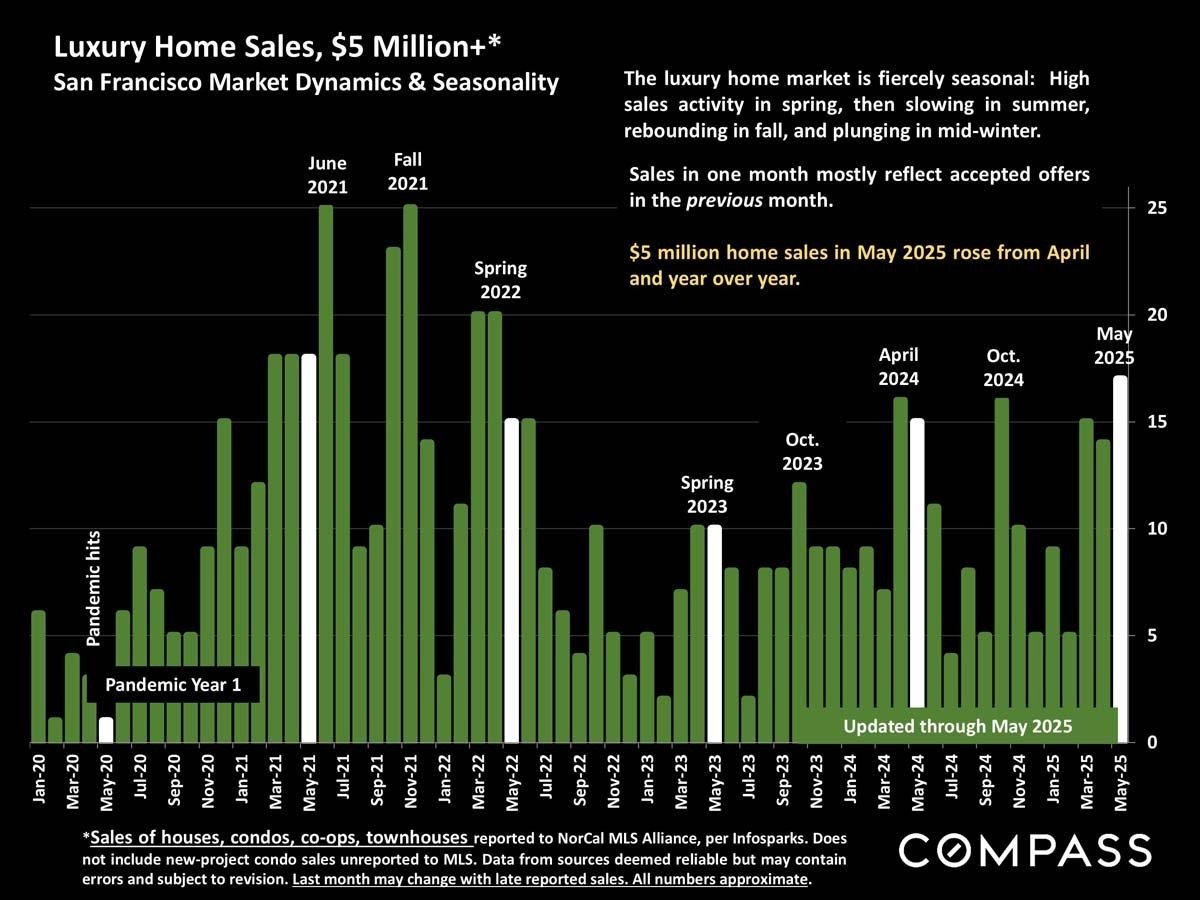
Chart of San Francisco luxury home sales from 2020 to May 2025, with seasonal peaks and a May 2025 increase.
 
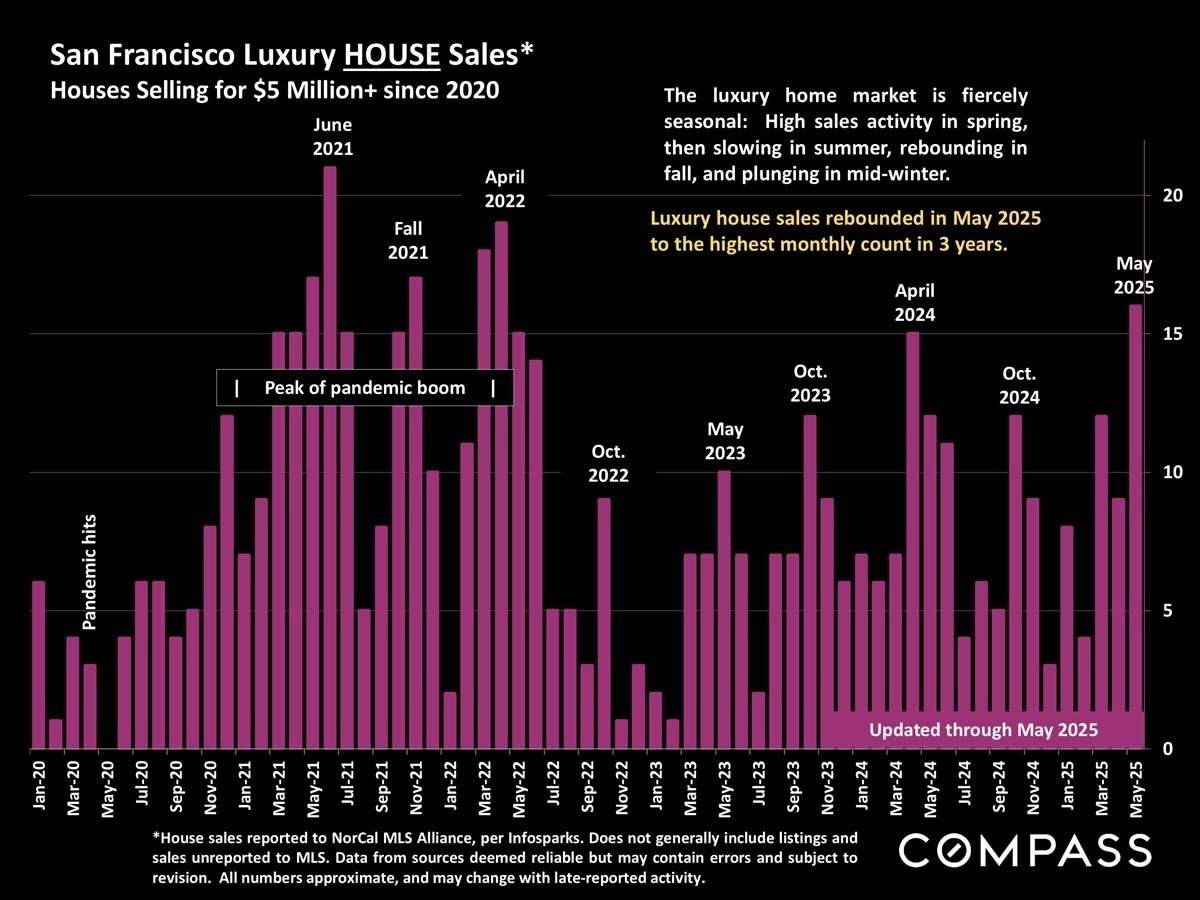
Bar chart of San Francisco luxury home sales, with monthly $5 million-plus sales through May 2025.
 
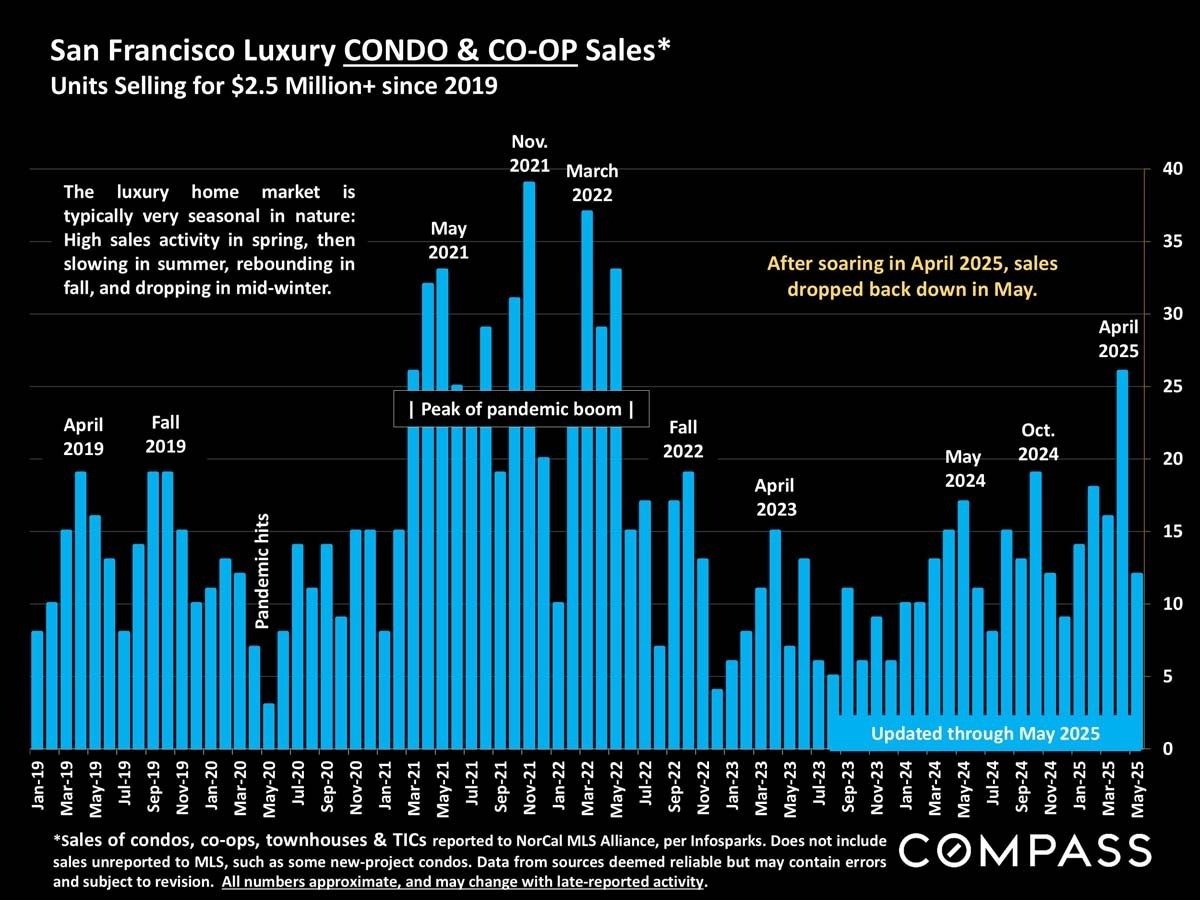
Bar chart of San Francisco luxury condo and co-op sales since 2019, highlighting the April 2025 peak and May decline.
 
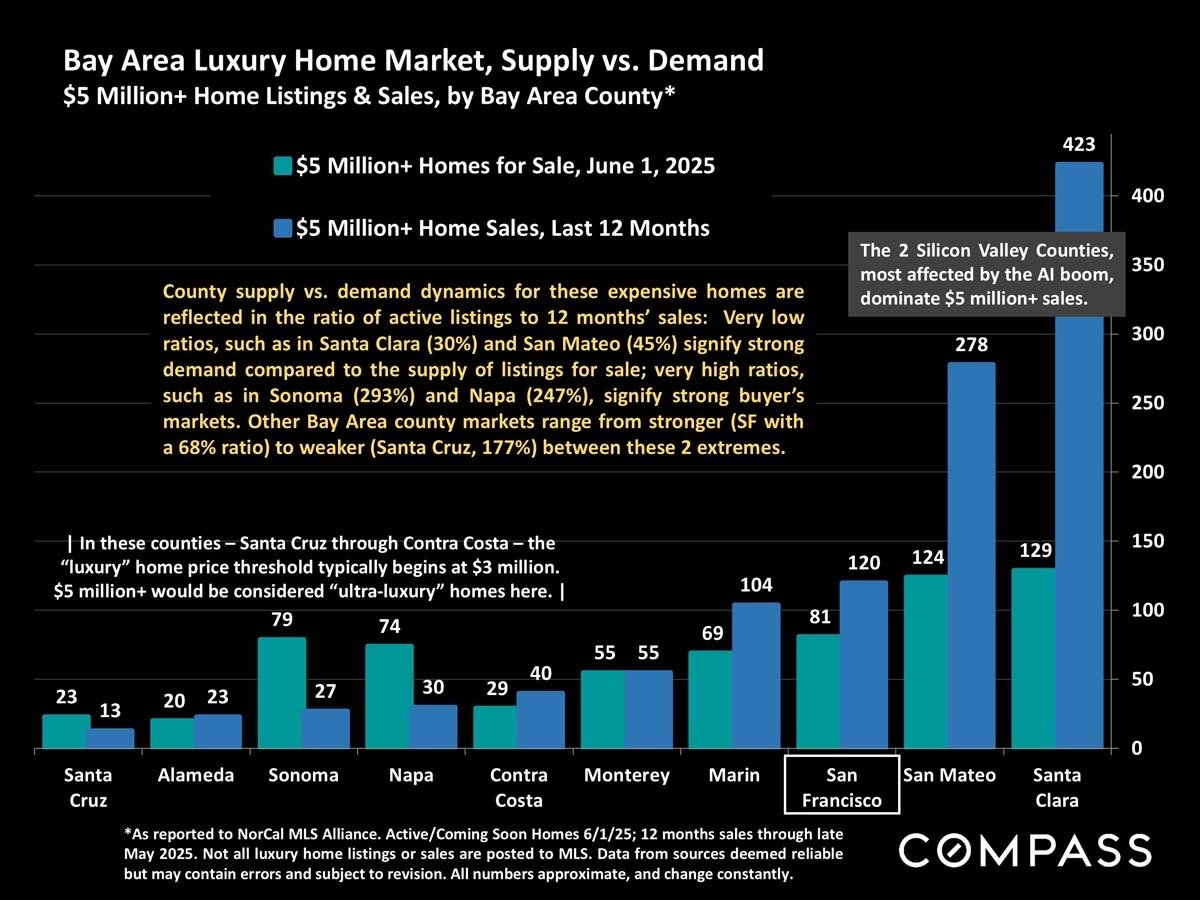
Bar chart comparing $5 million-plus home listings and sales across Bay Area counties, with Santa Clara and San Mateo leading.
 
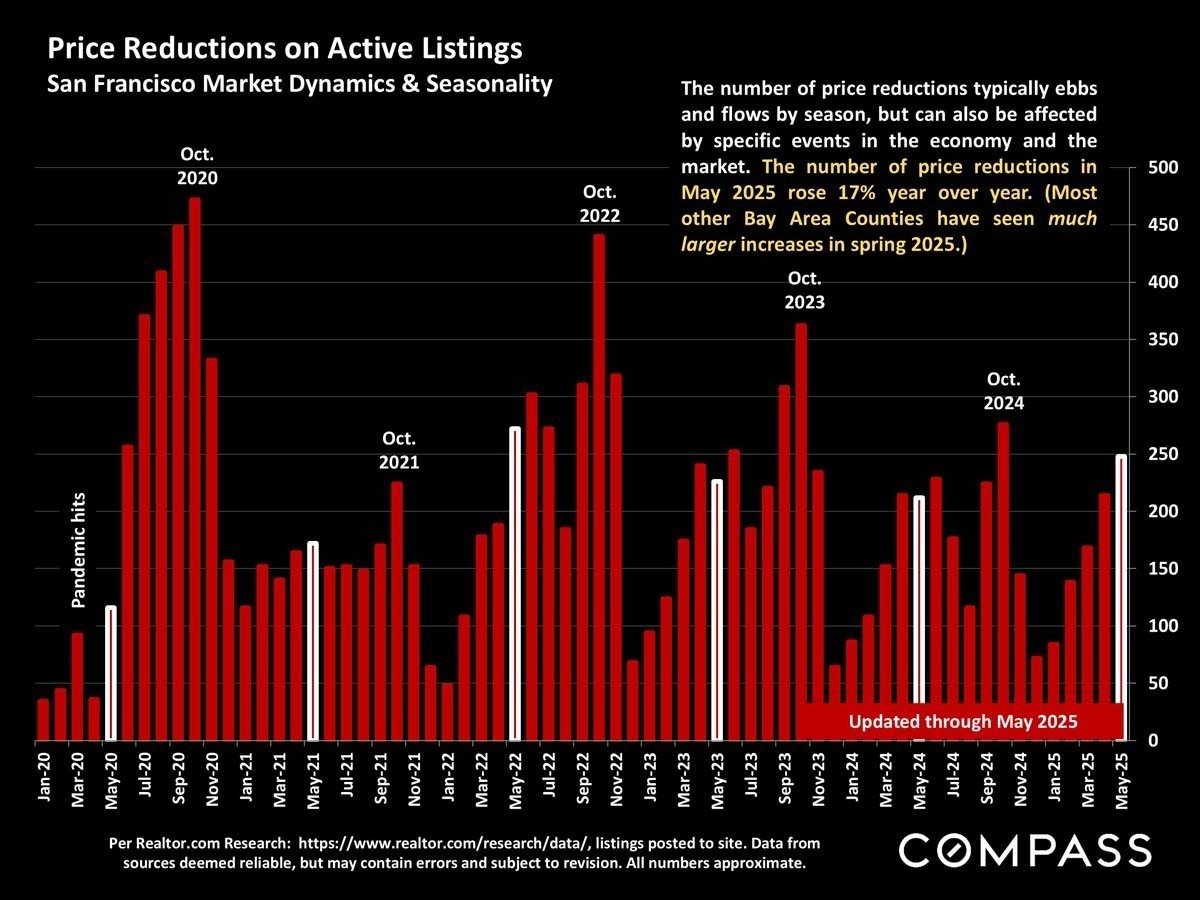
Bar chart of San Francisco active-listing price reductions by month, January 2020 through May 2025.
 
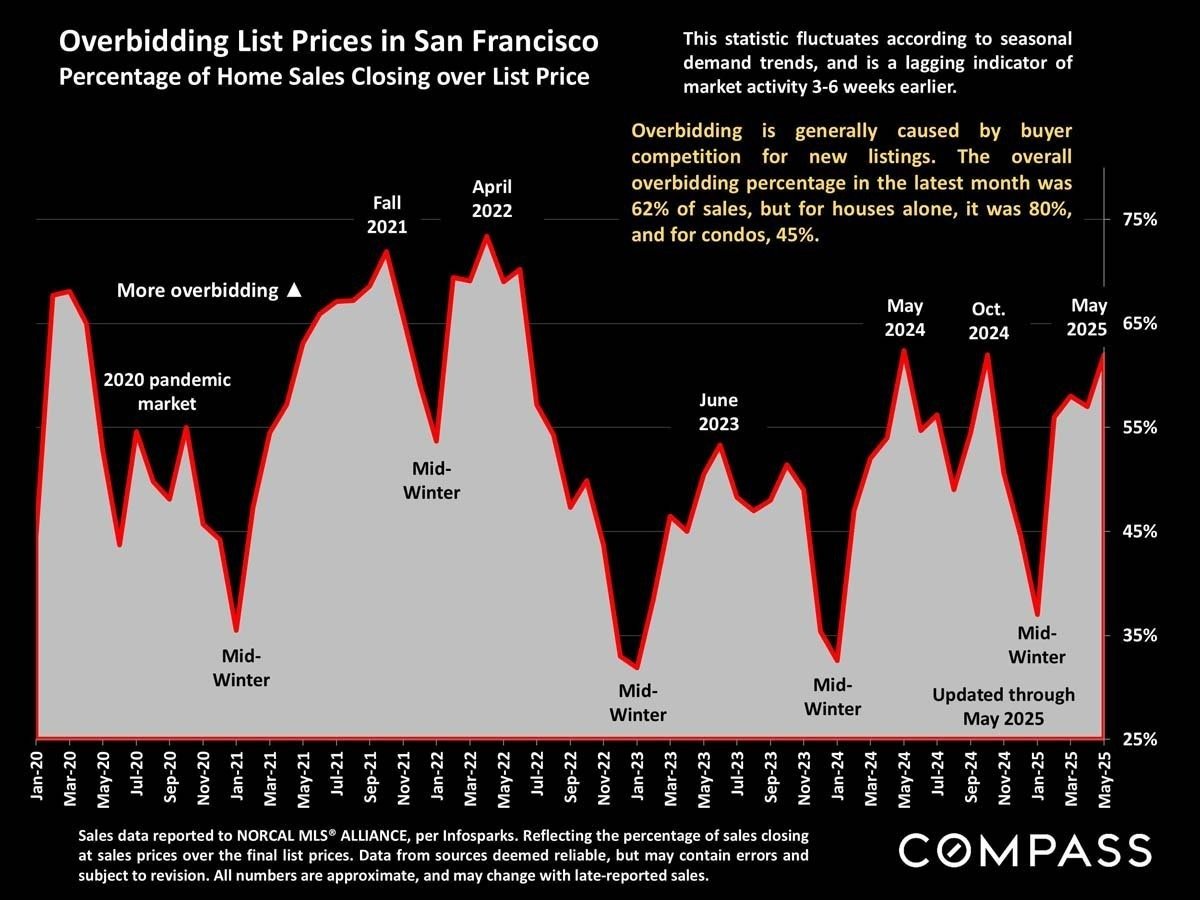
Chart of San Francisco home sales closing over list price, showing monthly trends from January 2020 through May 2025.
 
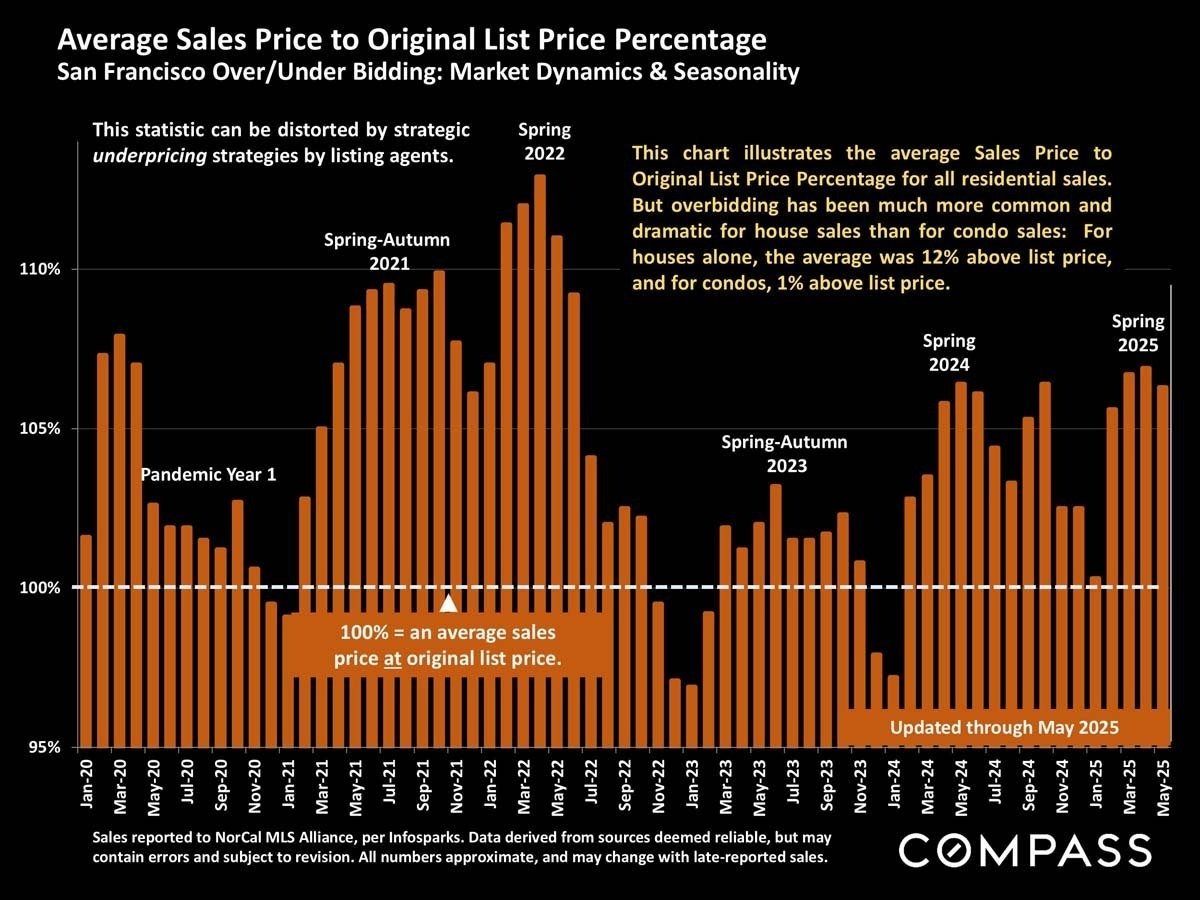
Chart of San Francisco sale prices relative to list prices, with monthly trends from 2020 through May 2025.
 
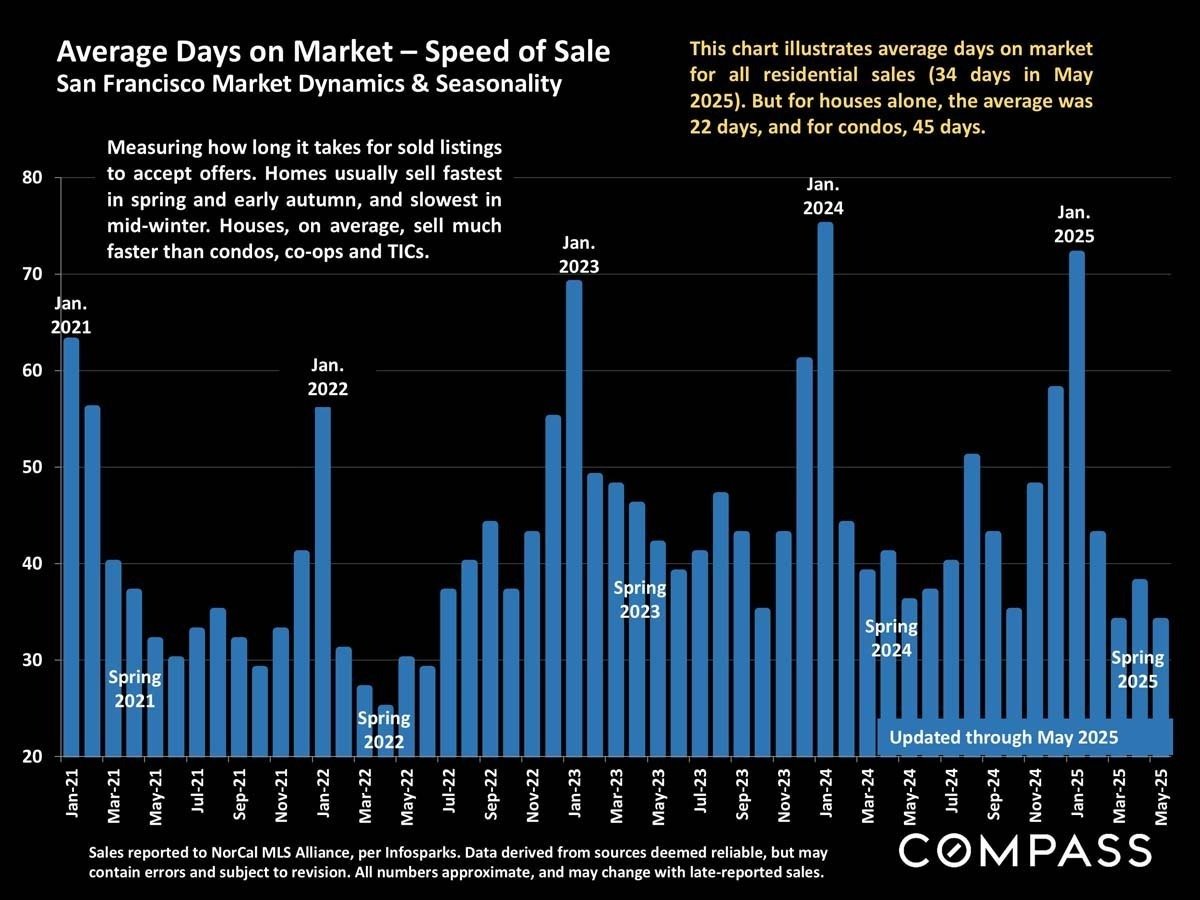
Bar chart showing San Francisco average days on market from January 2021 through May 2025.
 
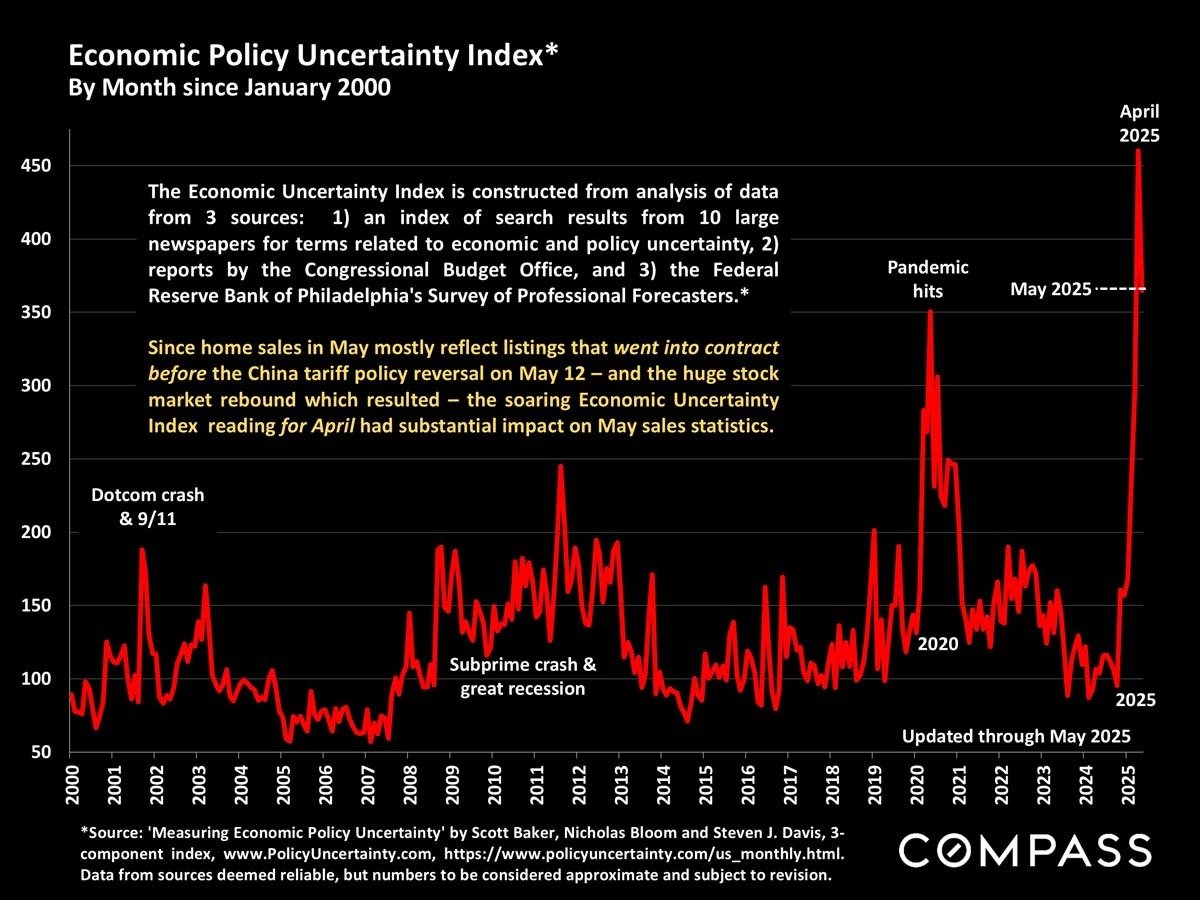
Economic Policy Uncertainty Index chart, 2000–2025, with a sharp spike in April 2025.
 
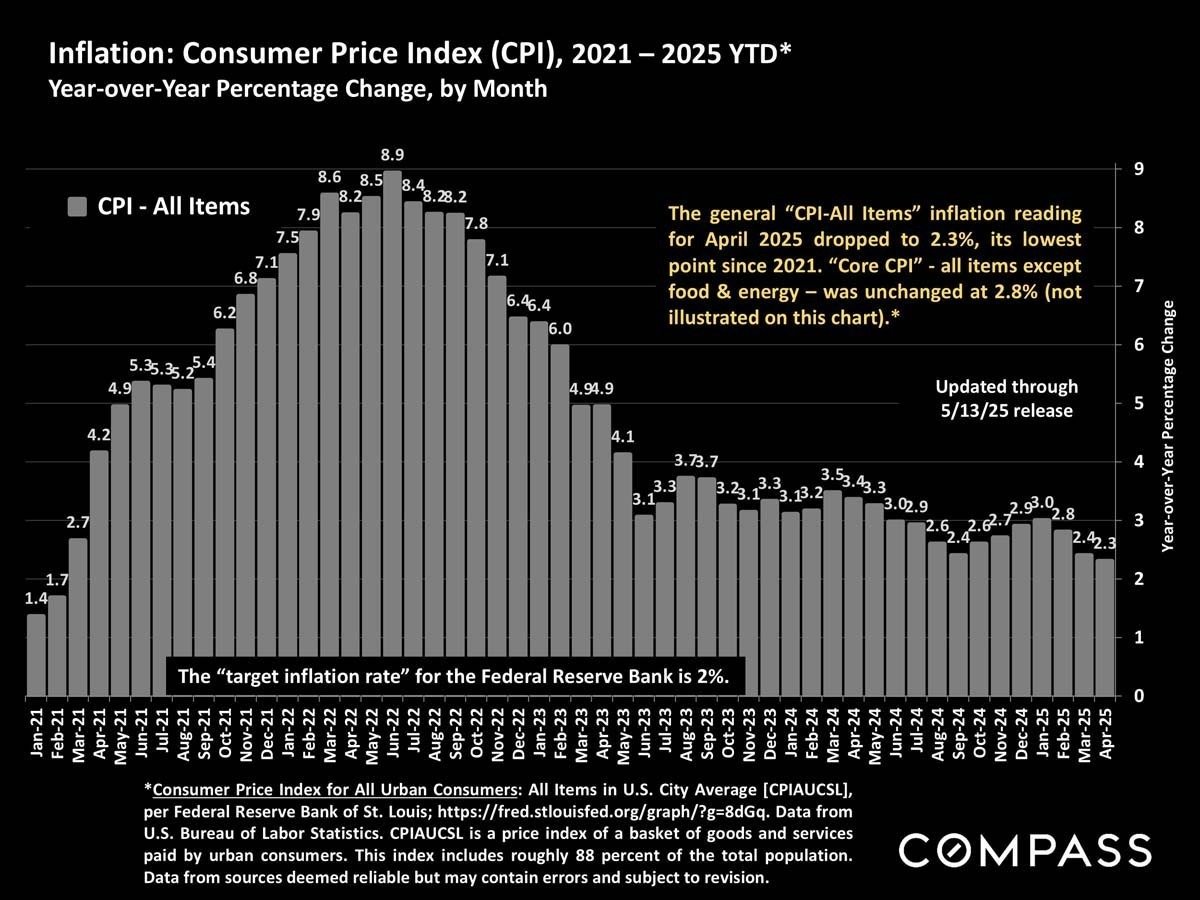
Bar chart of U.S. inflation from 2021 to April 2025, peaking at 8.9% in June 2022 and reaching 2.3%.
 
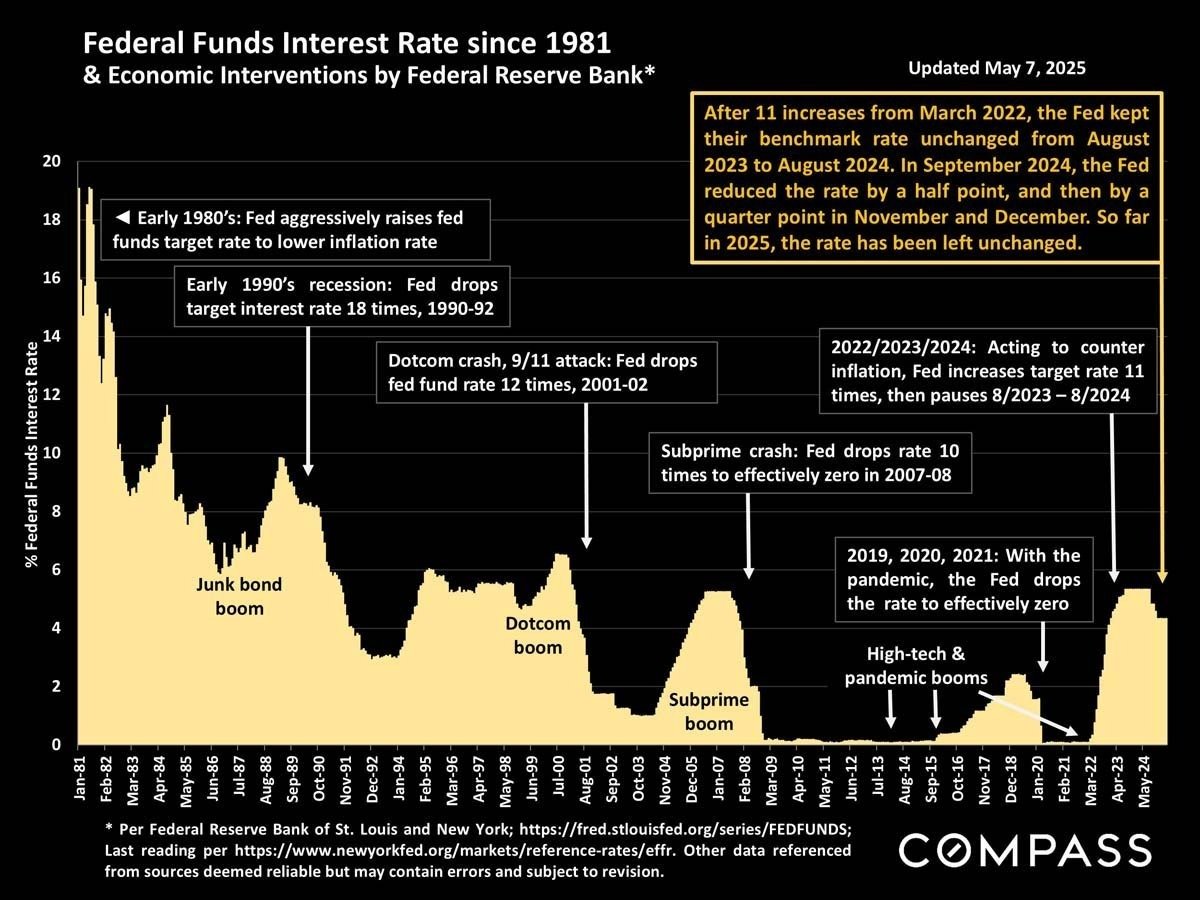
Chart of federal funds rates since 1981, with annotations on economic events and rate changes through 2025.
 
Real estate statistics methodology, limitations, photo license, and Compass legal disclaimer.

Work With Jane

Get assistance in determining the current property value, crafting a competitive offer, writing and negotiating a contract, and much more. Contact me today.
Follow Me on Instagram