San Francisco Real Estate May 2024 Report cover with a city view and Compass branding.

San Francisco Home Prices, Market Conditions & Trends May 2024

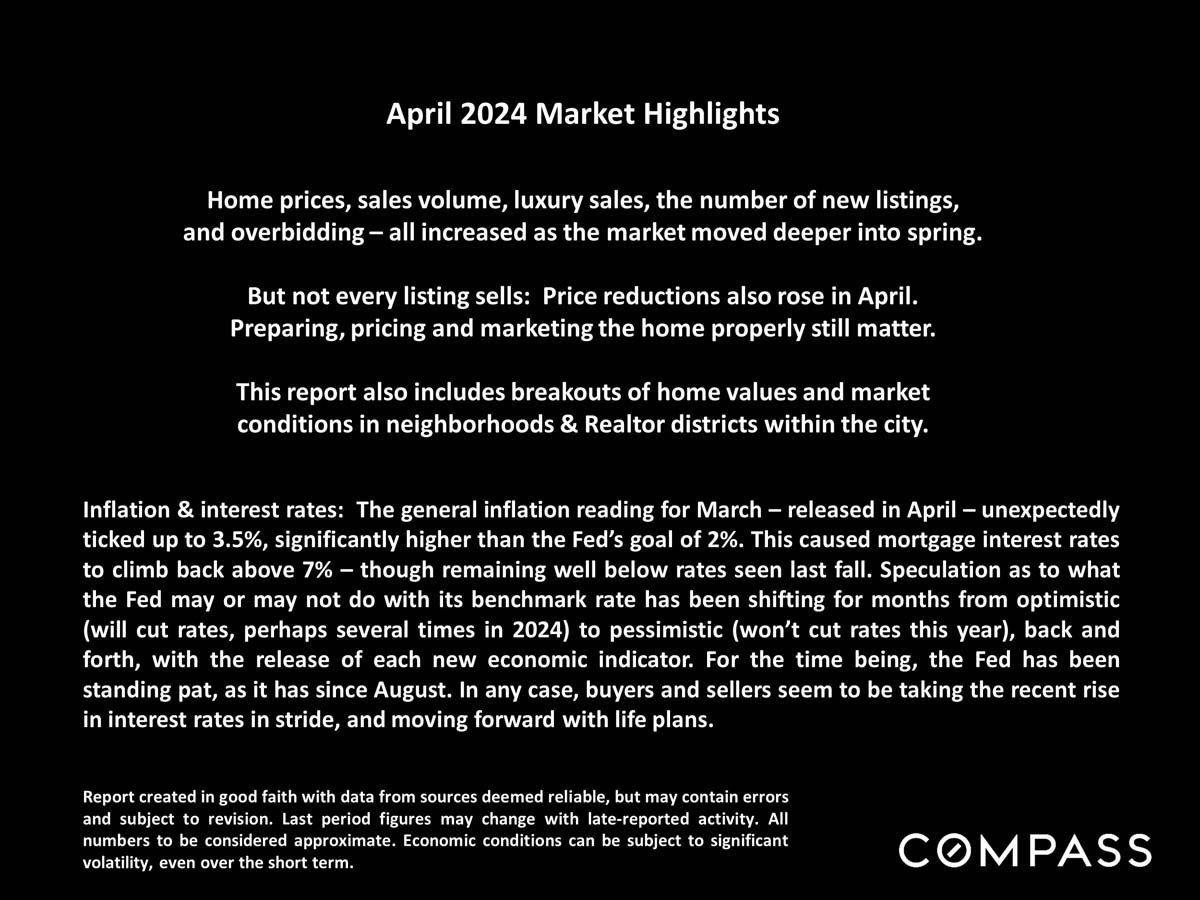
Home prices, sales volume, luxury sales, the number of new listings, and overbidding all increased as the market moved deeper into spring. But not every listing sells: Price reductions also rose in April. Preparing, pricing, and marketing the home properly still matter.
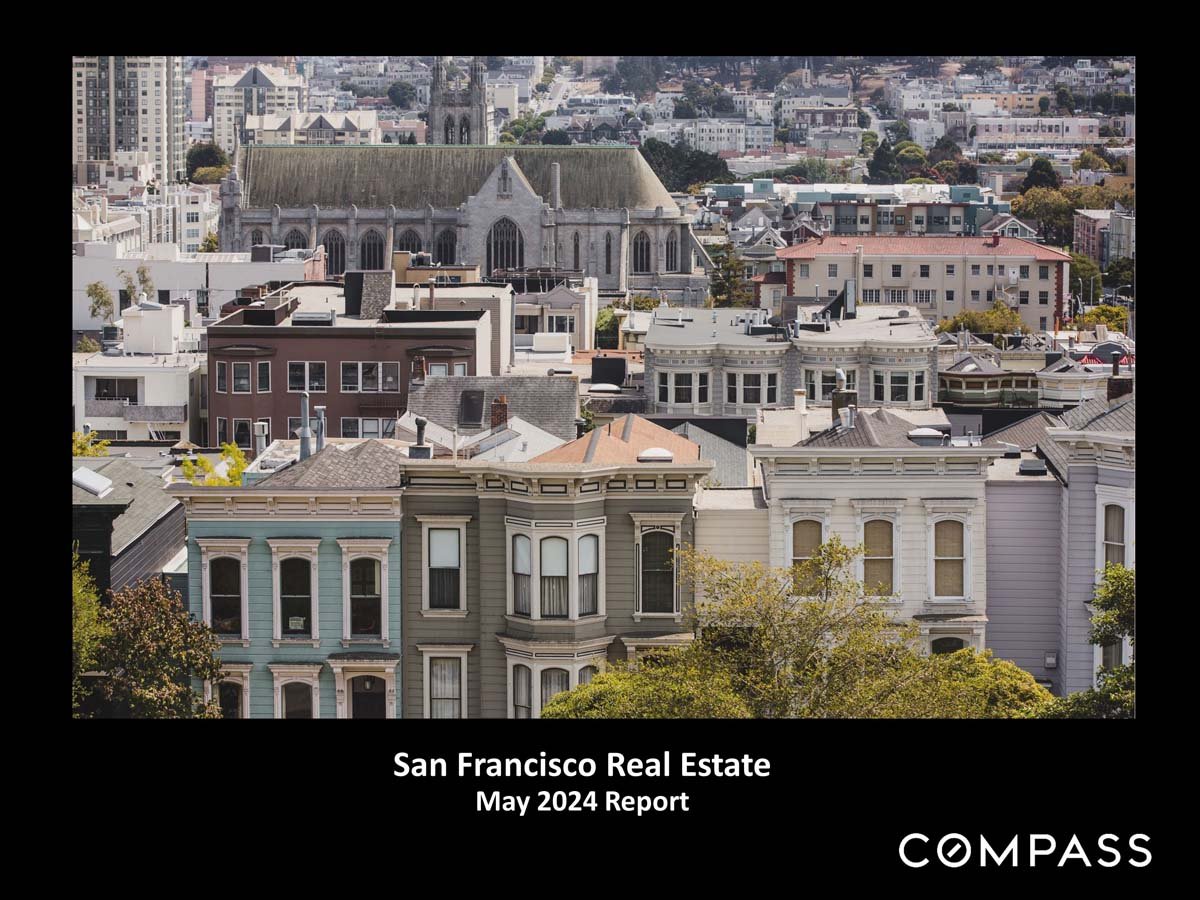
 
San Francisco Real Estate May 2024 Report cover with a city view and Compass branding.
 
April 2024 market highlights on home prices, sales, listings, interest rates, and price reductions.
 
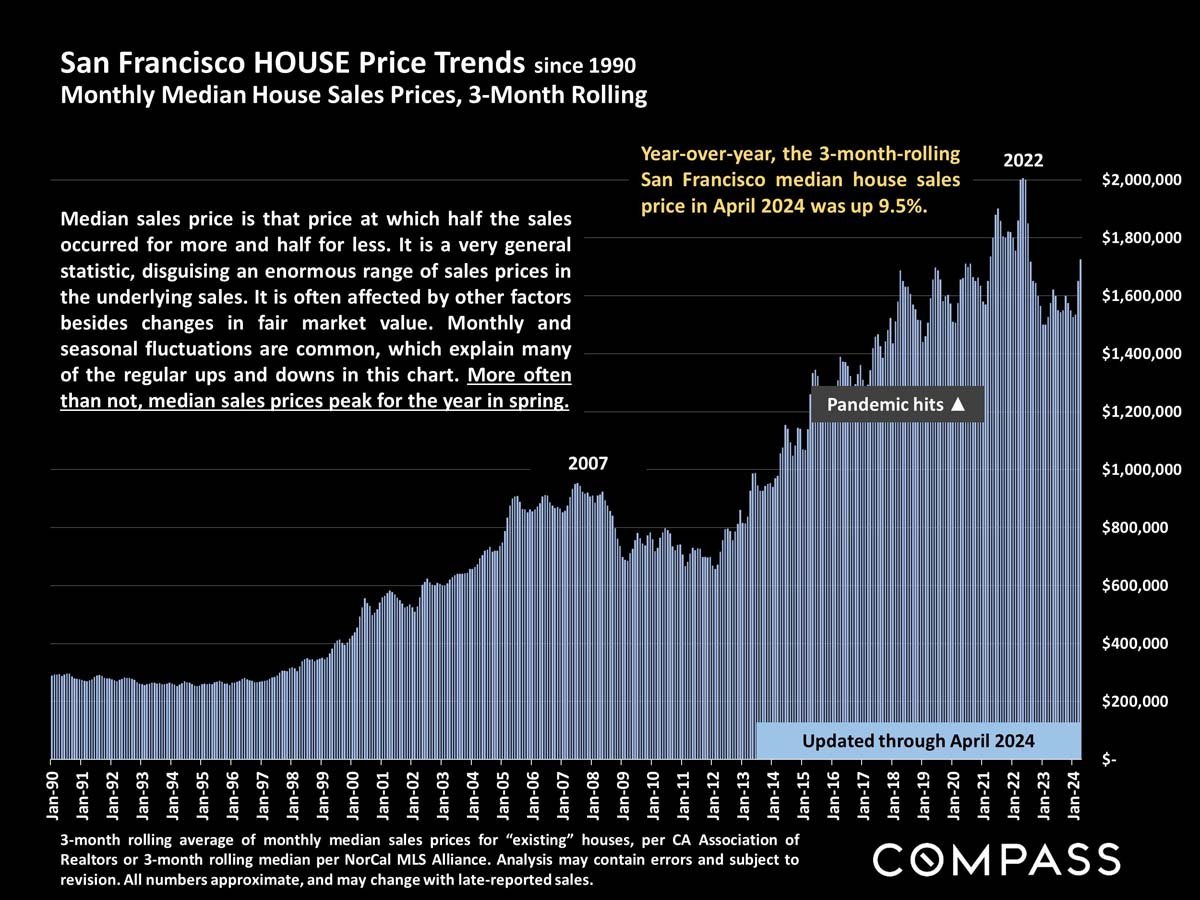
Chart of San Francisco median house prices, 1990–2024; April 2024 prices were up 9.5% year over year.
 
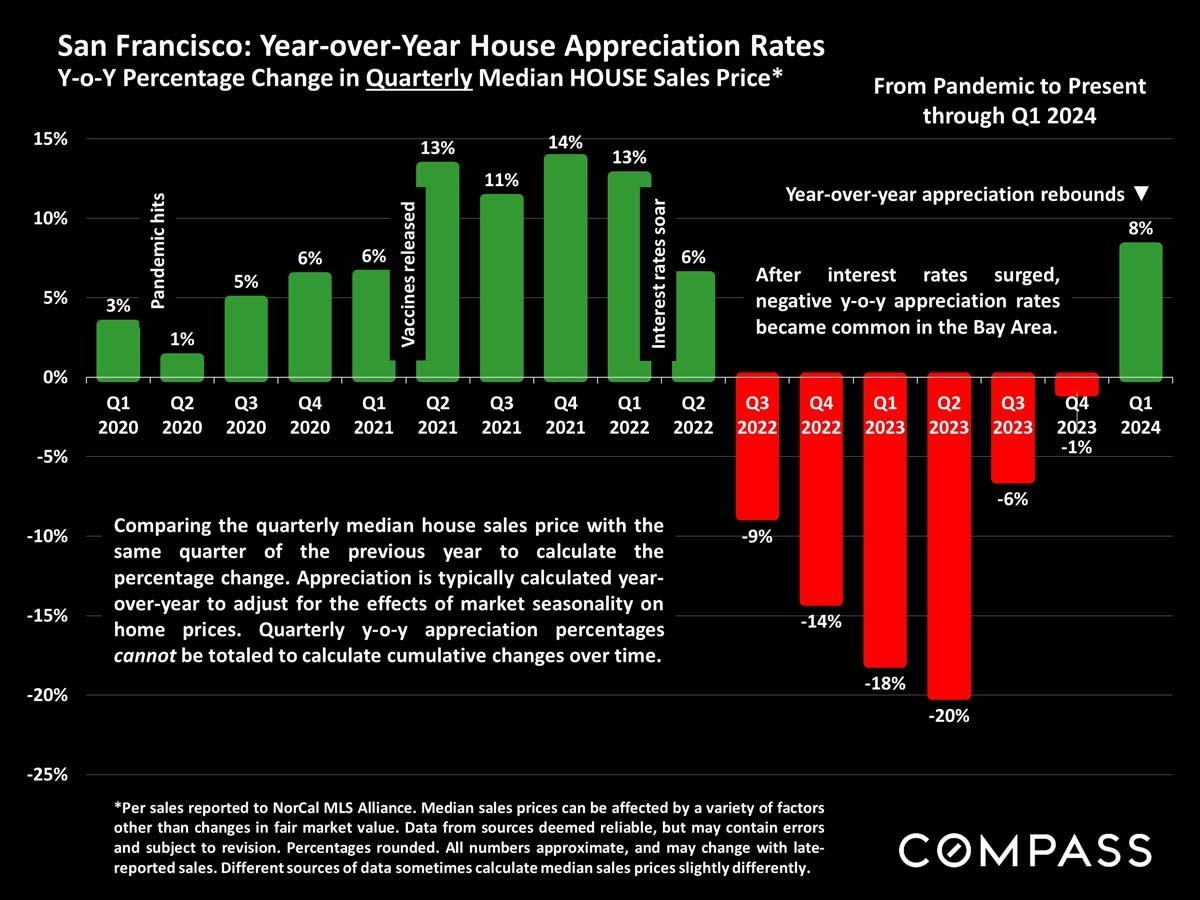
Chart of San Francisco home-price appreciation, showing a 20% decline in Q2 2023 and an 8% rebound in Q1 2024.
 
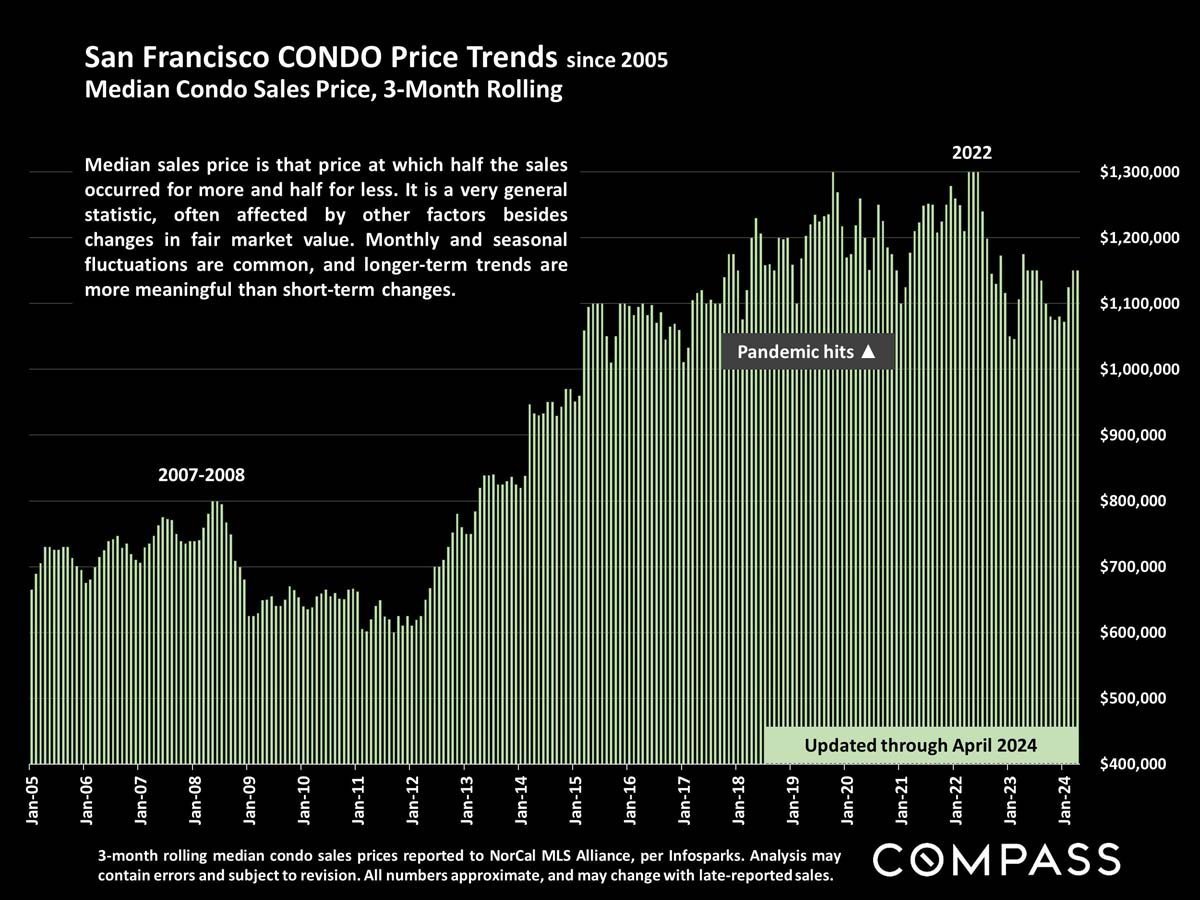
Chart of San Francisco condo prices, showing a long-term rise and peaks near $1.3 million around 2022.
 
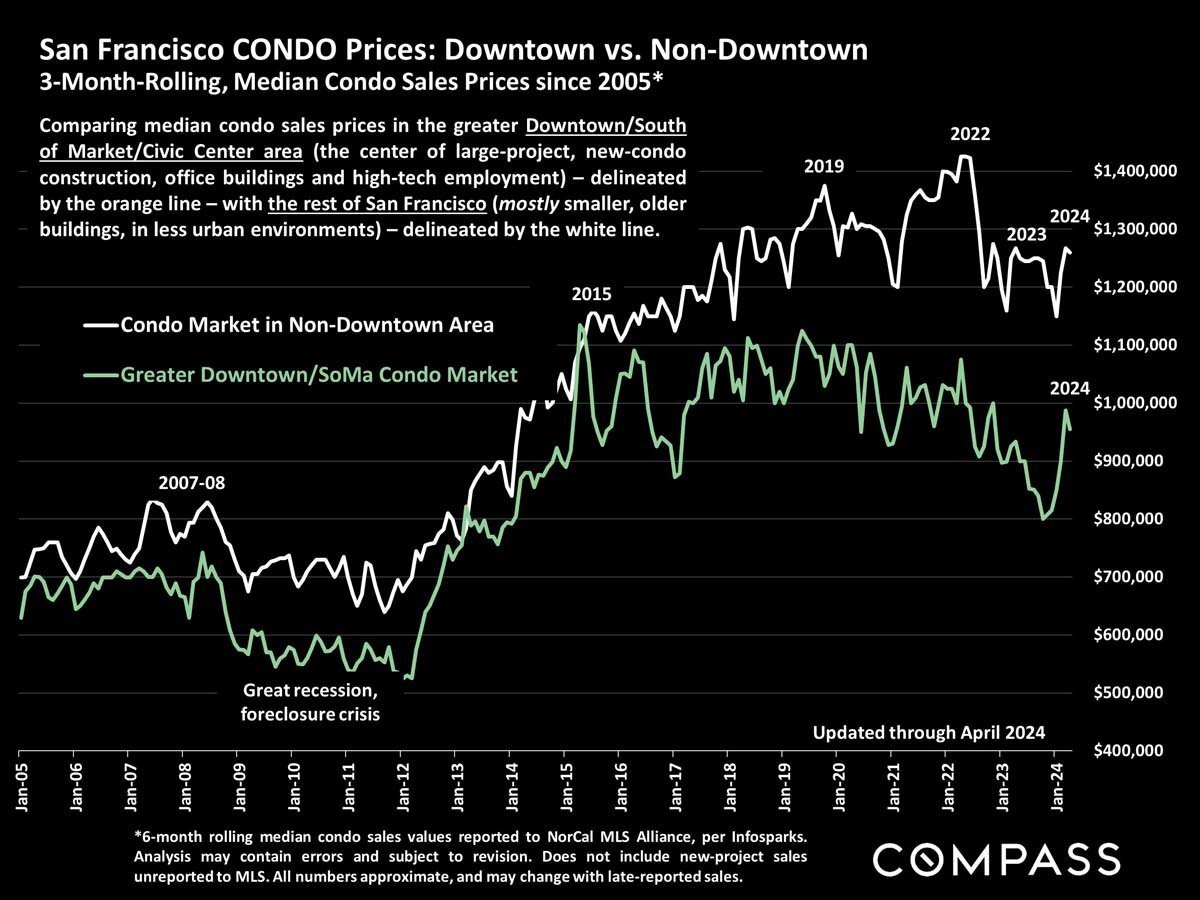
Line chart comparing San Francisco condo prices downtown and non-downtown from 2005 through April 2024.
 
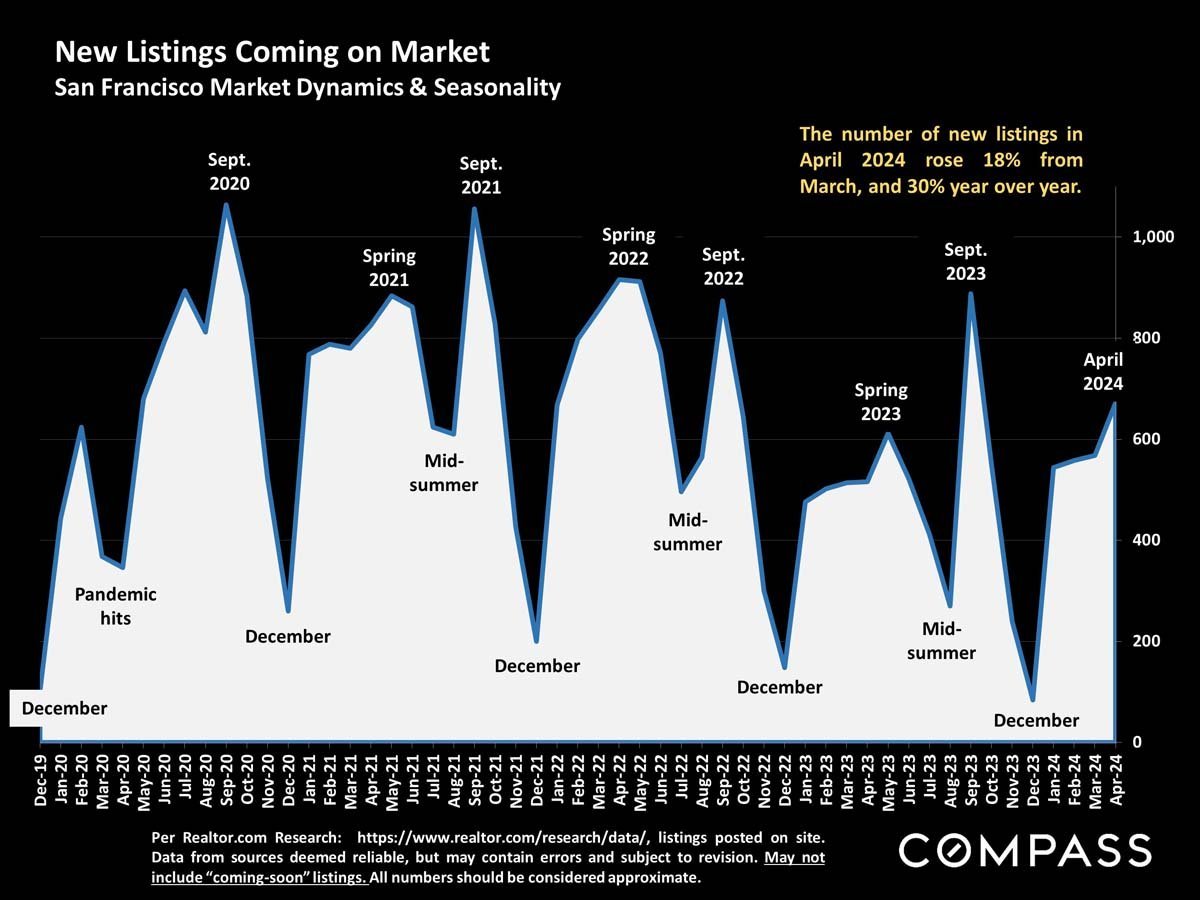
Chart of San Francisco new listings, December 2019–April 2024, with April 2024 listings up 18% month over month.
 
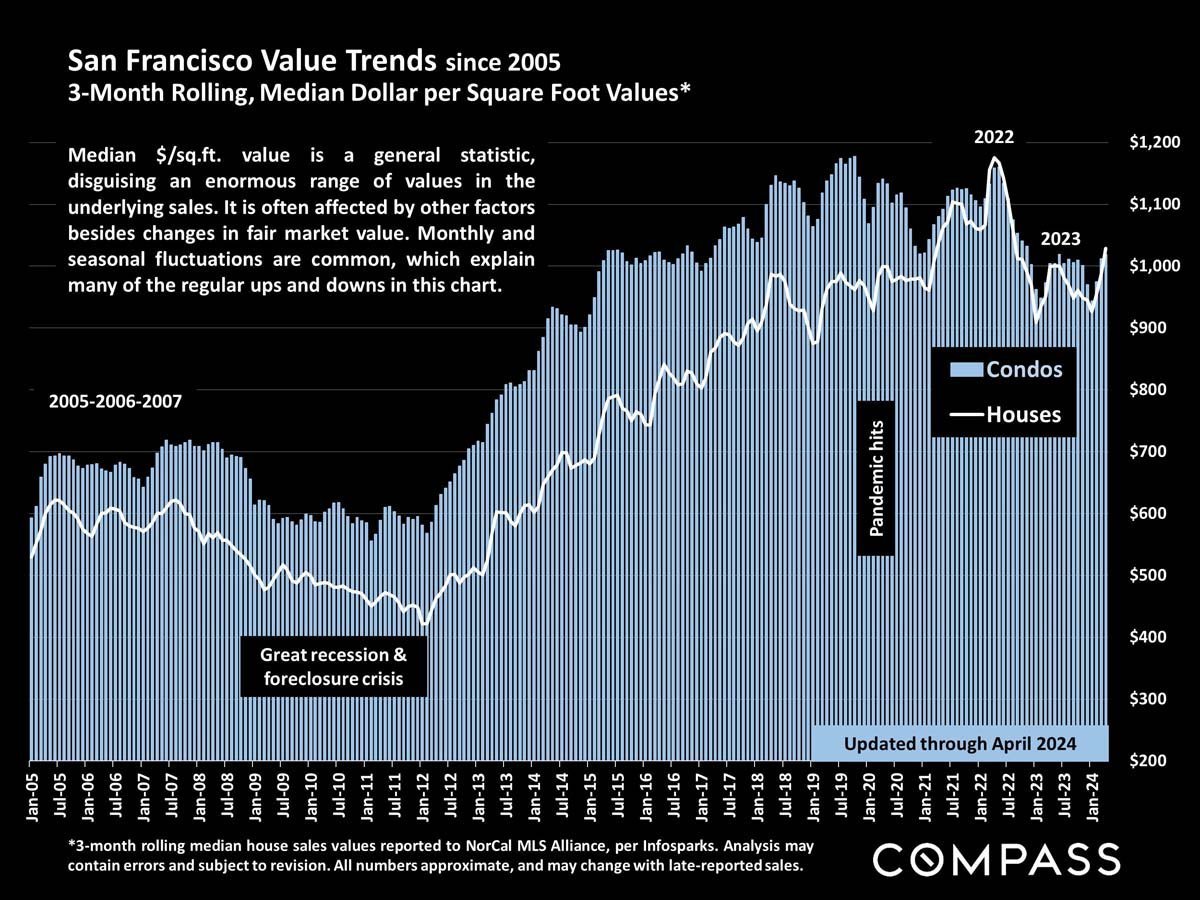
Chart comparing San Francisco condo and house values per square foot from 2005 through April 2024.
 
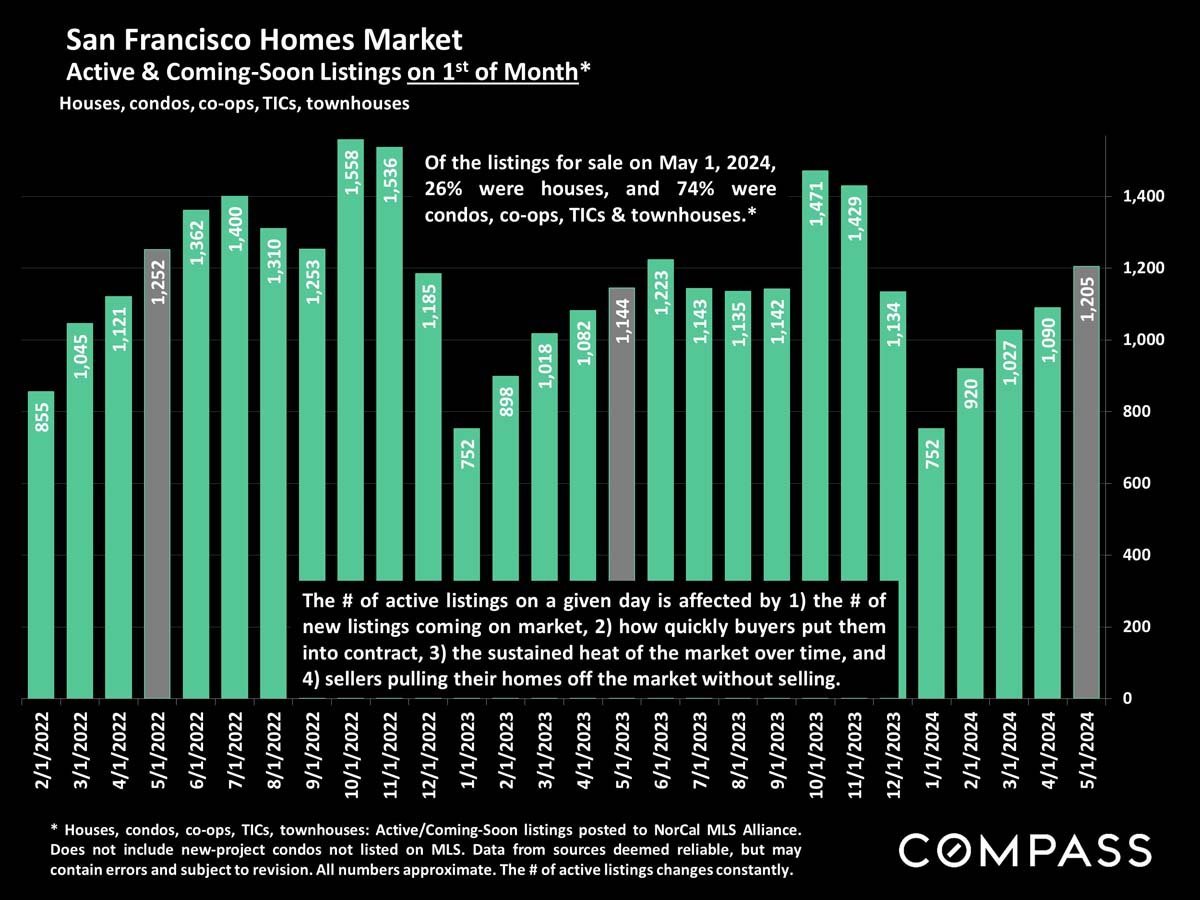
Bar chart of San Francisco active and coming-soon home listings from February 2022 through May 2024.
 
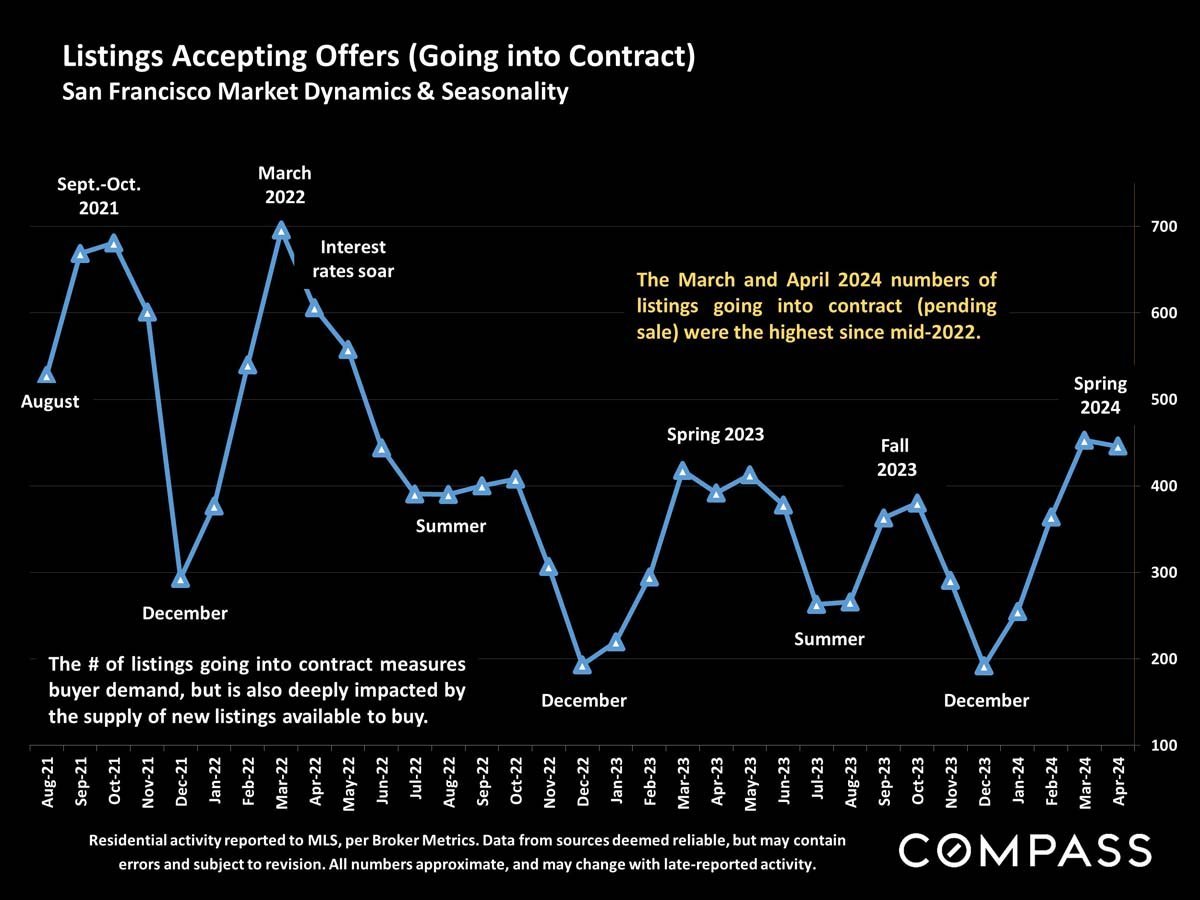
Line chart of San Francisco listings going into contract, with seasonal peaks and a spring 2024 high.
 
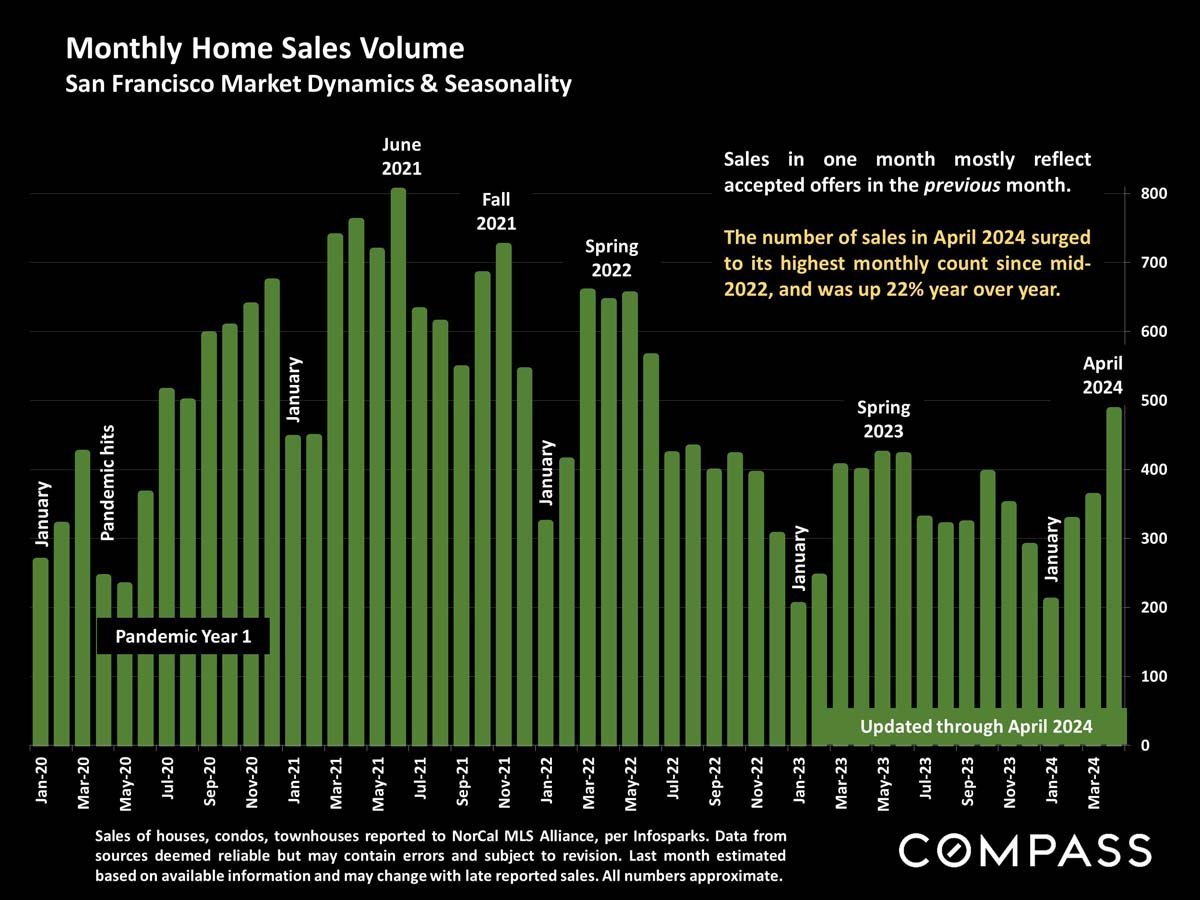
Chart of San Francisco monthly home sales, January 2020–April 2024; April 2024 sales rose 22% year over year.
 
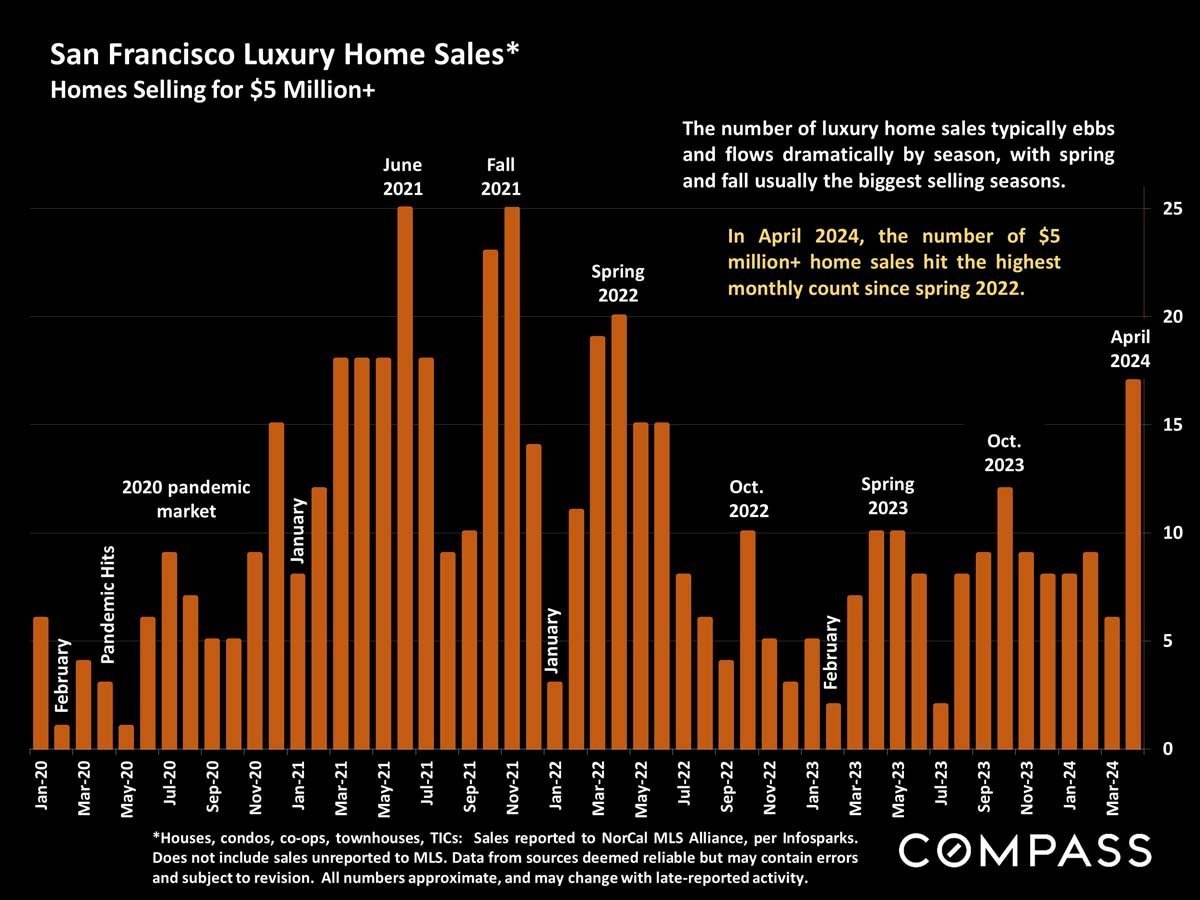
Bar chart of San Francisco $5 million-plus home sales from 2020 to April 2024, with April 2024 highlighted.
 
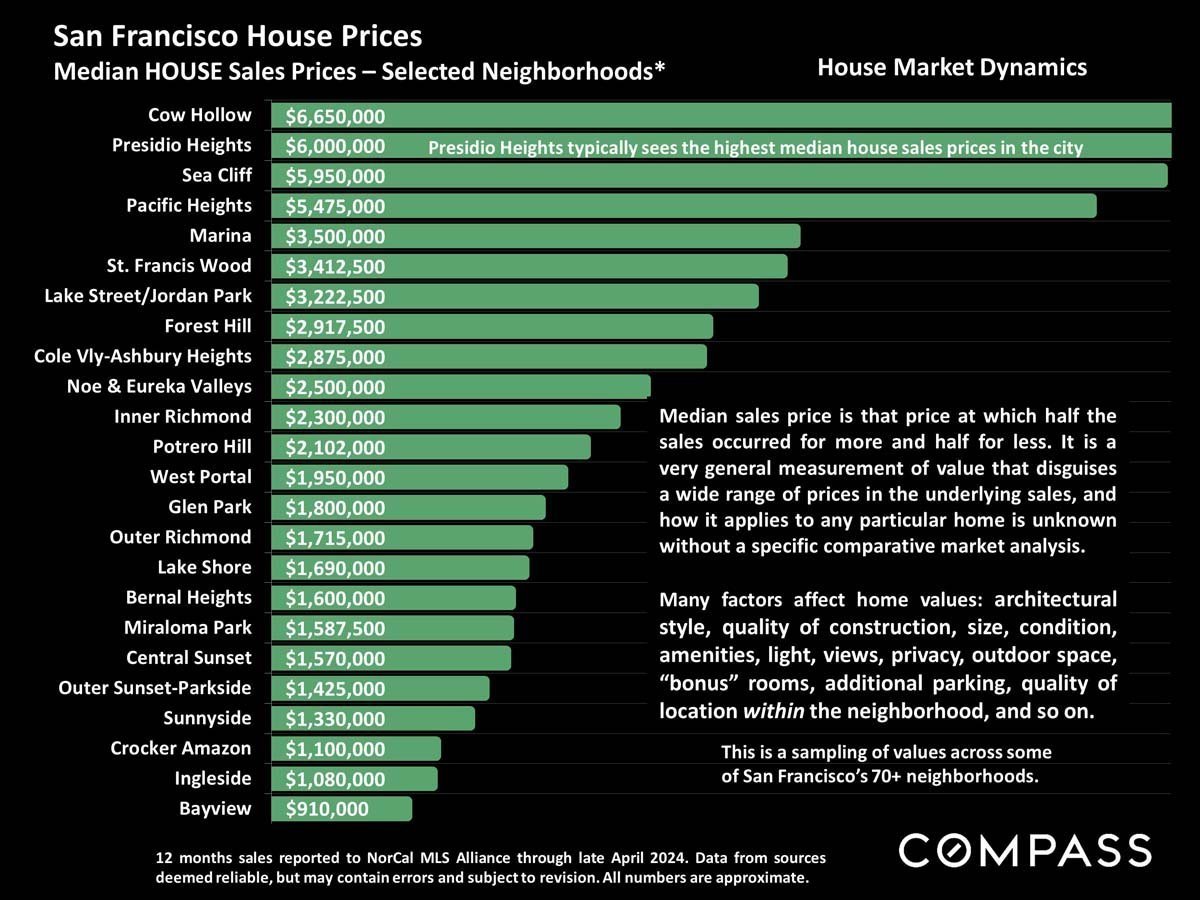
Bar chart comparing median house sale prices across San Francisco neighborhoods, from Cow Hollow to Bayview.
 
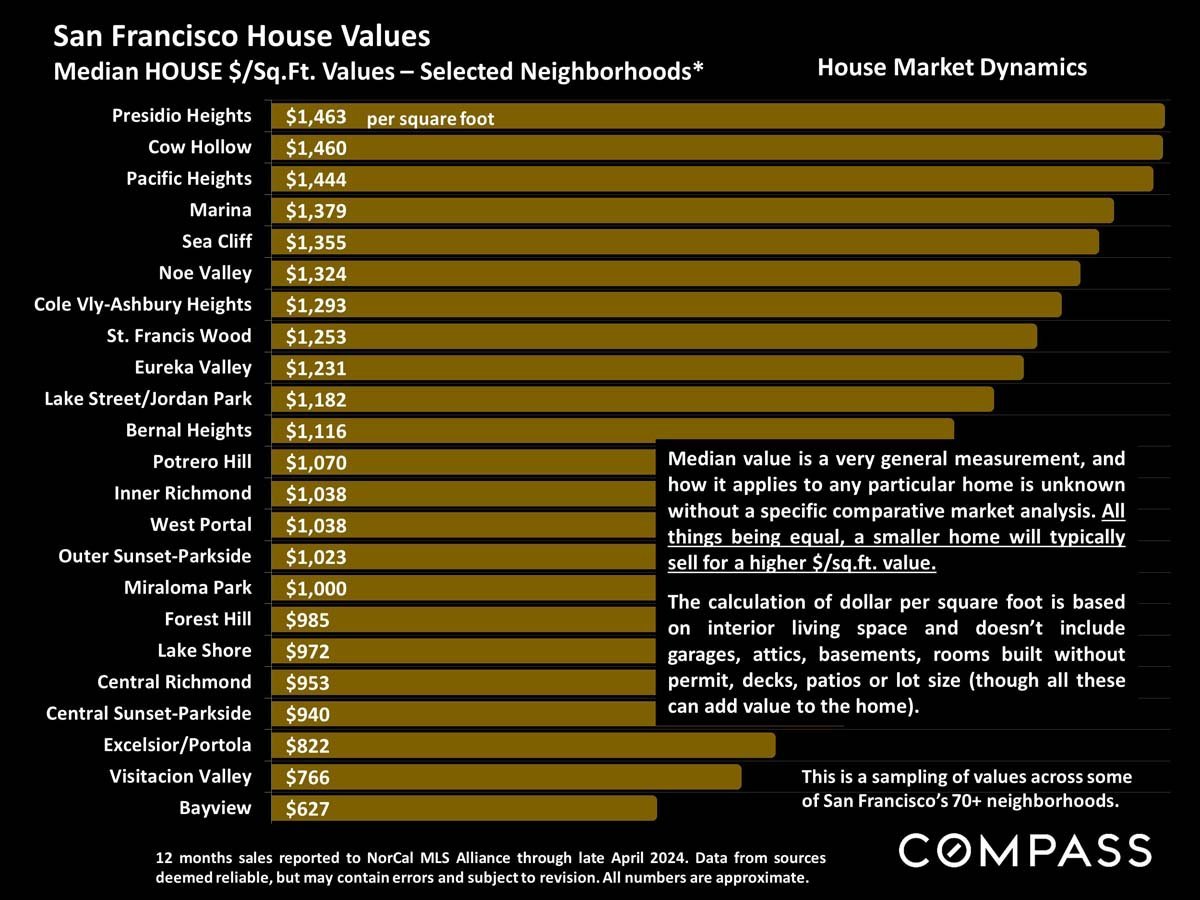
Chart comparing median house prices per square foot across selected San Francisco neighborhoods, from Presidio Heights to Bayview.
 
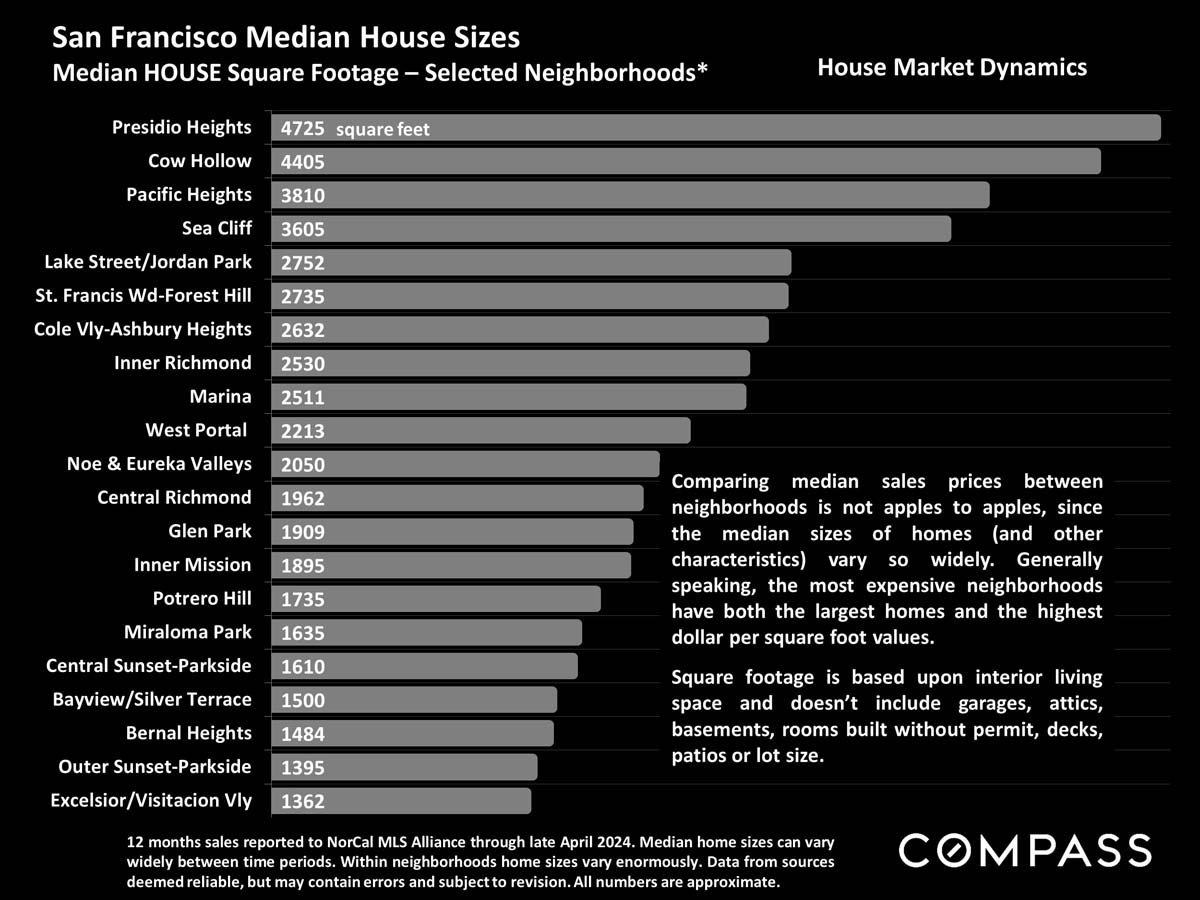
Infographic comparing median house sizes across 21 San Francisco neighborhoods, with explanatory notes and Compass branding.
 
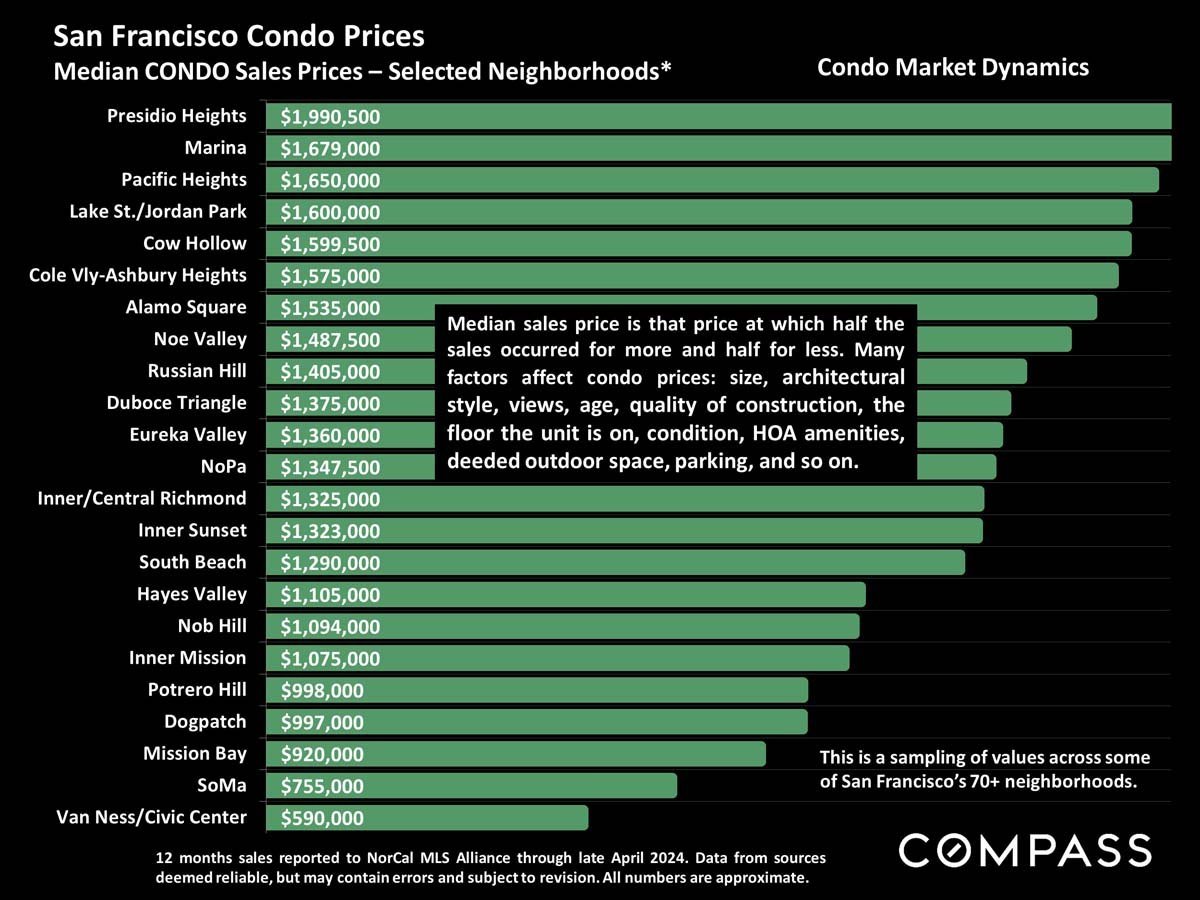
Bar chart of median San Francisco condo prices by neighborhood, from $590,000 at Van Ness/Civic Center to $1,990,500 in Presidio Heights.
 
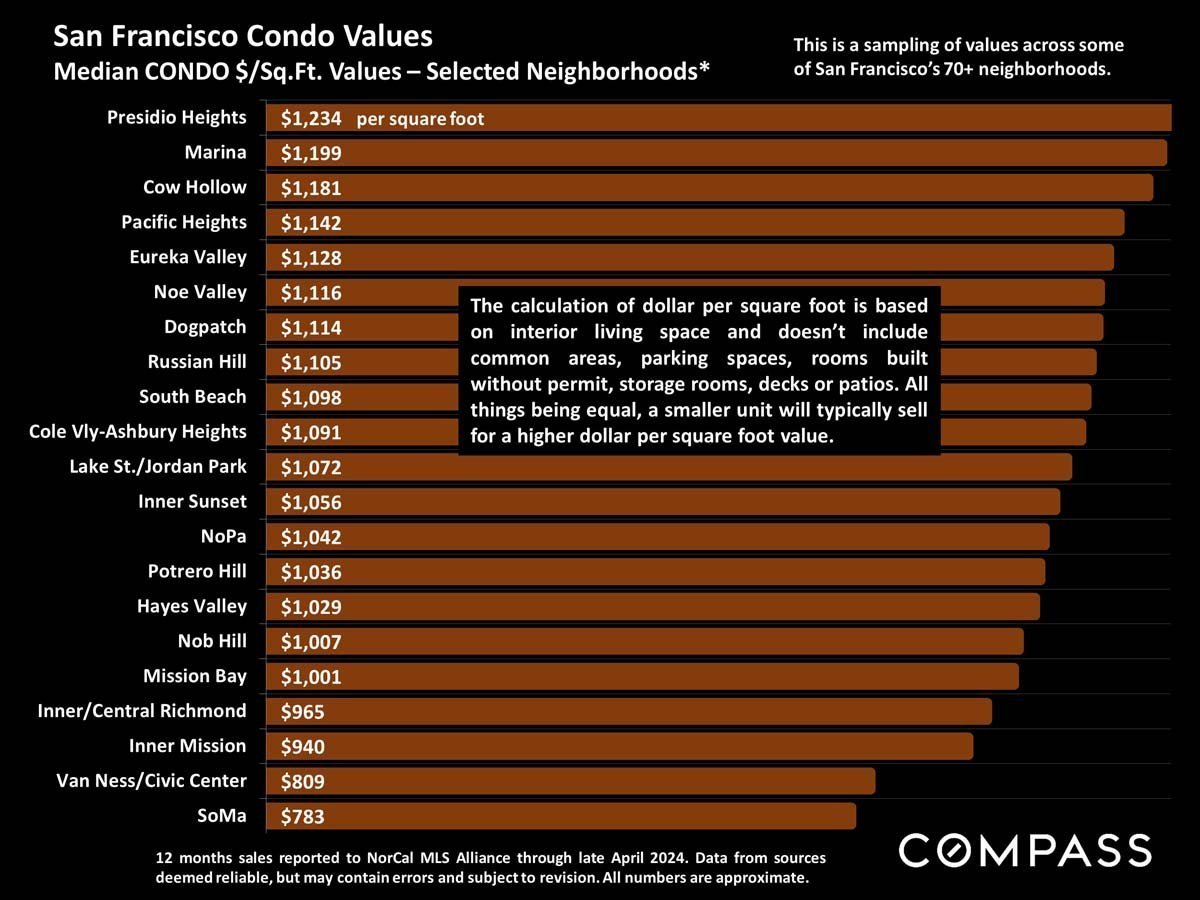
Chart comparing median San Francisco condo prices per square foot across selected neighborhoods, from Presidio Heights to SoMa.
 
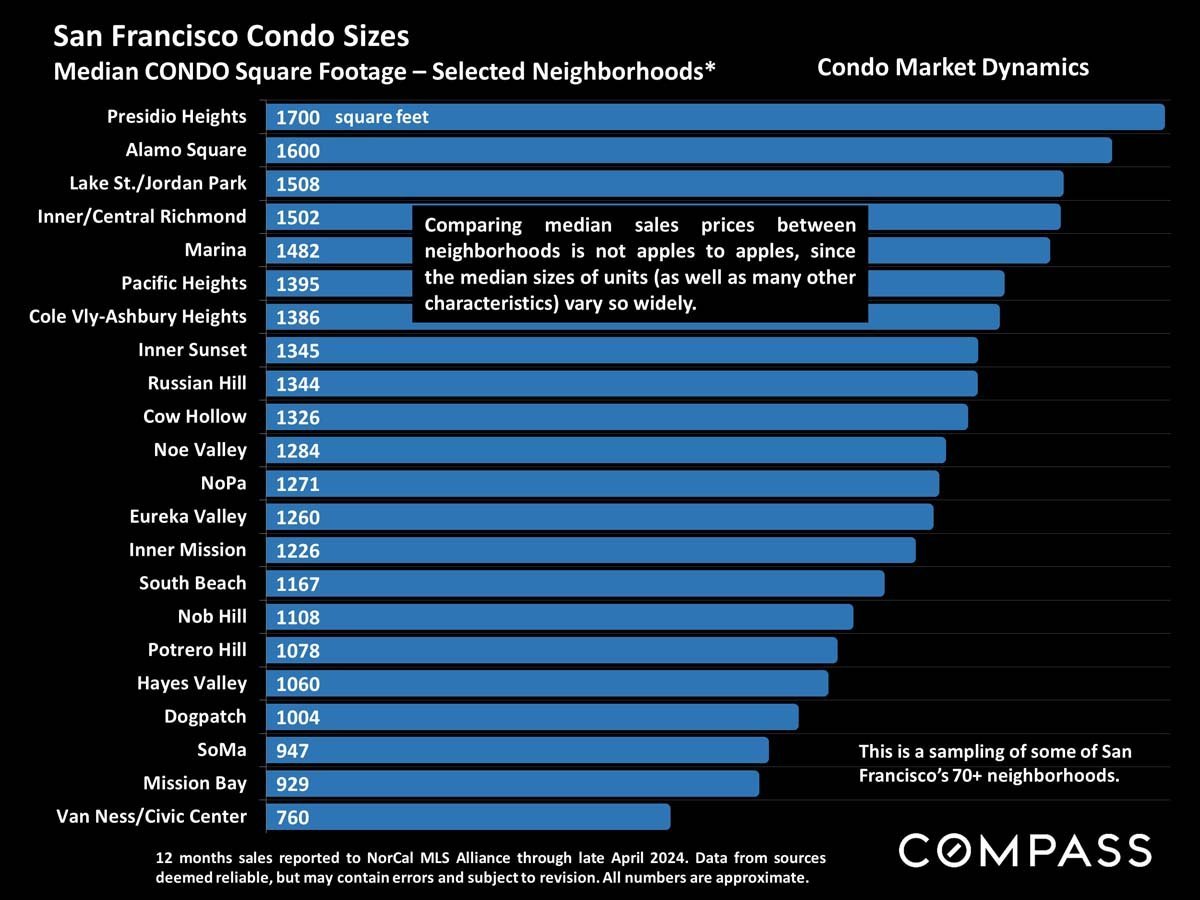
Chart of median condo sizes in selected San Francisco neighborhoods, from 760 square feet in Van Ness/Civic Center to 1,700 in Presidio Heights.
 
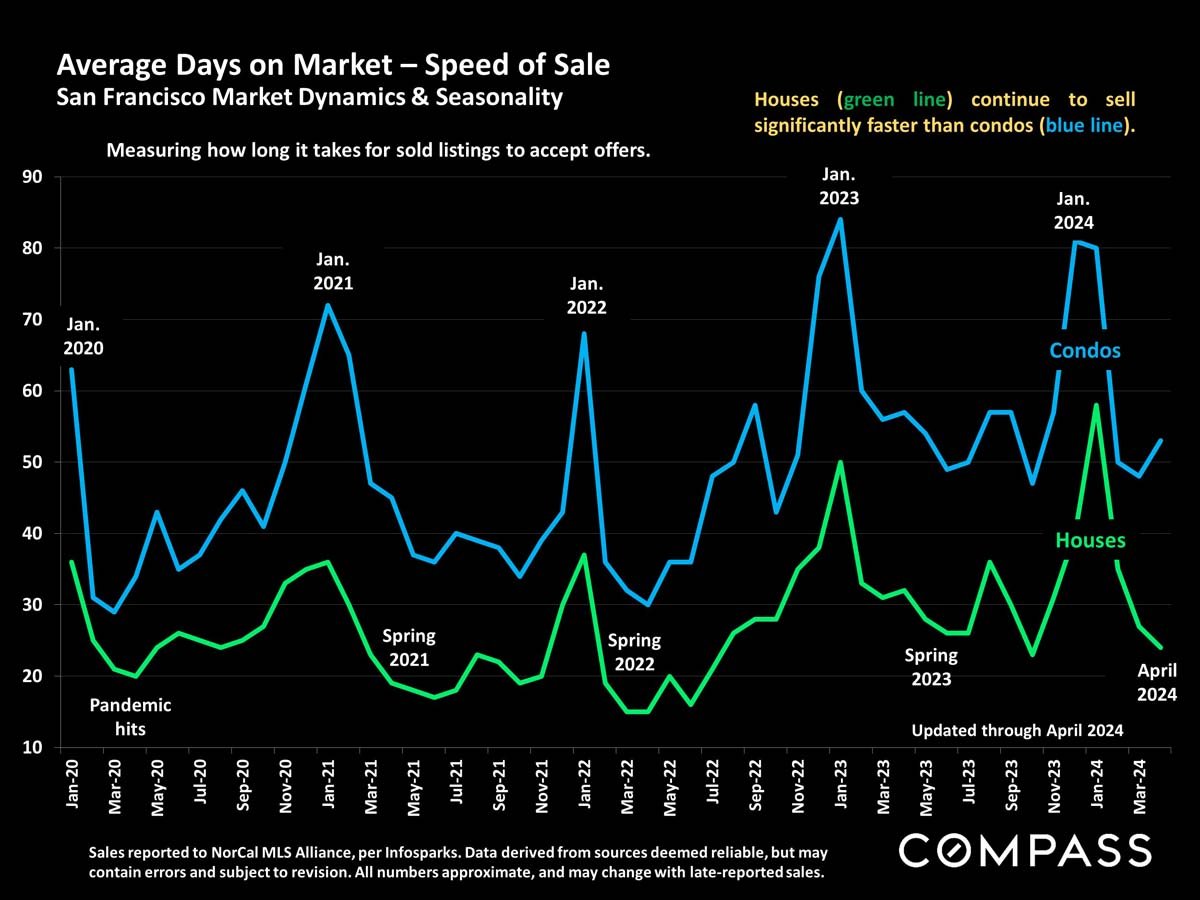
Chart comparing San Francisco houses’ and condos’ days on market from 2020 through April 2024.
 
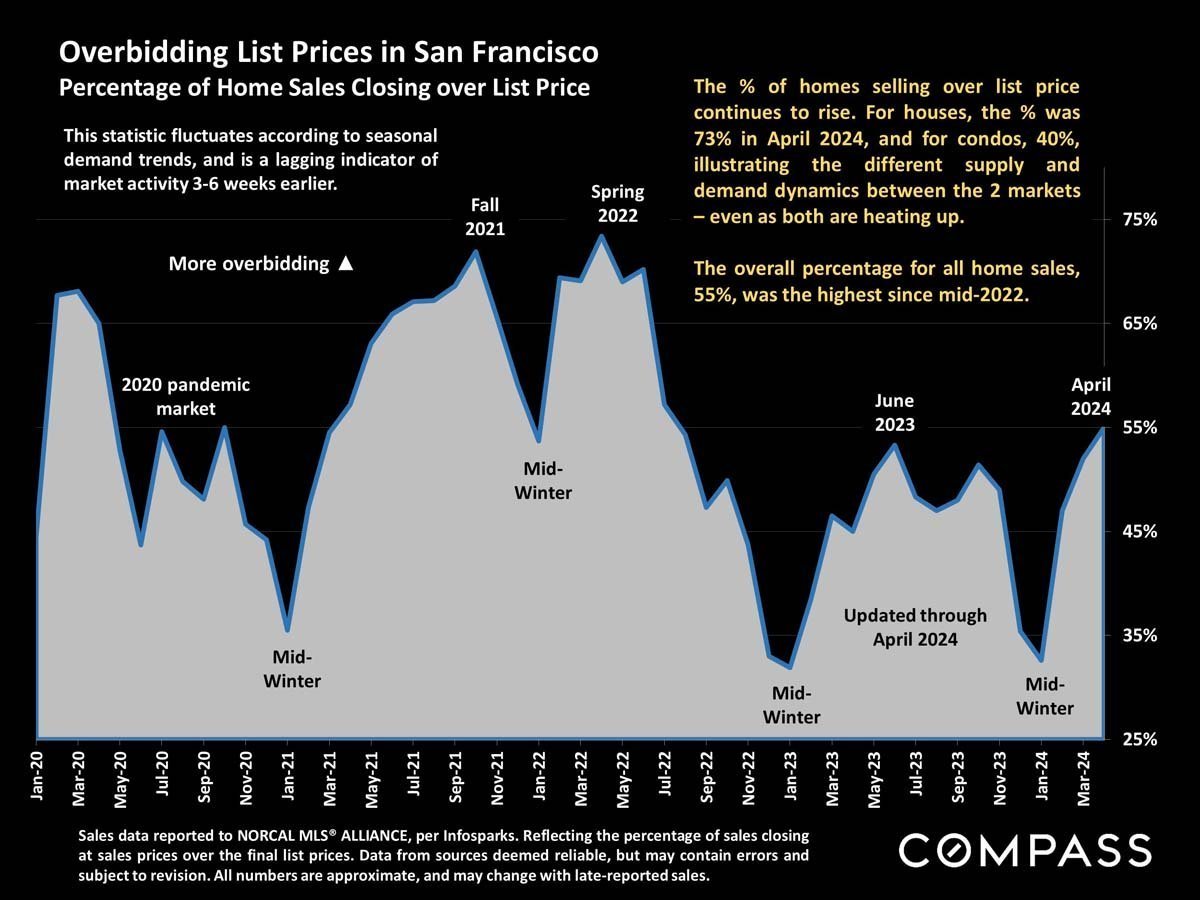
Chart of San Francisco home sales closing over list price, with monthly rates from 2020 through April 2024.
 
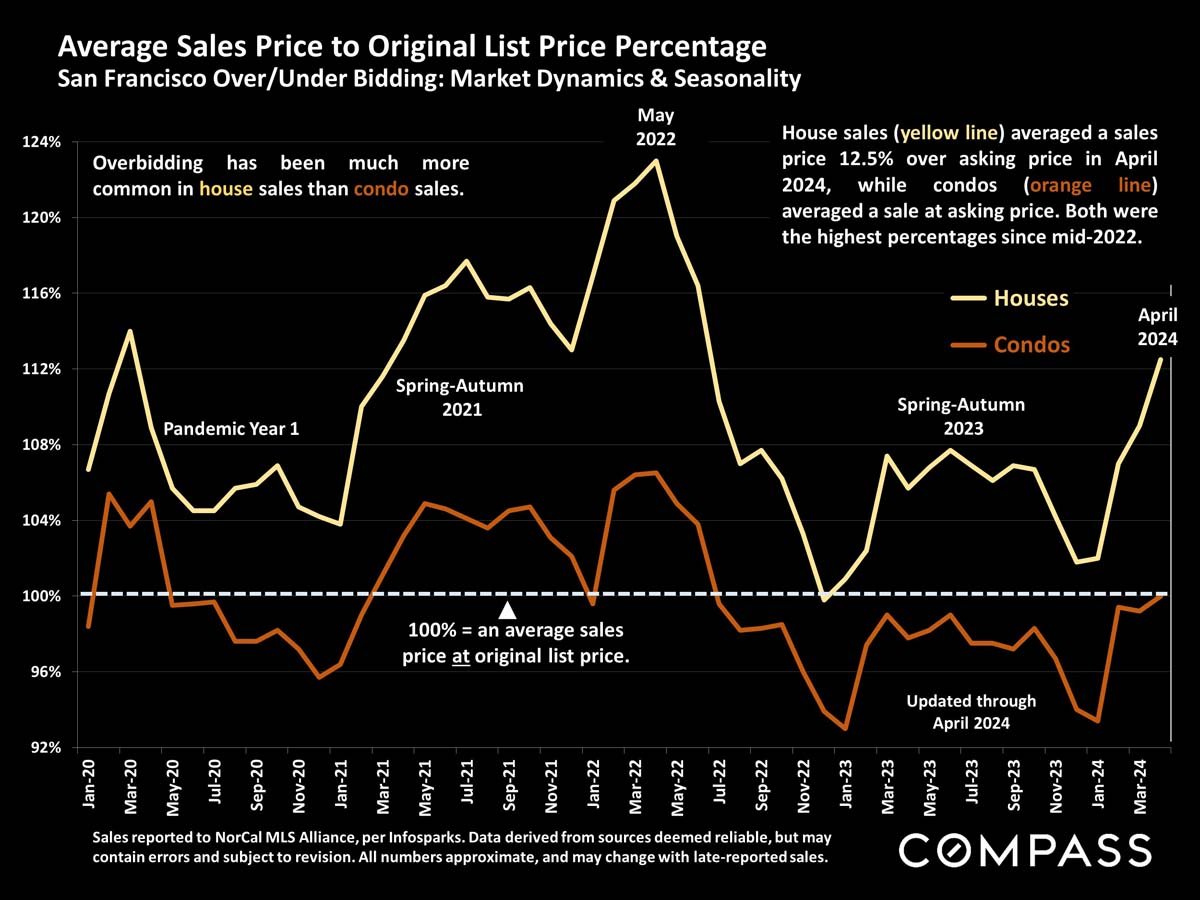
San Francisco home sale prices versus original list prices, with houses in yellow and condos in orange, January 2020–April 2024.
 
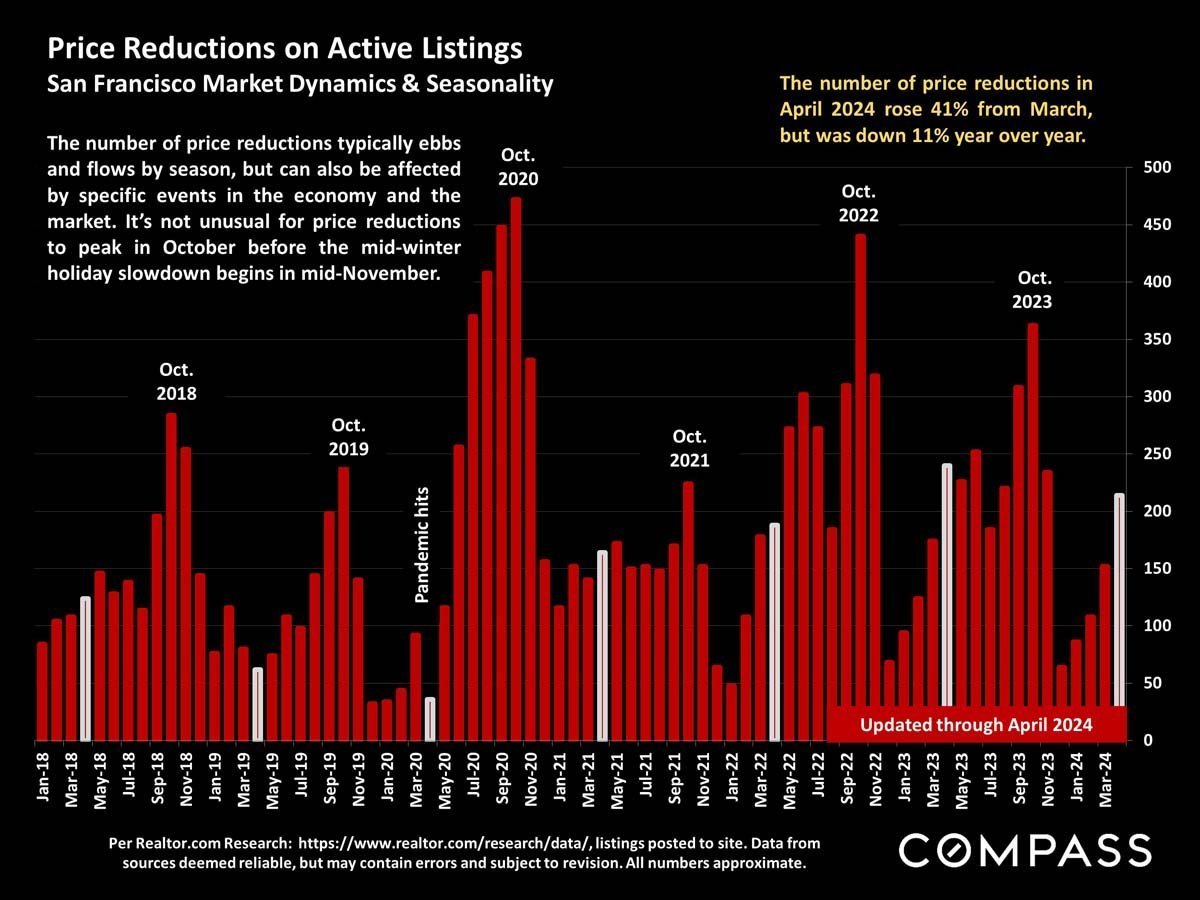
Bar chart of San Francisco listing price reductions, with October peaks from 2018 to 2023 and April 2024 figures.
 
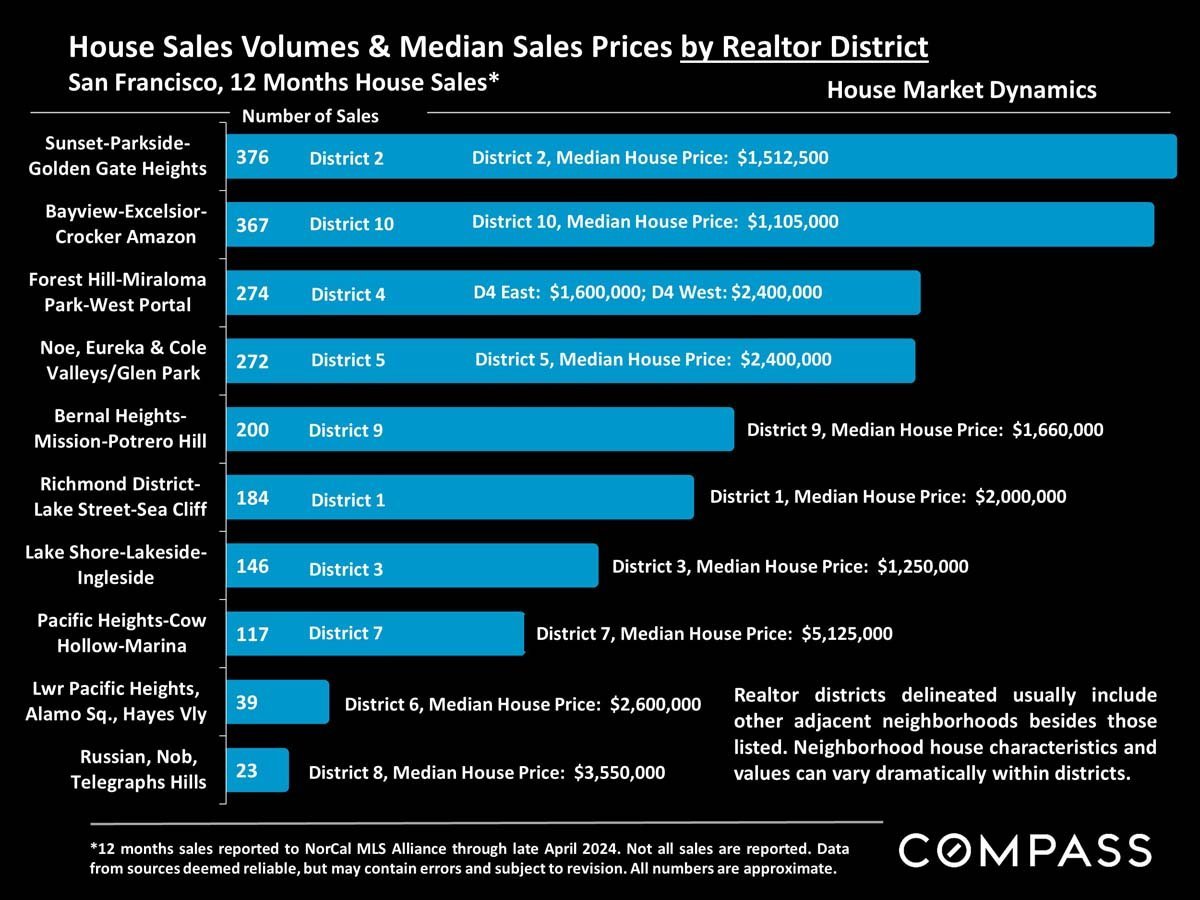
Infographic comparing San Francisco house sales volume and median prices across realtor districts.
 
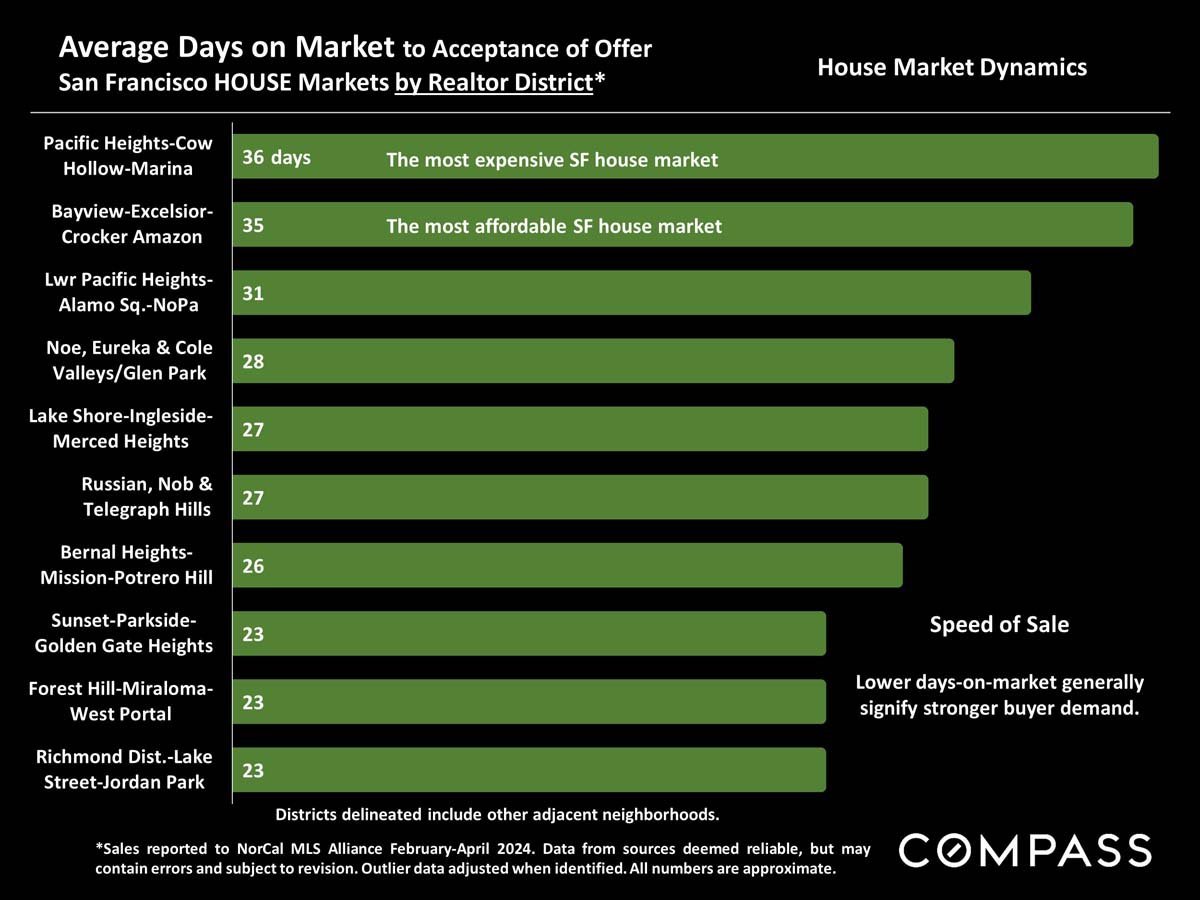
Bar chart comparing average days to accepted offer across ten San Francisco realtor districts, ranging from 23 to 36 days.
 
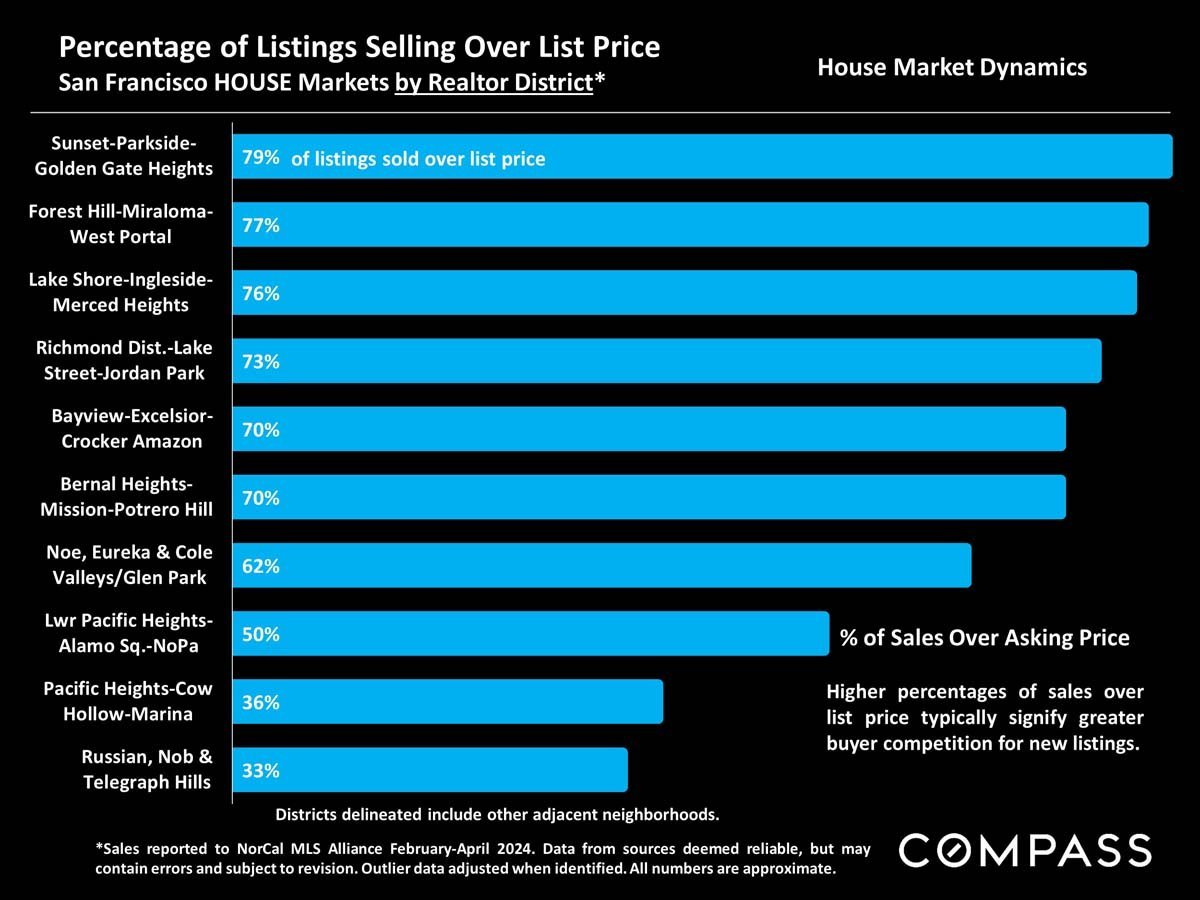
Chart of San Francisco home sales above list price by district, ranging from 79% in Sunset-Parkside to 33% in Russian Hill.
 
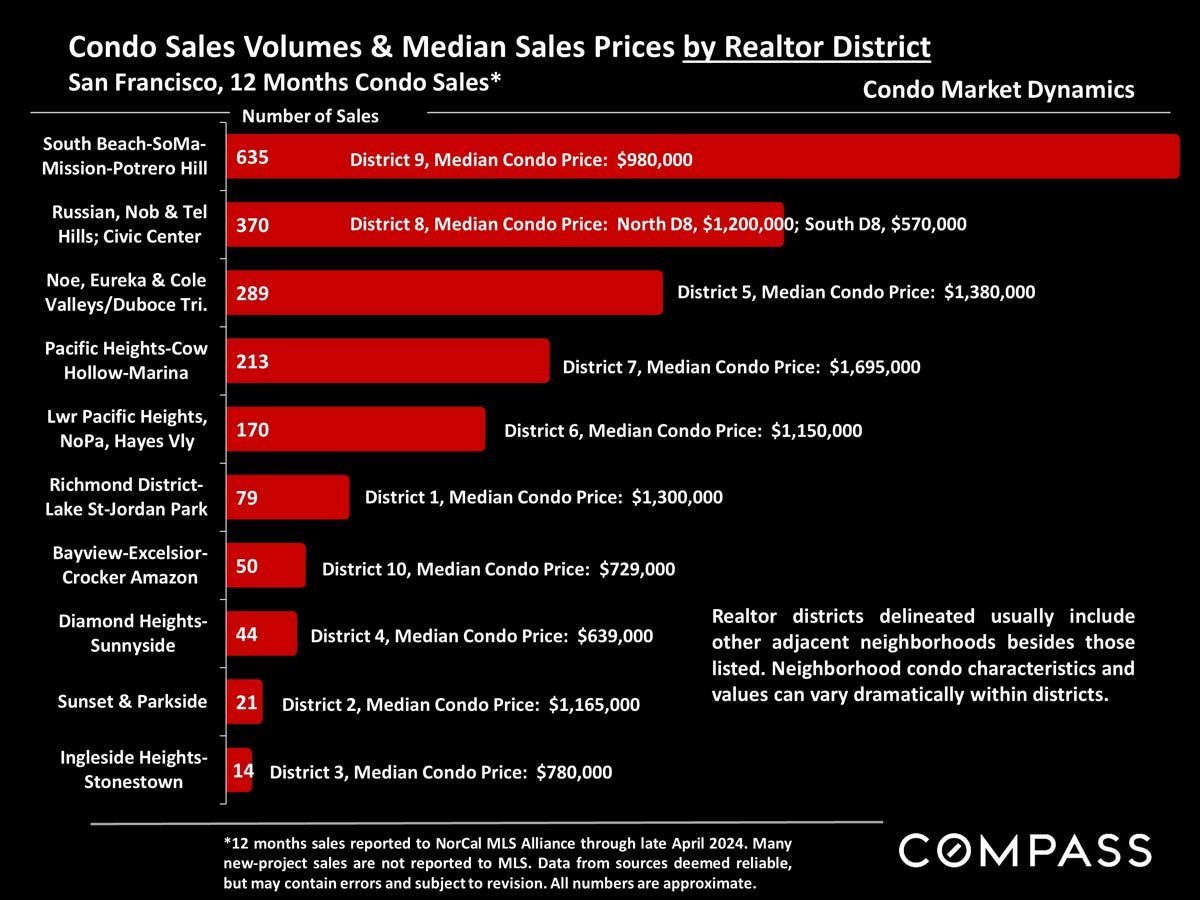
San Francisco condo sales and median prices by realtor district, shown as red bars with neighborhood labels and prices.
 
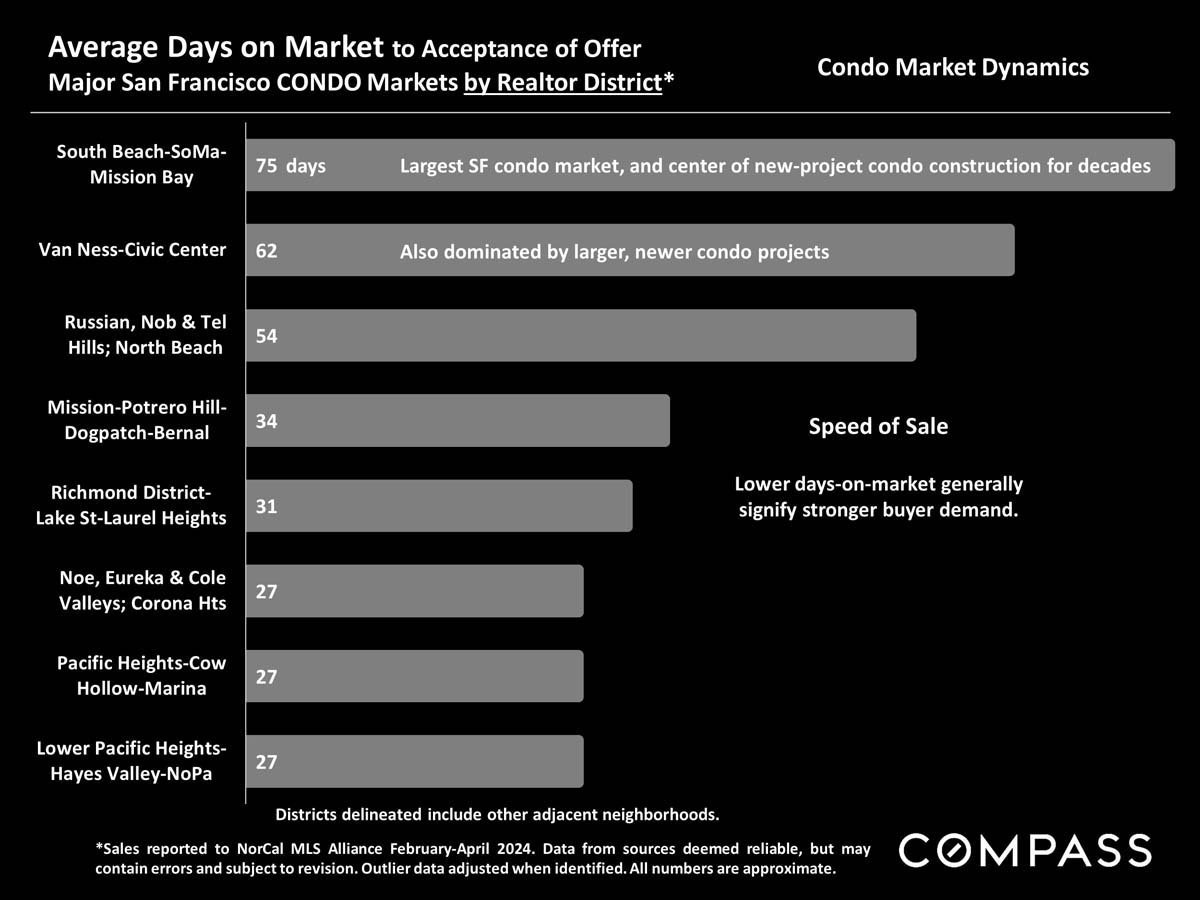
San Francisco condo days-on-market chart, with South Beach-SoMa-Mission Bay highest at 75 days.
 
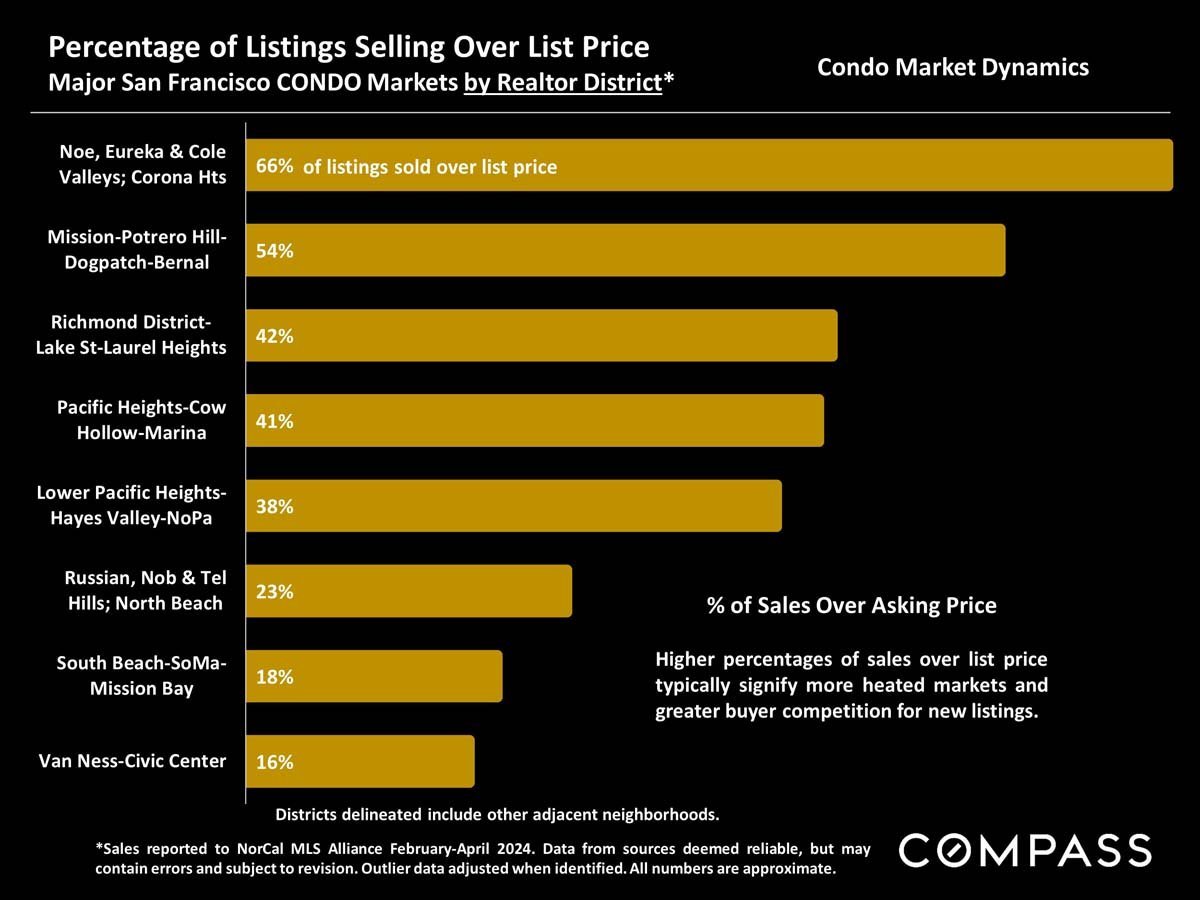
Bar chart comparing the share of San Francisco condo listings sold over asking price across eight districts.
 
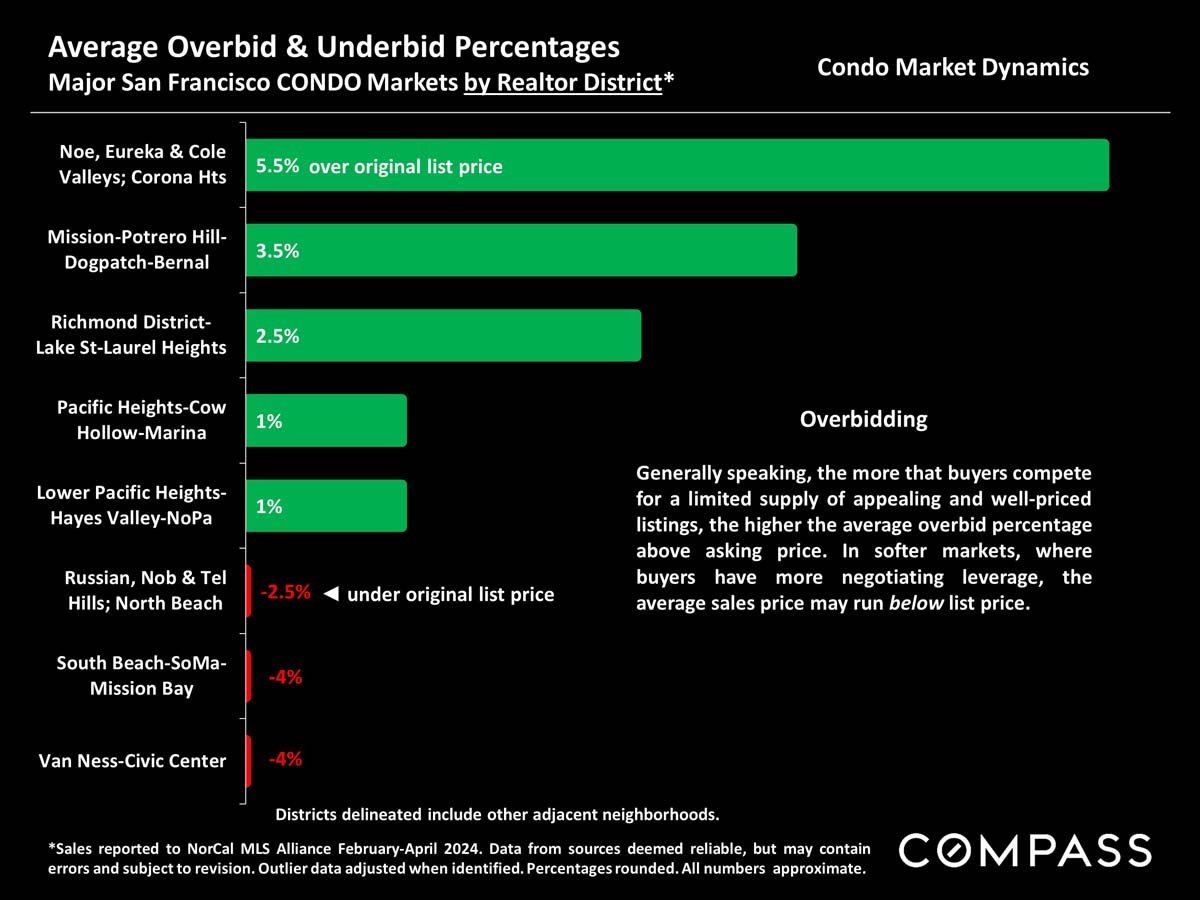
San Francisco condo overbid and underbid chart by district, ranging from 5.5% over asking to 4% under.
 
Real estate market statistics definitions and Compass report disclaimers.

Work With Jane

Get assistance in determining the current property value, crafting a competitive offer, writing and negotiating a contract, and much more. Contact me today.

Follow Me on Instagram