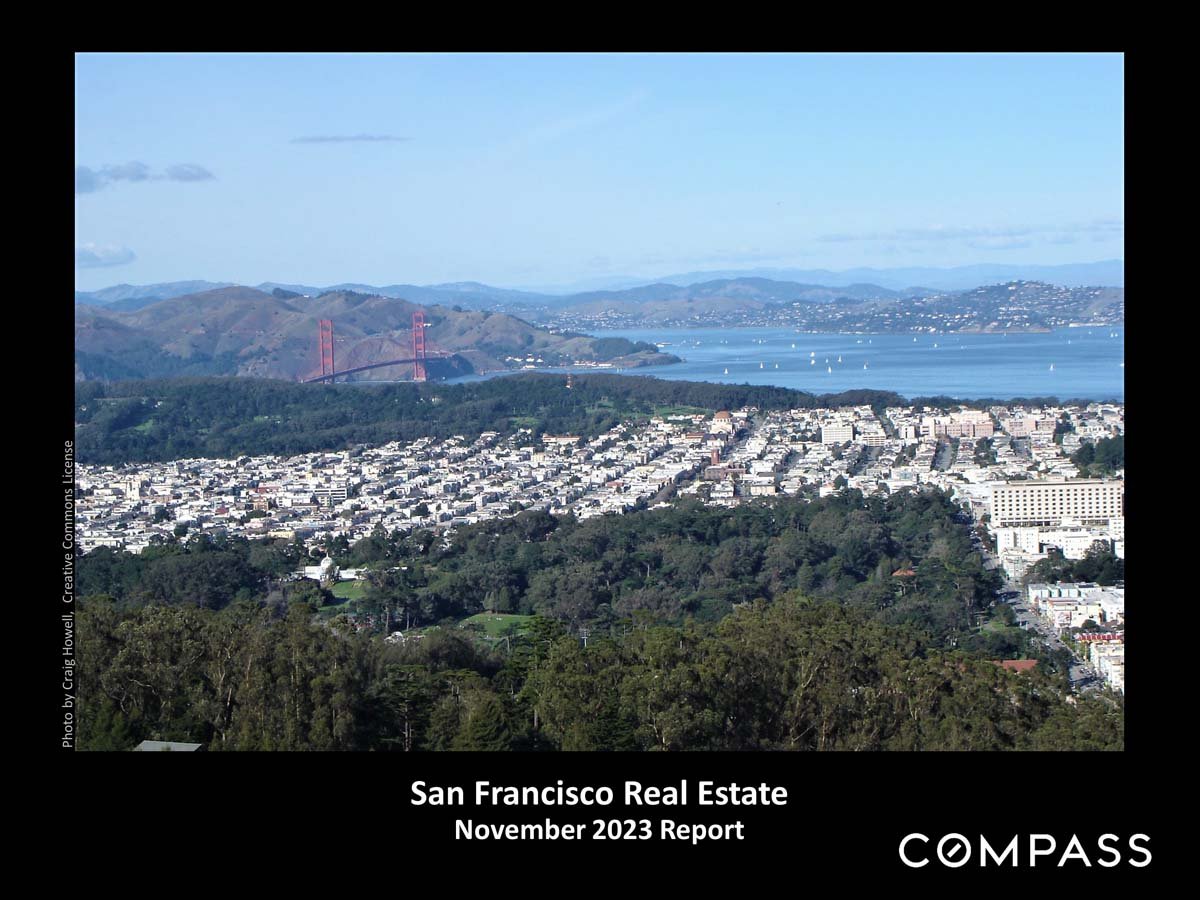
San Francisco real estate November 2023 report cover, with the Golden Gate Bridge and bay behind the city.

San Francisco Home Prices, Market Conditions & Trends November 2023

Rising Interest Rates Continued to Impact Supply and Demand in October, But Early November Brings Big Shift in Economic Indicators.
 
San Francisco real estate November 2023 report cover, with the Golden Gate Bridge and bay behind the city.
 
Compass market report on interest rates and housing trends in October and early November 2023.
 
Real estate market statistics disclaimer and definitions, followed by a Creative Commons credit and Compass legal disclosure.
 
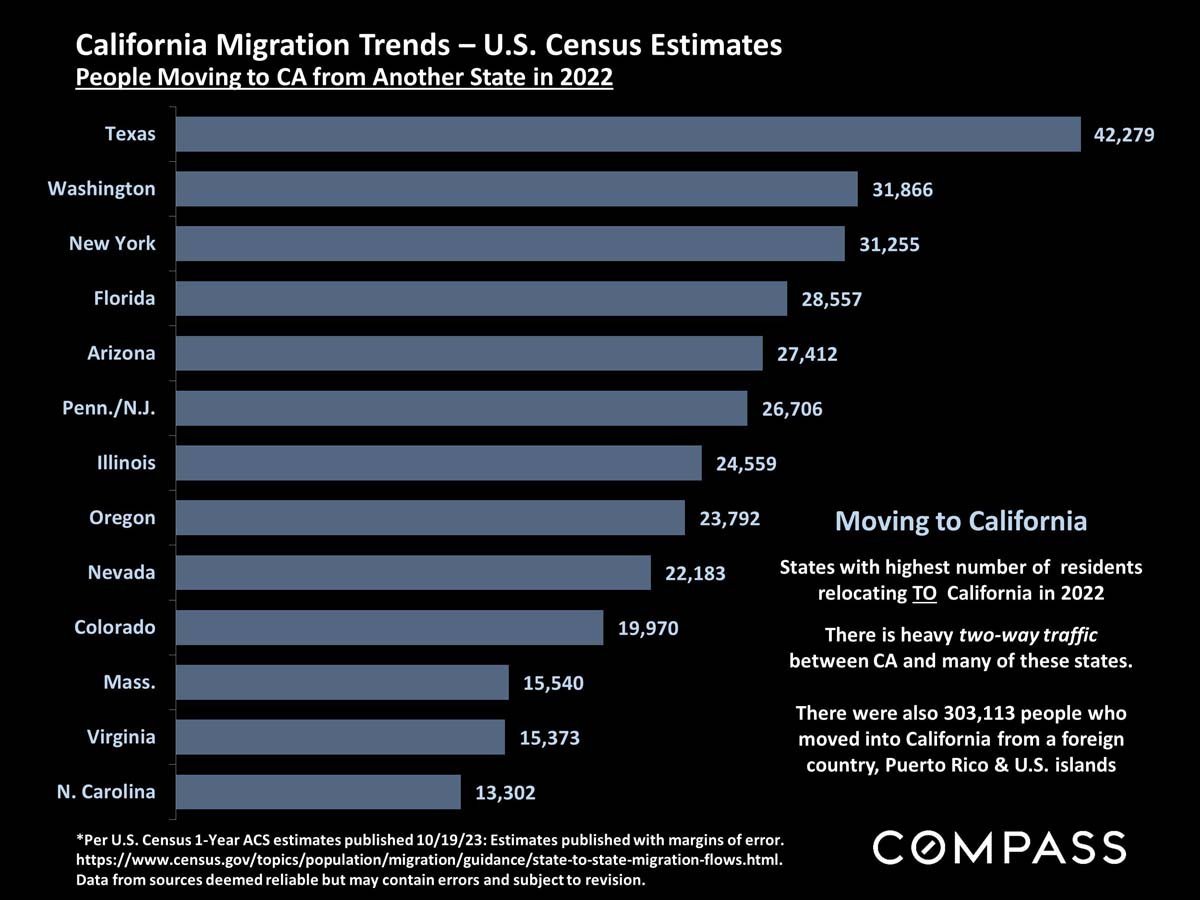
Infographic ranks states sending residents to California in 2022, with Texas leading at 42,279.
 
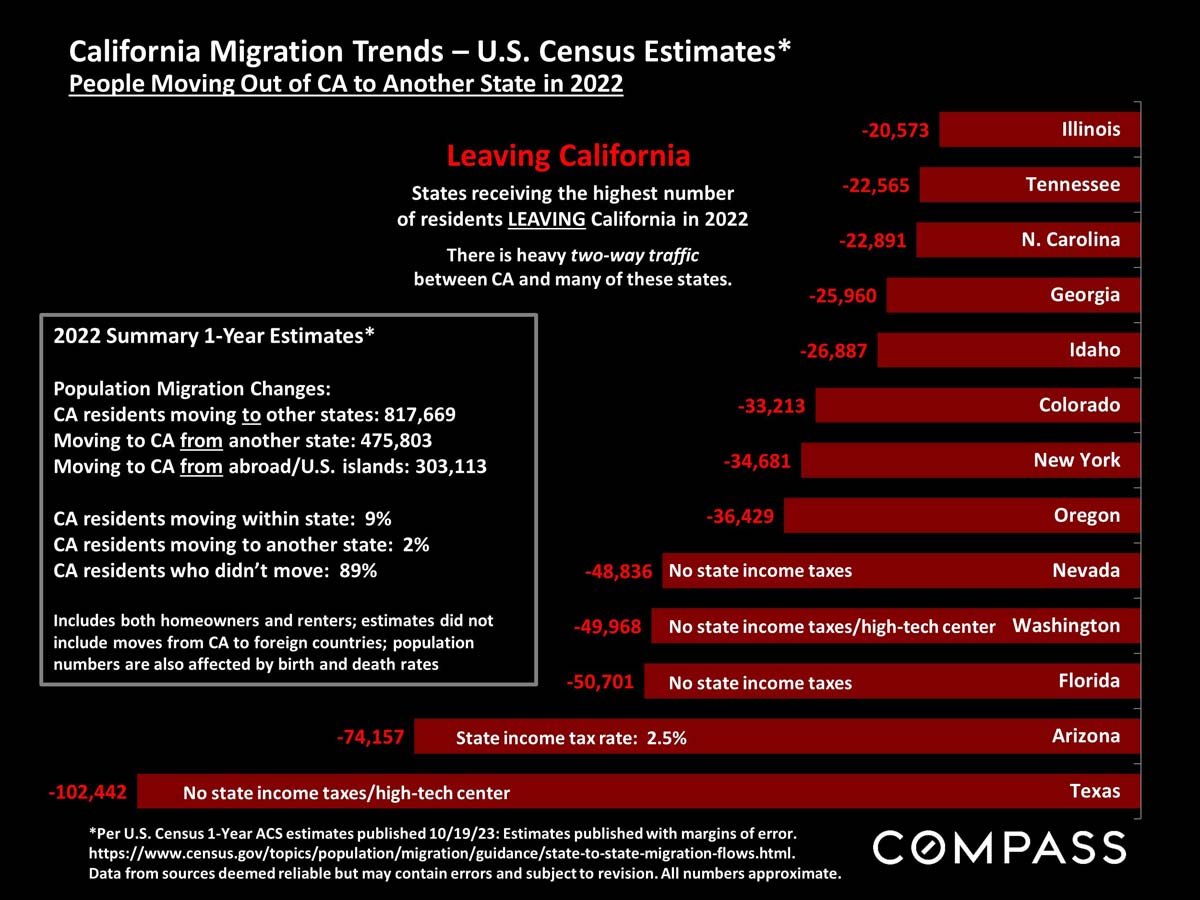
Infographic ranks states receiving people moving out of California in 2022, with a migration summary and red bars.
 
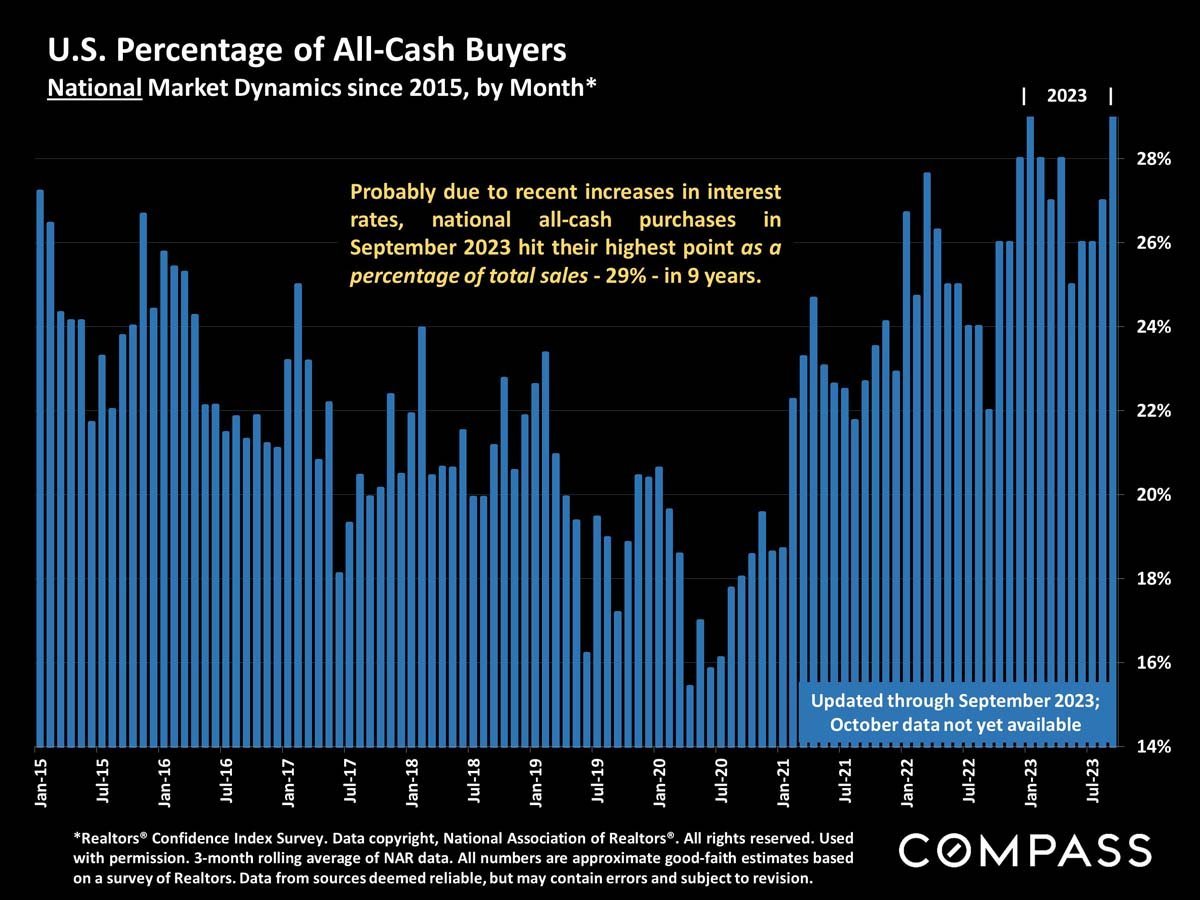
Chart of U.S. all-cash home buyers, with the September 2023 share reaching a nine-year high of 29%.
 
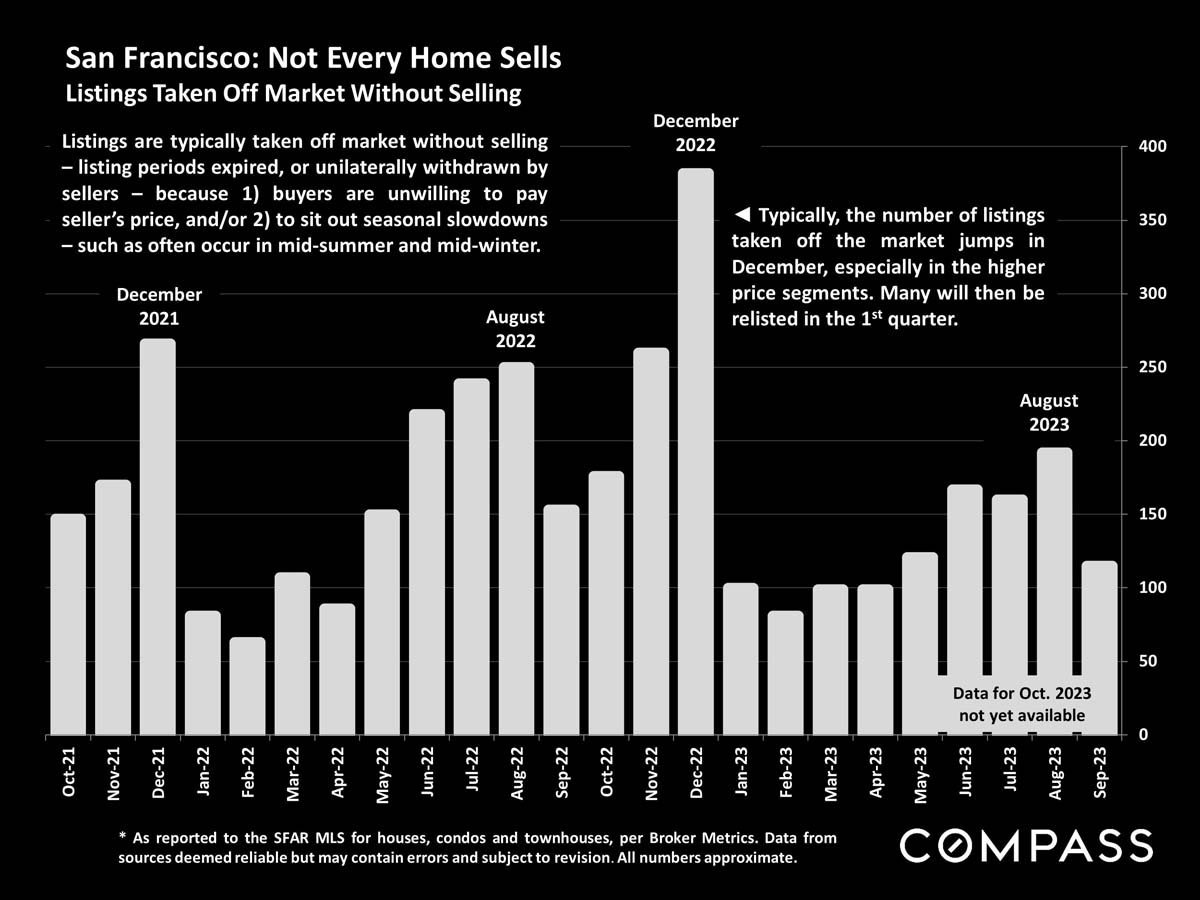
Chart of San Francisco listings taken off market without selling, with the highest count in December 2022.
 
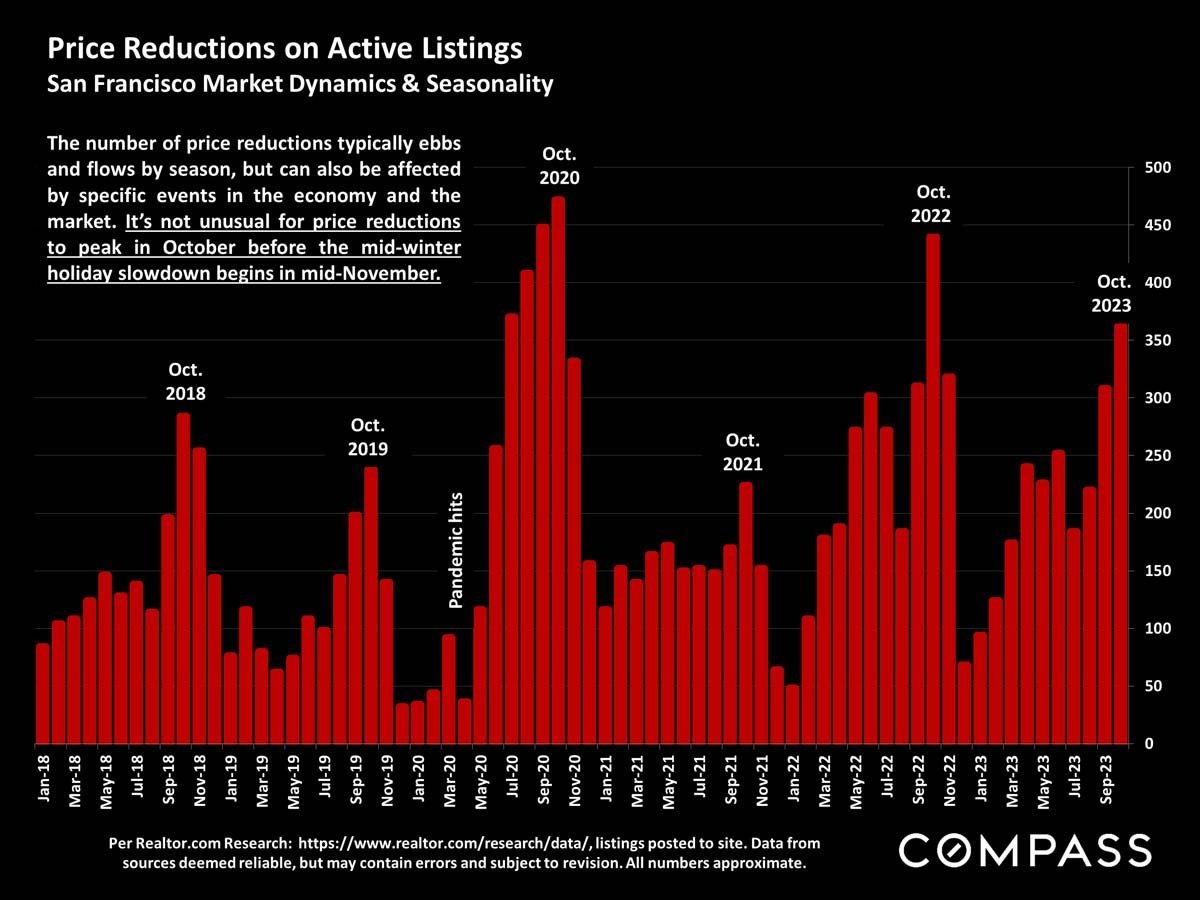
Bar chart of San Francisco active-listing price reductions, with October peaks from 2018 to 2023.
 
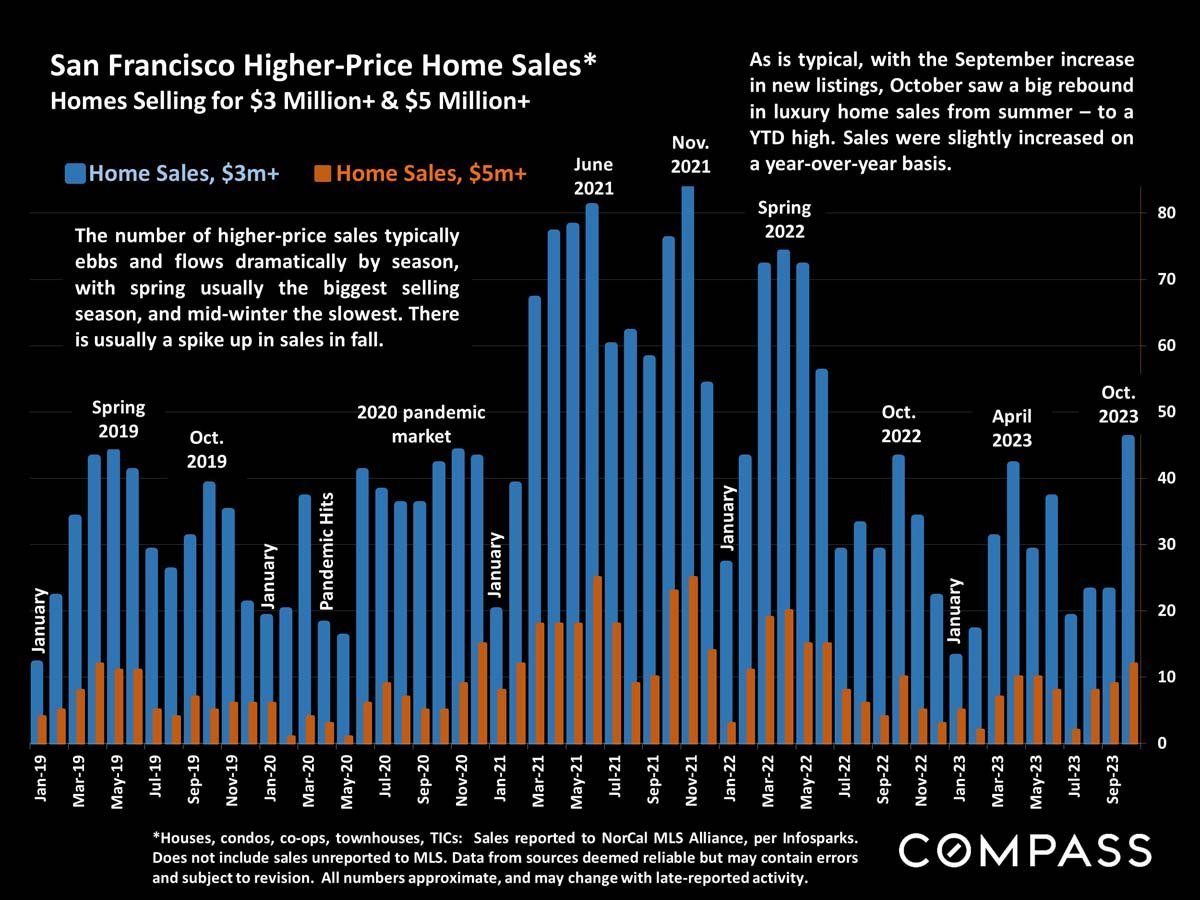
Chart comparing monthly San Francisco home sales above $3 million and $5 million, January 2019 to October 2023.
 
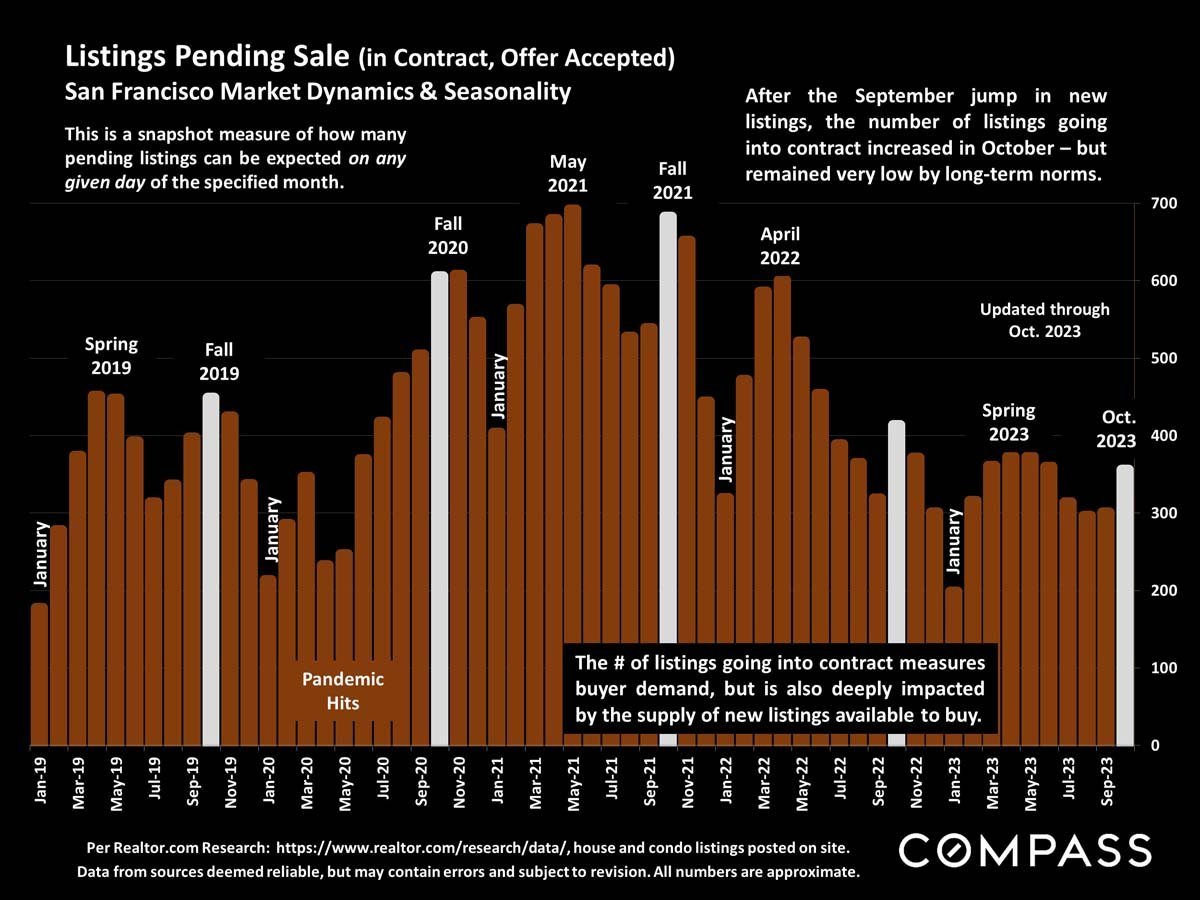
Bar chart of San Francisco pending listings, January 2019–October 2023, peaking in 2021 and declining to about 360.
 
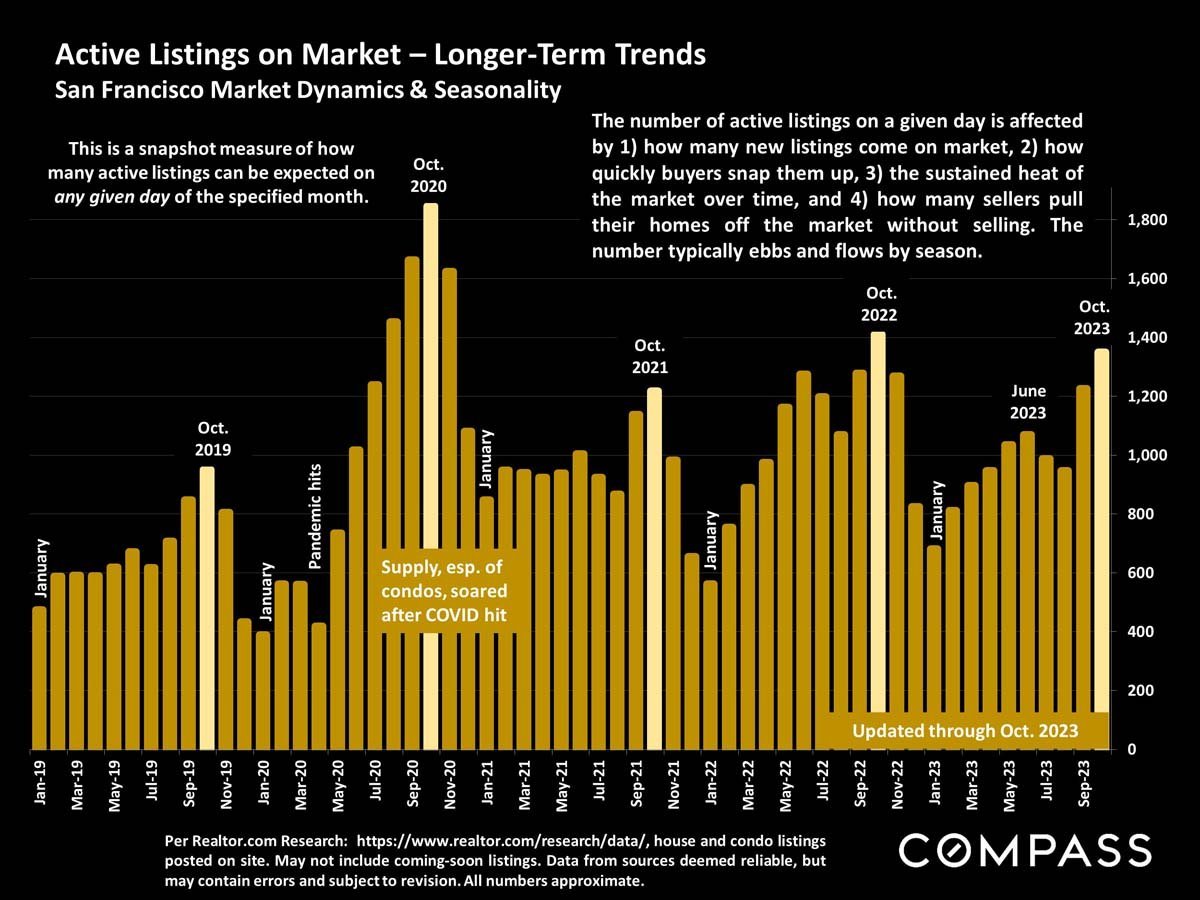
San Francisco active listings, January 2019–October 2023, peaked in October 2020.
 
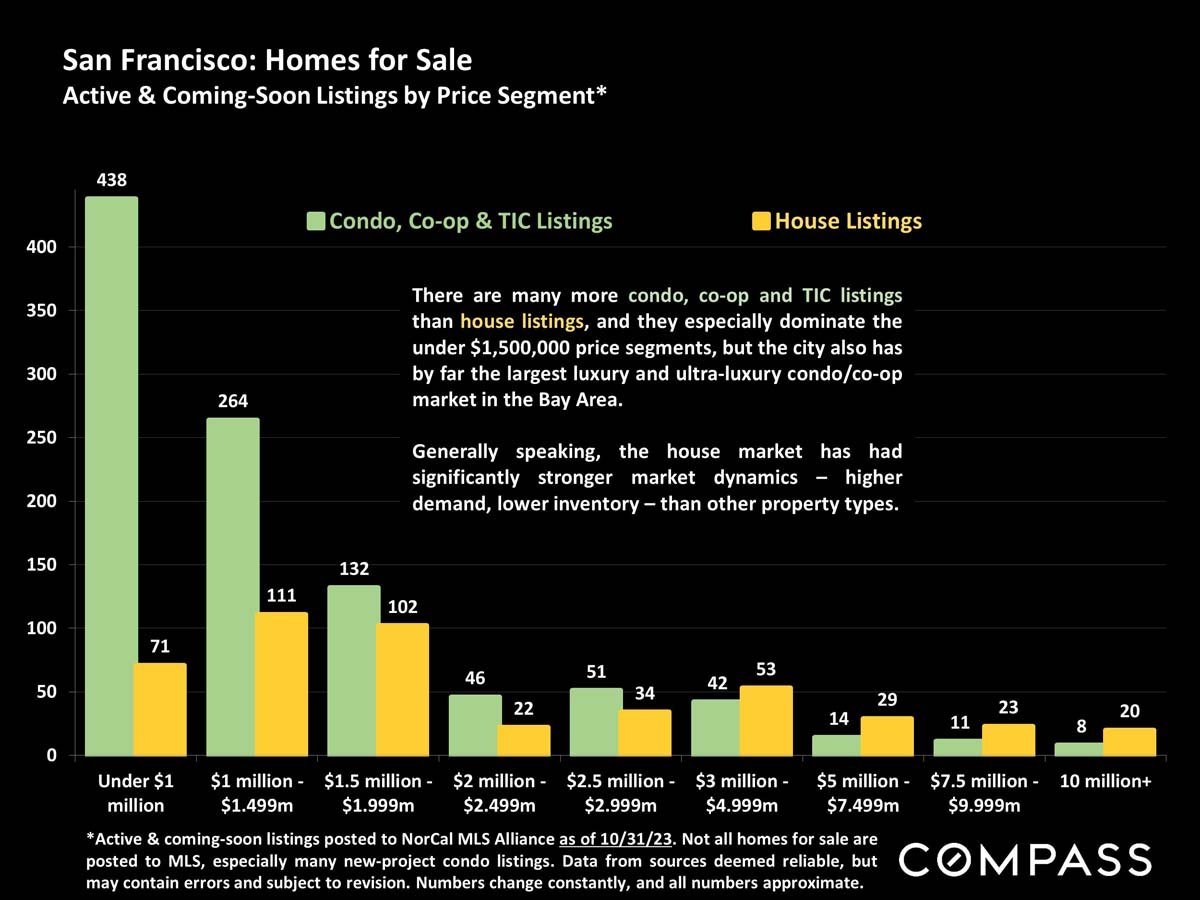
Chart comparing San Francisco condo and house listings by price segment, with counts and market notes.
 
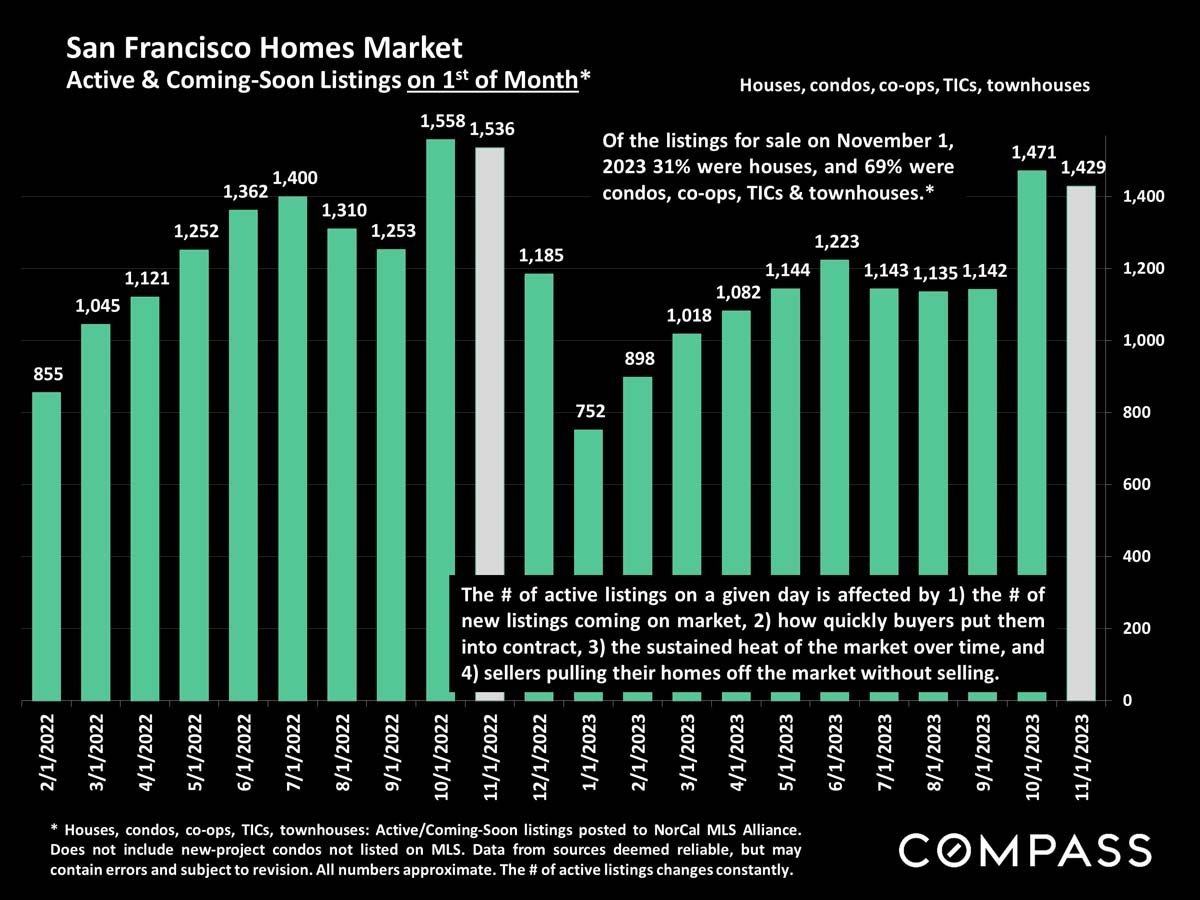
San Francisco active home listings chart from February 2022 to November 2023, with 1,429 listings in November.
 
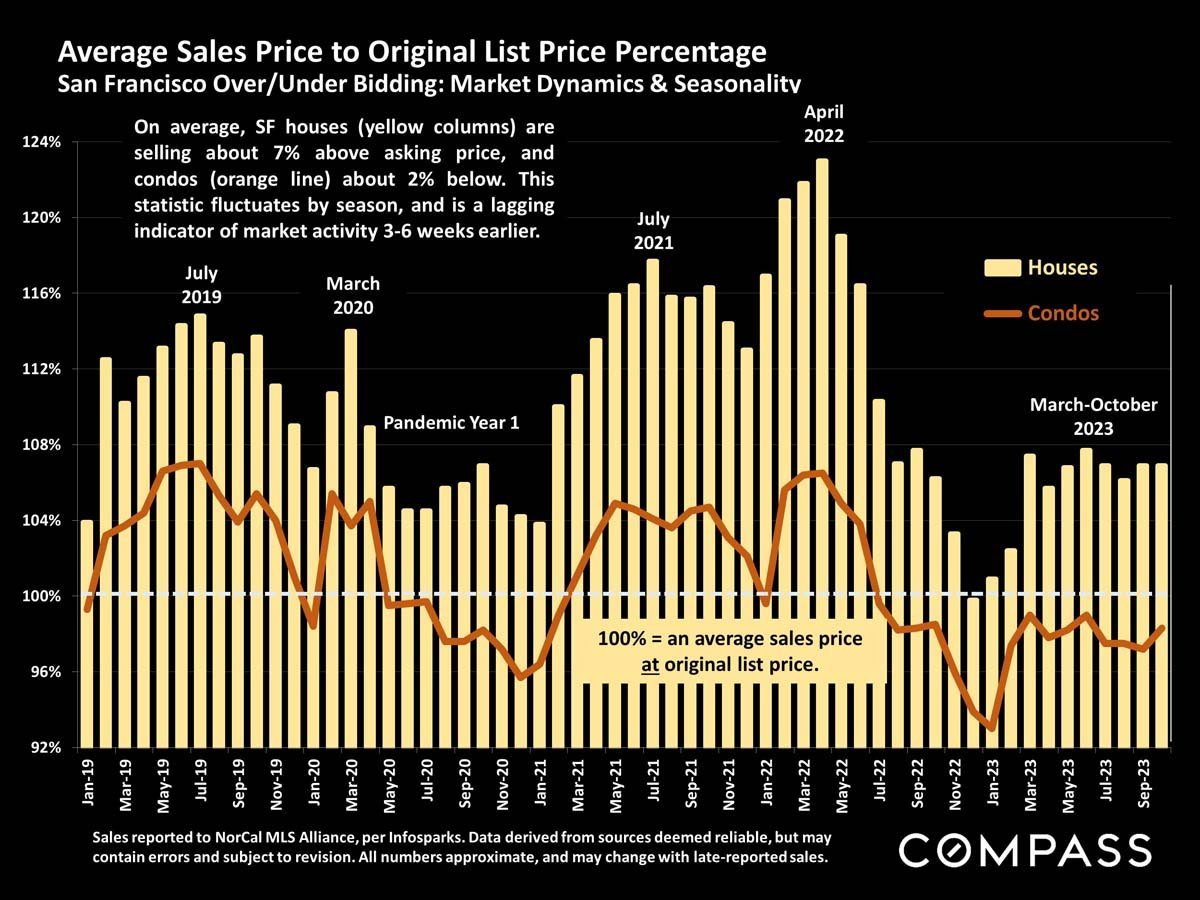
San Francisco home sale prices versus original list prices, 2019–2023; yellow bars show houses and the orange line shows condos.
 
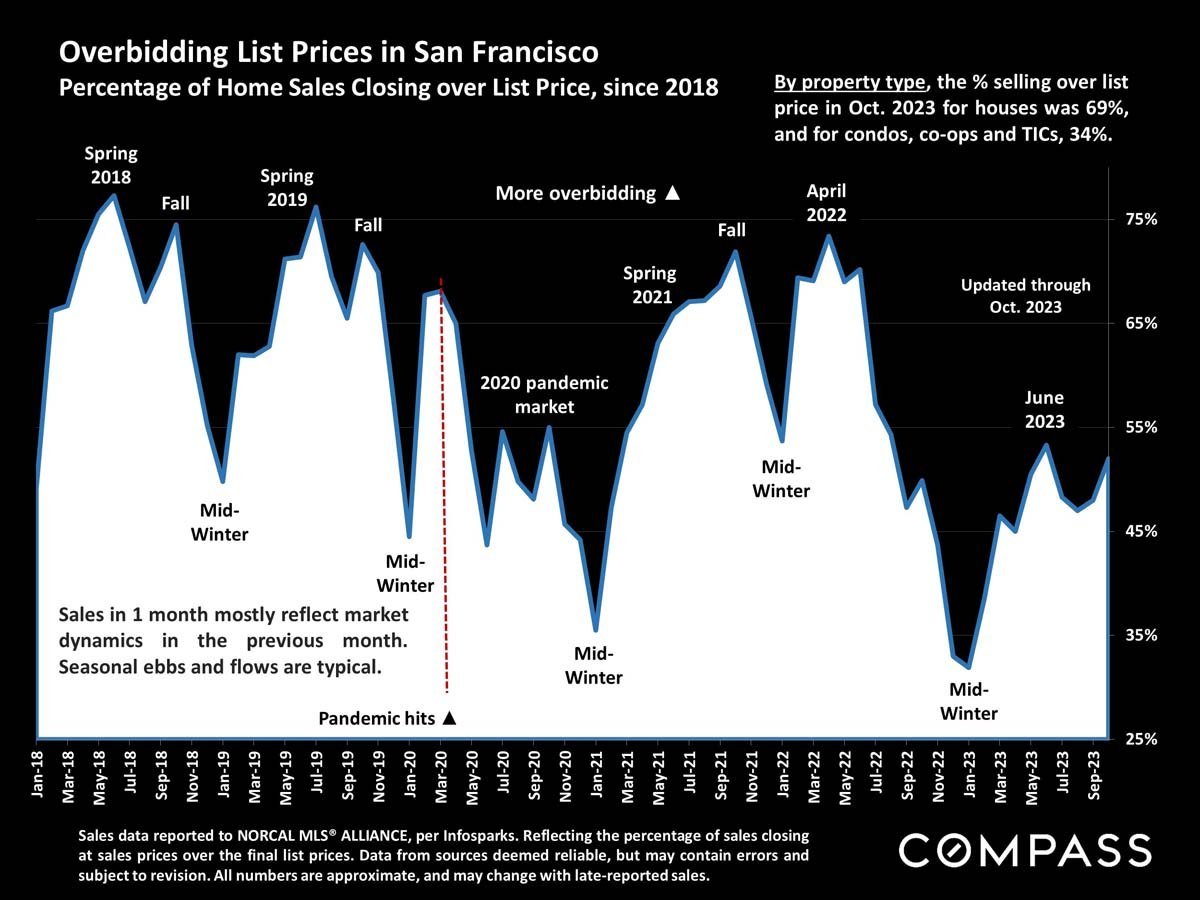
San Francisco chart of home sales closing over list price, with monthly trends from 2018 through 2023.
 
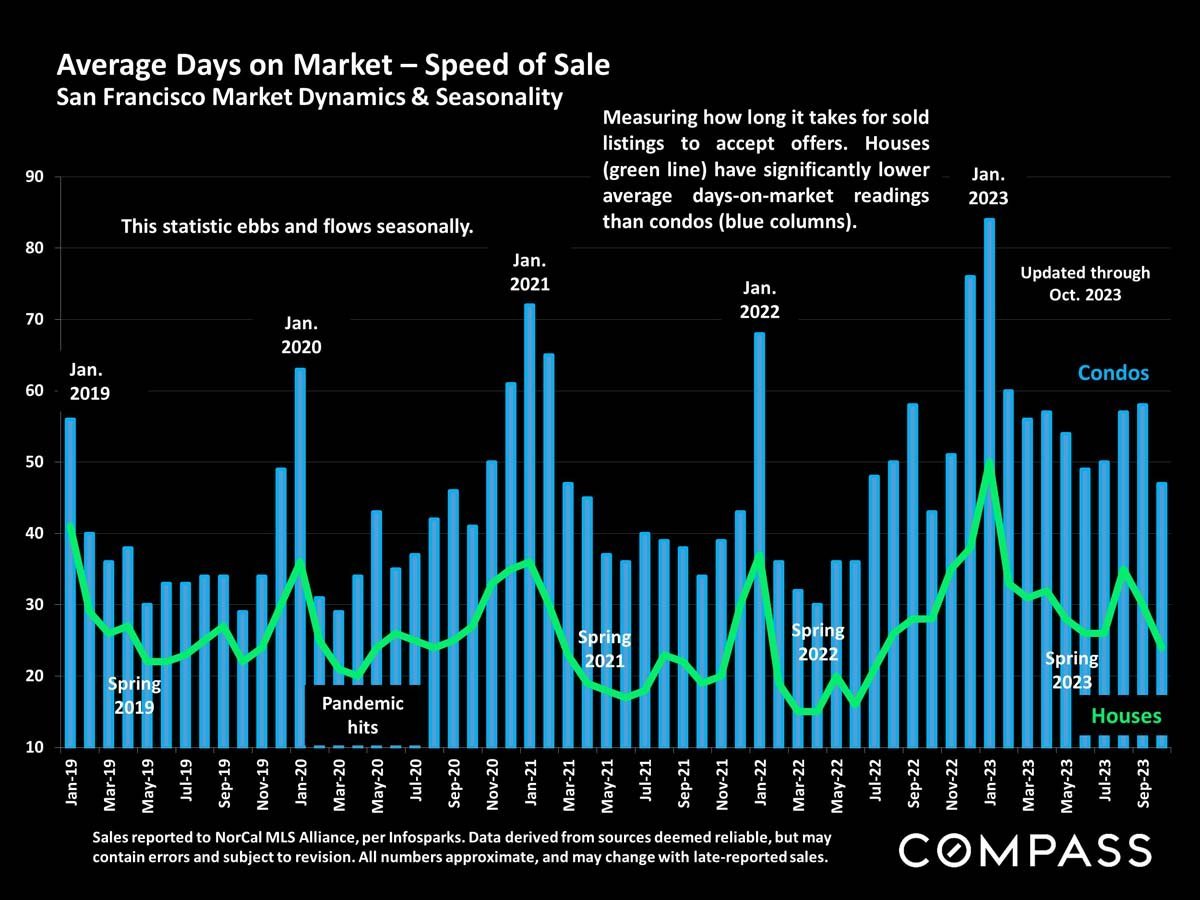
Chart compares San Francisco days on market for condos and houses from 2019 to 2023; houses generally sell faster.
 
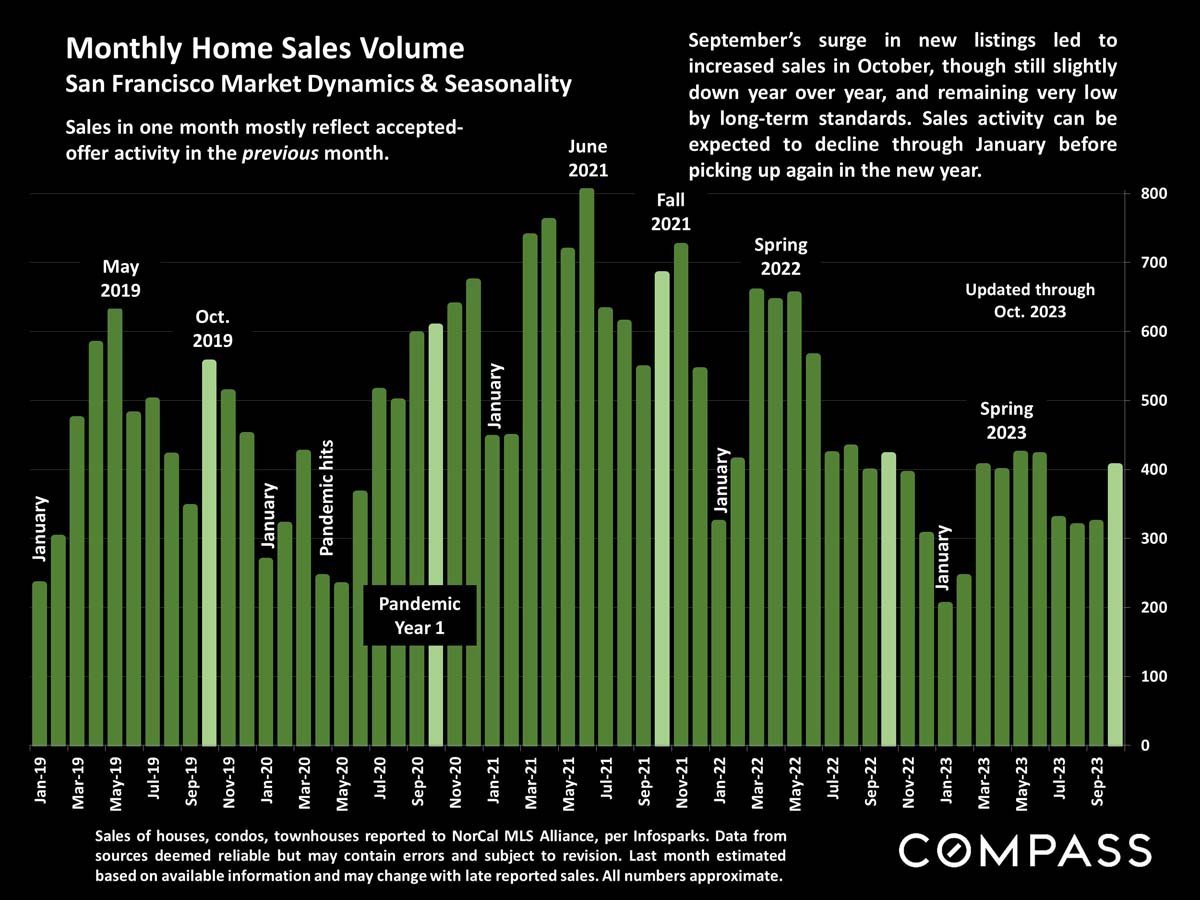
Bar chart of monthly San Francisco home sales, January 2019 to October 2023, with pandemic and seasonal annotations.
 
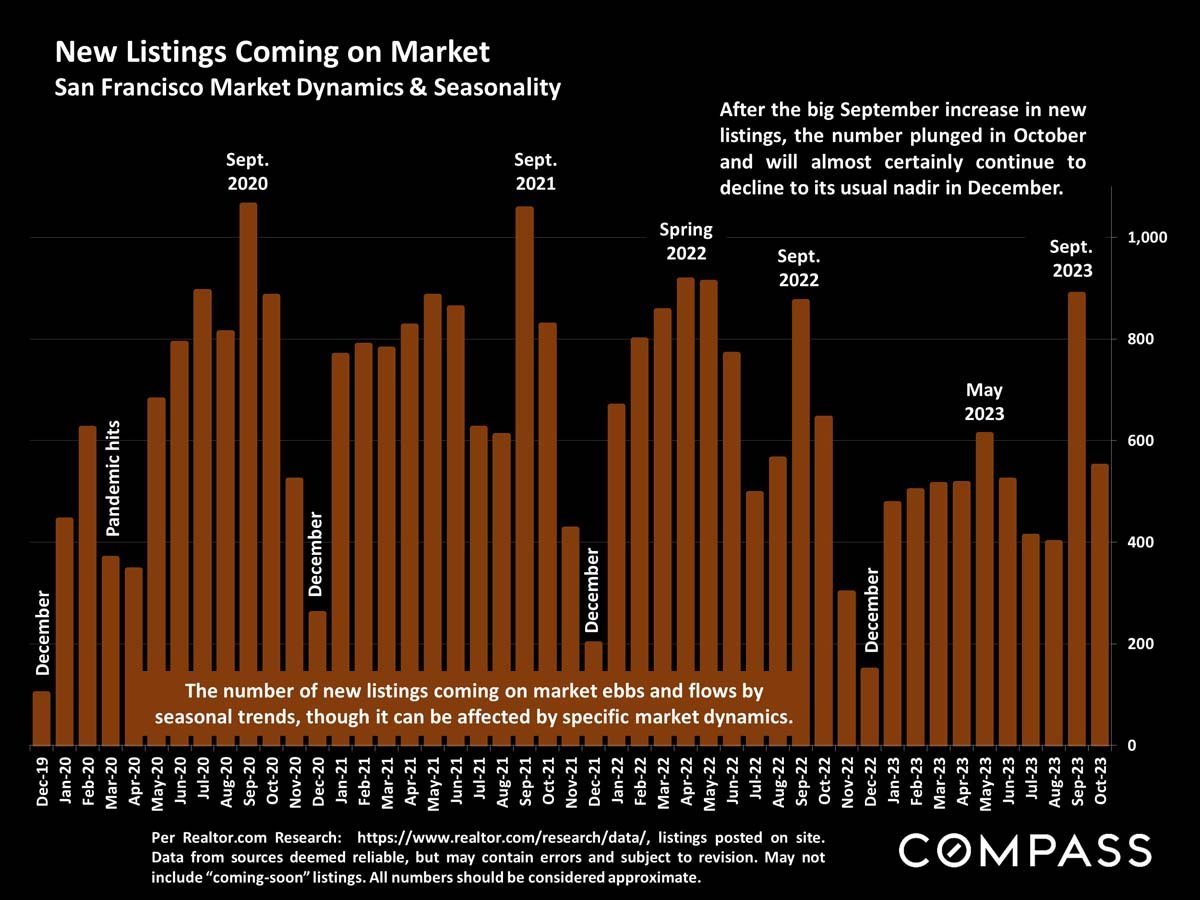
Bar chart showing San Francisco new listings from December 2019 to October 2023, with seasonal peaks.
 
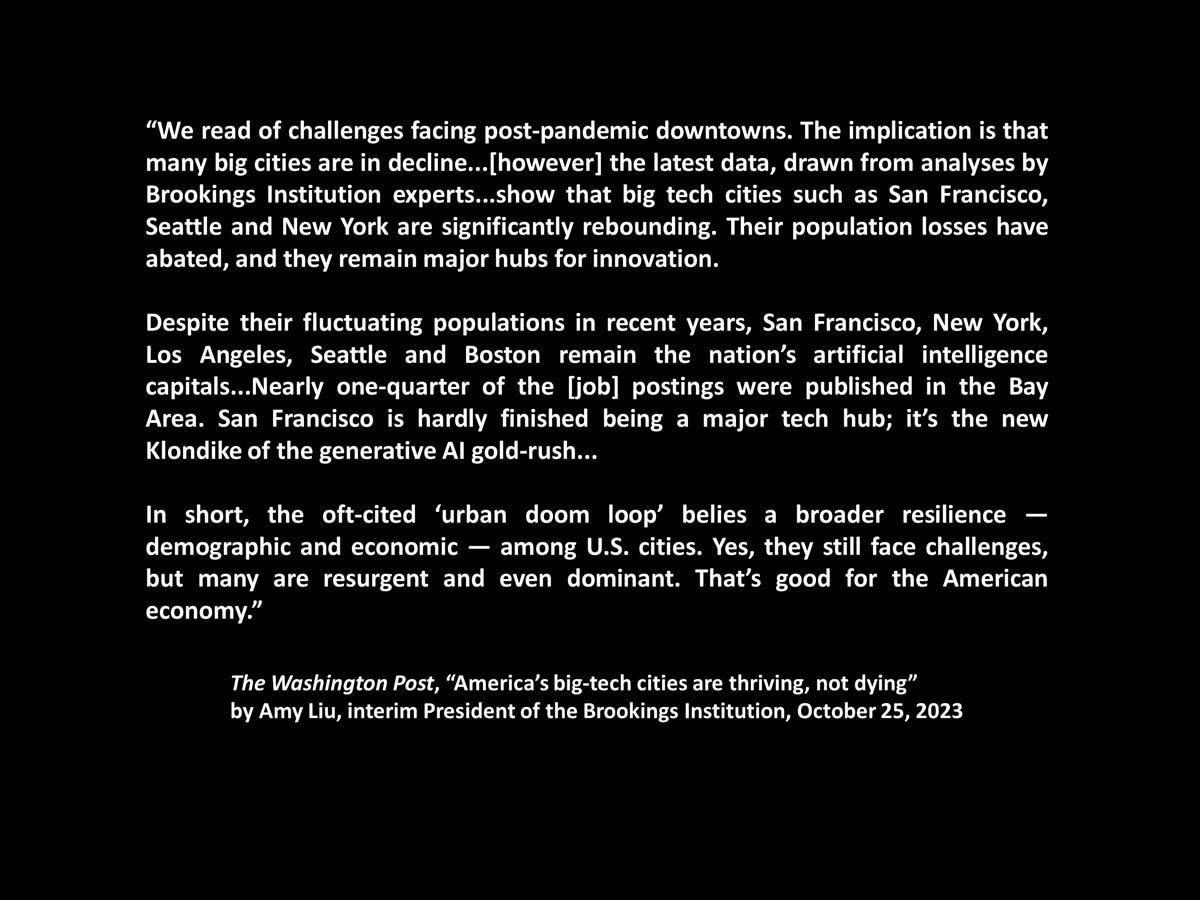
Quote on the rebound of San Francisco and other major tech cities, attributed to Amy Liu of the Brookings Institution.
 
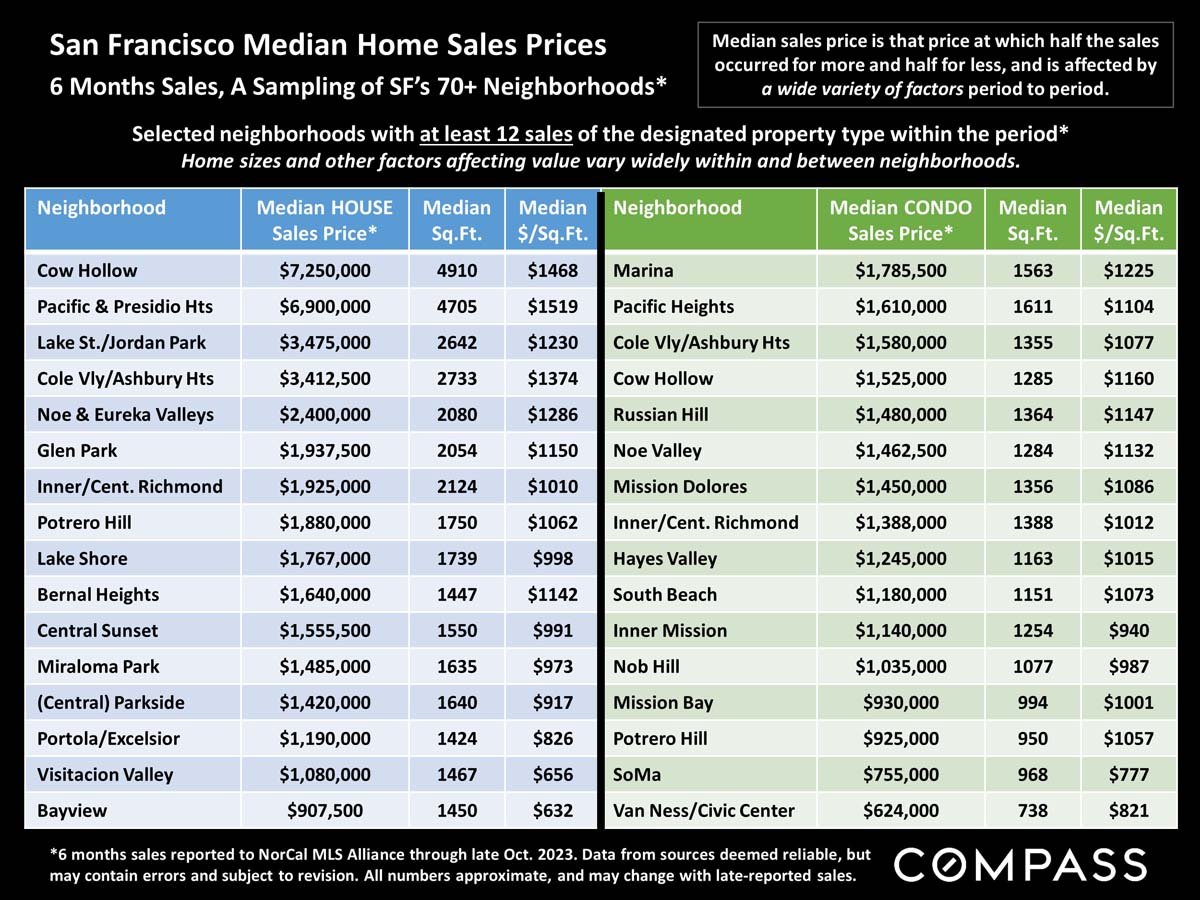
San Francisco house and condo sale prices by neighborhood, with median size and price per square foot.
 
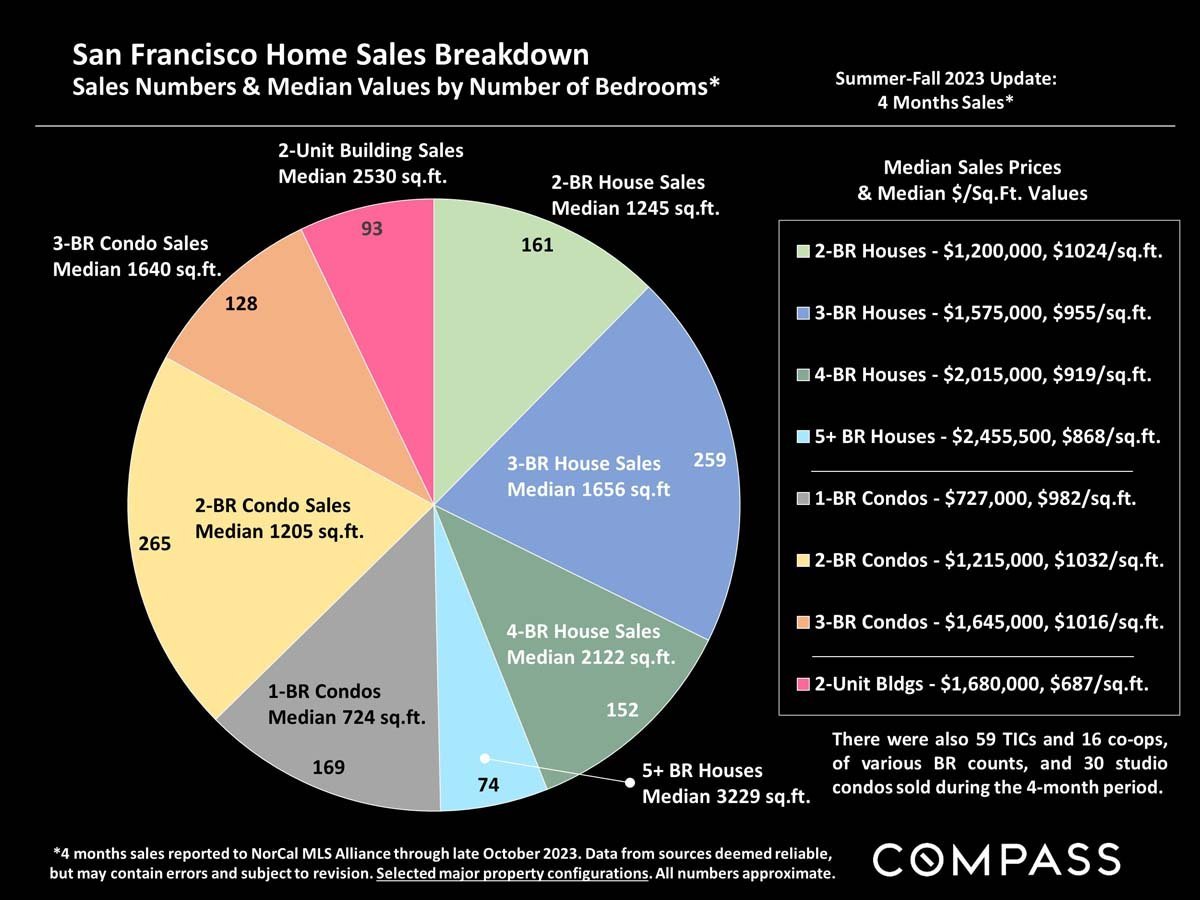
San Francisco home sales breakdown chart comparing sales counts, median square footage, prices, and price per square foot.
 
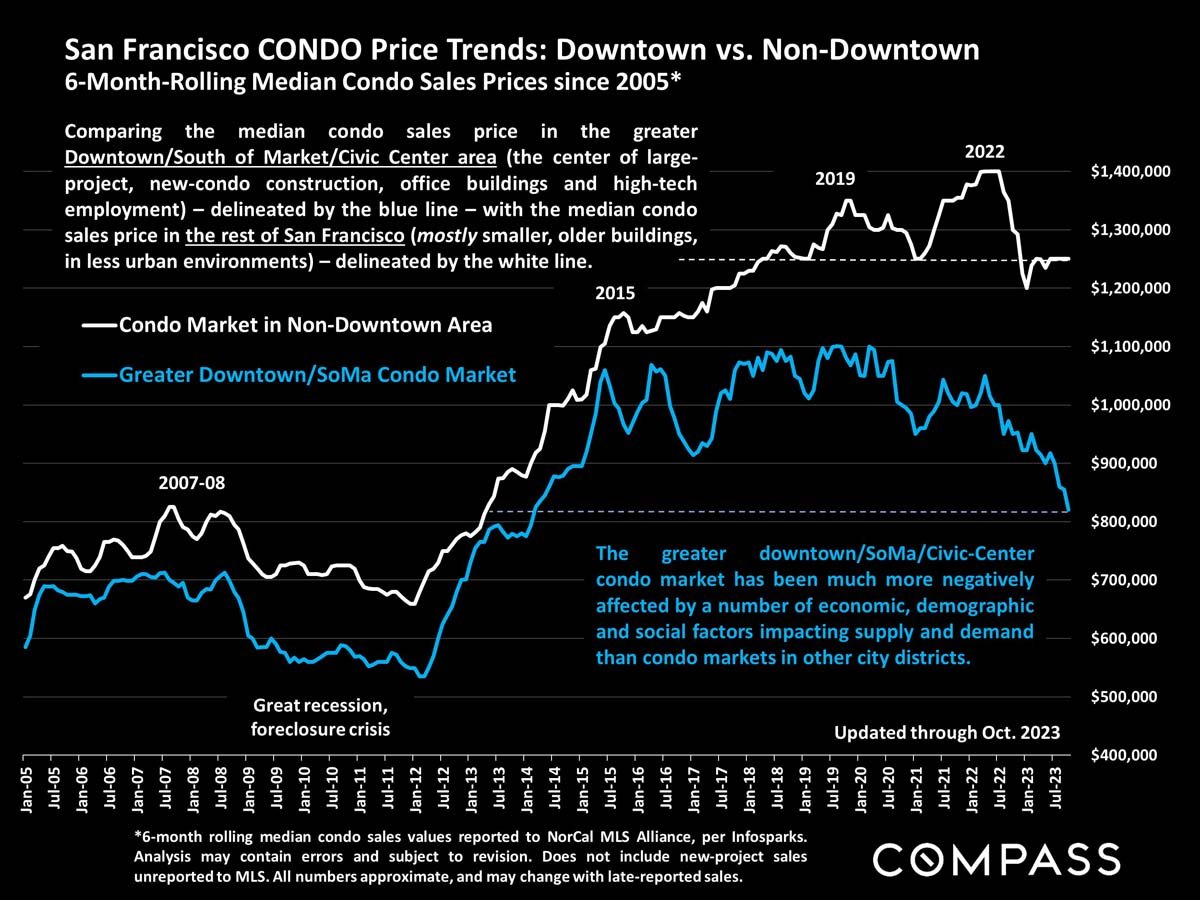
Chart comparing downtown and non-downtown San Francisco condo prices from 2005 to October 2023.
 
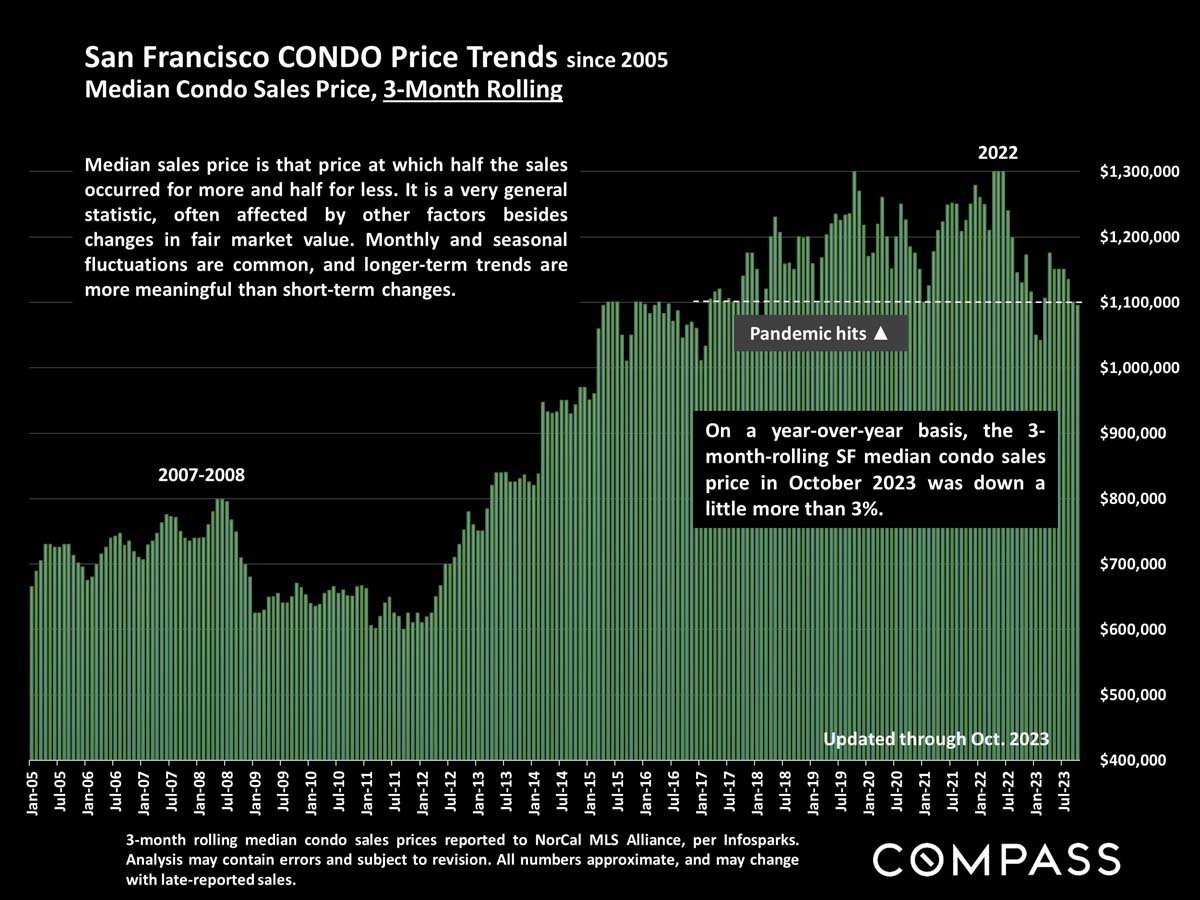
Chart of San Francisco condo prices since 2005, showing a year-over-year decline of just over 3% in October 2023.
 
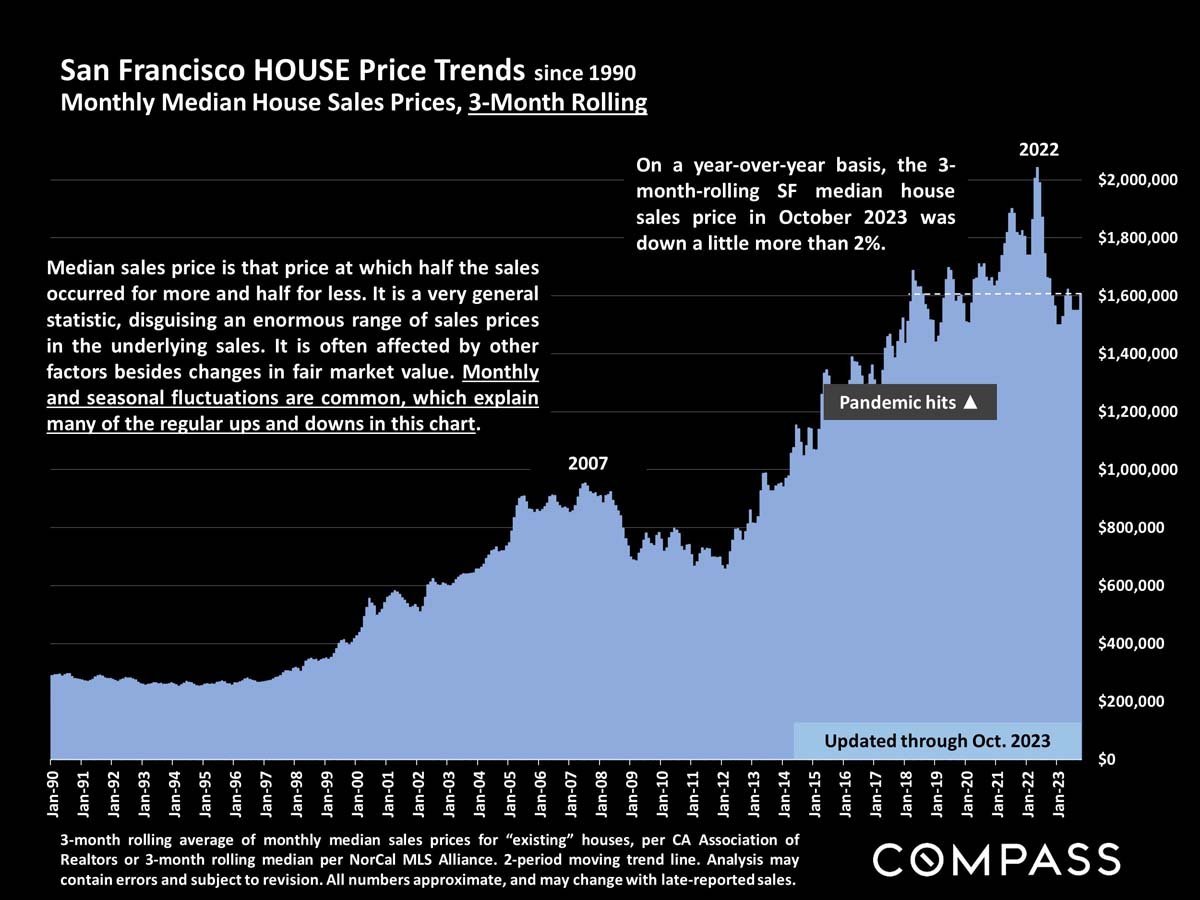
San Francisco home price trends chart, 1990–2023, showing a 2022 peak and a slight year-over-year decline.

Work With Jane

Get assistance in determining the current property value, crafting a competitive offer, writing and negotiating a contract, and much more. Contact me today.

Follow Me on Instagram