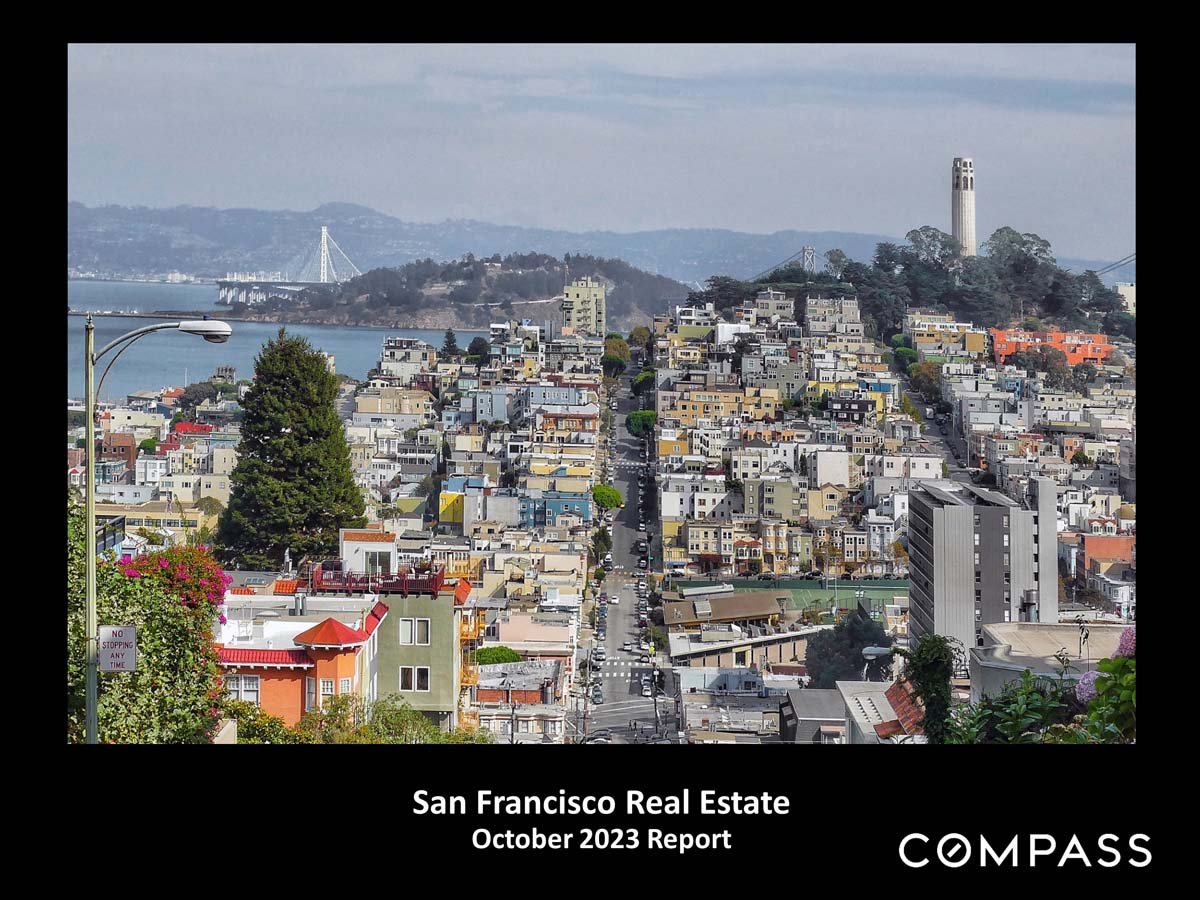
San Francisco real estate market report for October 2023.

San Francisco Home Prices, Market Conditions & Trends October 2023

Economic indicators have been challenging since the fall selling season began: Interest rates continued to rise through early October, and stock markets generally continued to fall from mid-summer, YTD highs.
 
San Francisco real estate market report for October 2023.
 
Real estate market report disclaimer explaining statistics, sales prices, square-foot calculations, and Compass legal terms.
 
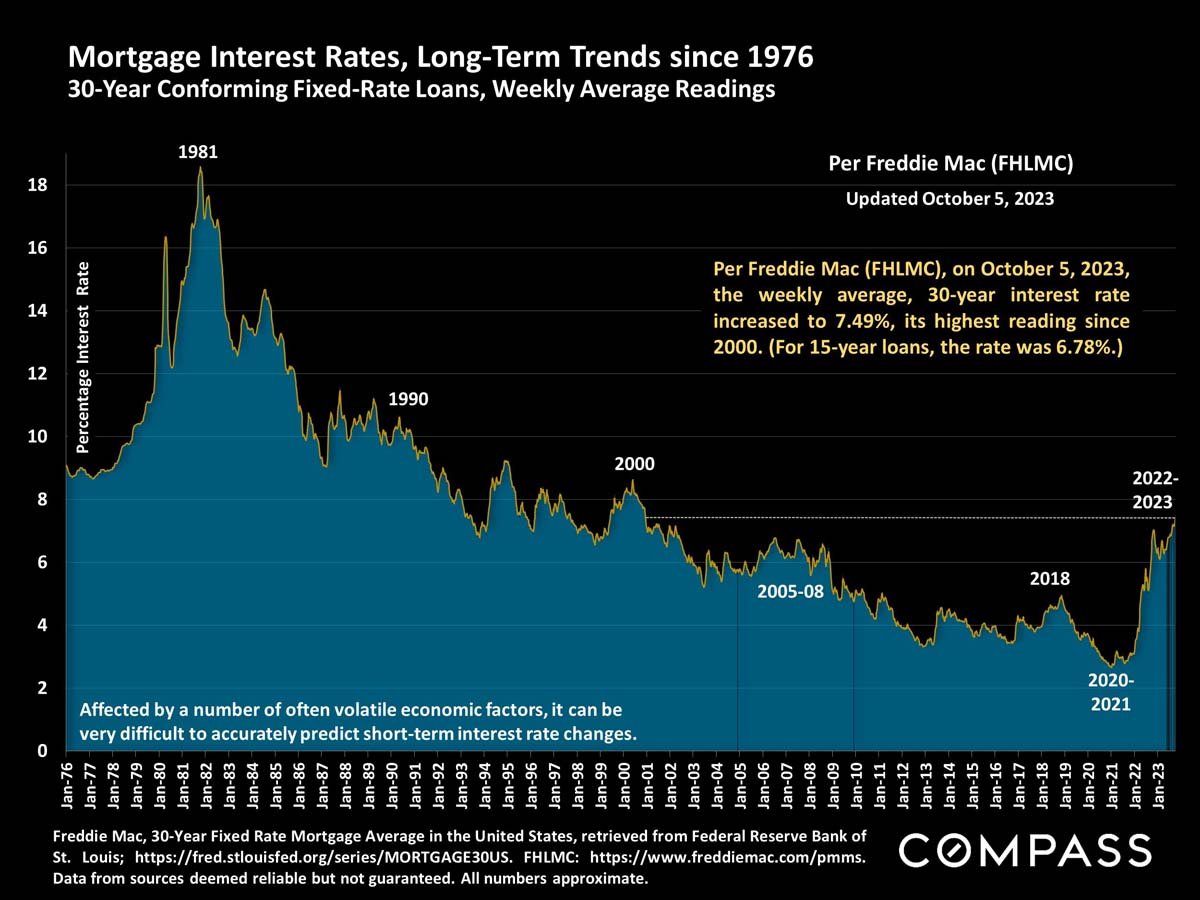
Chart of 30-year mortgage rates from 1976 to 2023, peaking in 1981 and rising sharply in 2022–2023.
 
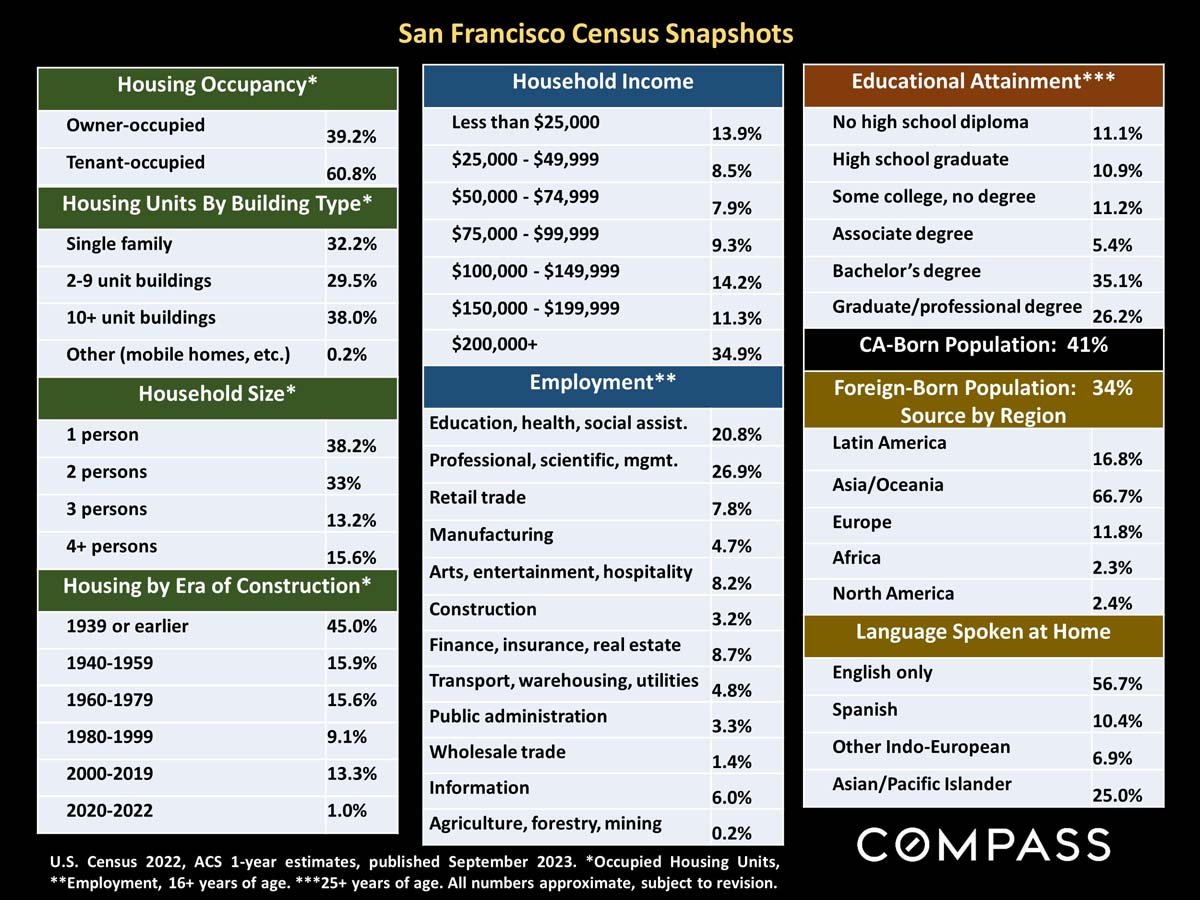
San Francisco Census Snapshots infographic with housing, income, employment, education, and demographic statistics.
 
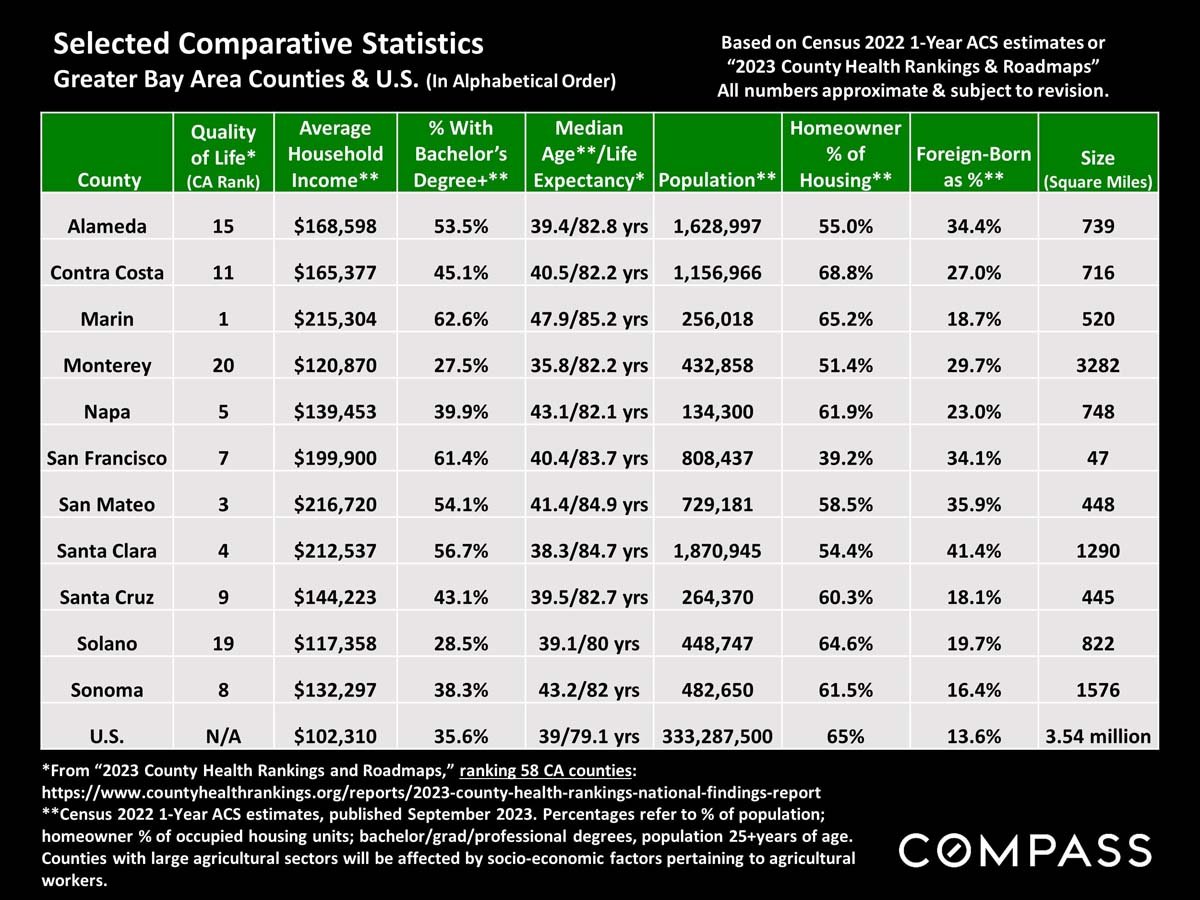
Comparative statistics table for Bay Area counties and the U.S., including San Francisco, with Compass branding.
 
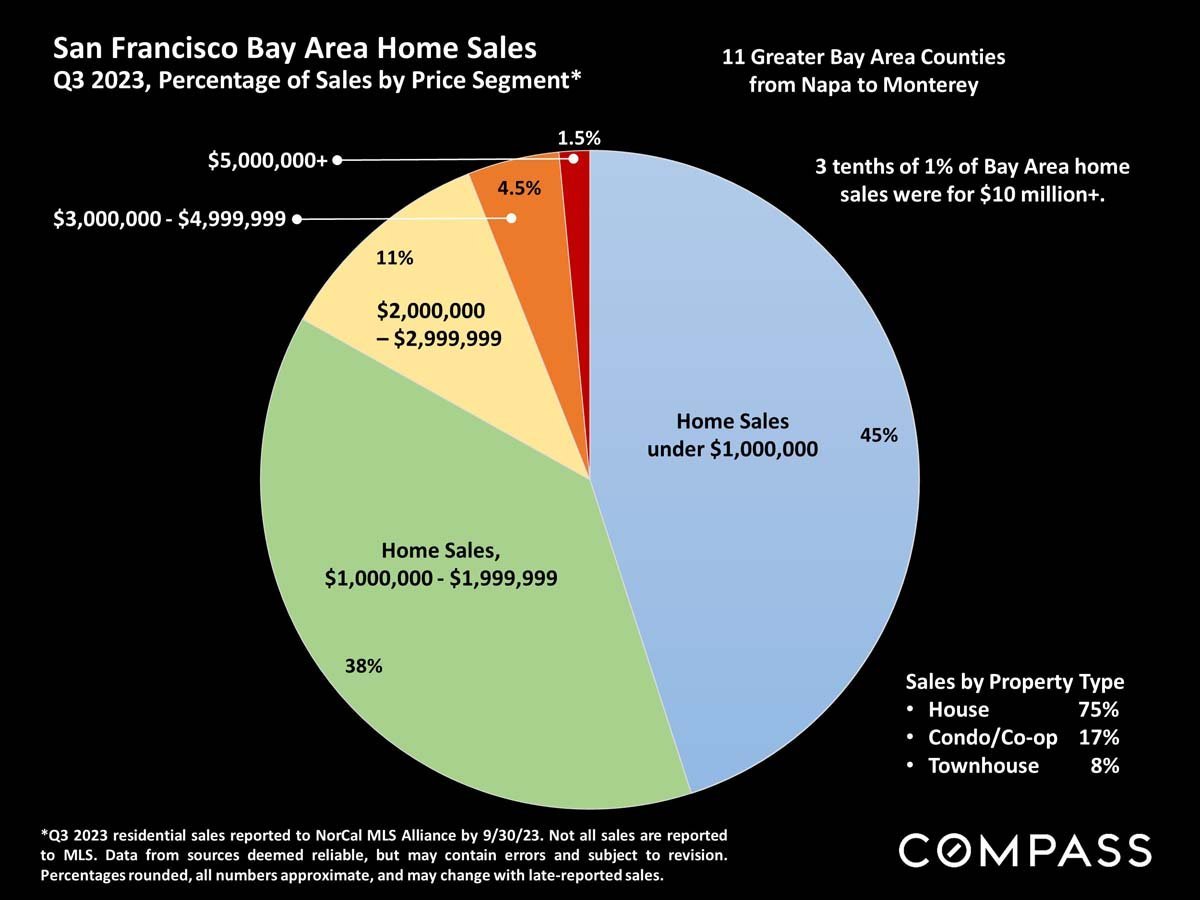
Bay Area Q3 2023 home sales pie chart by price segment, with property-type percentages.
 
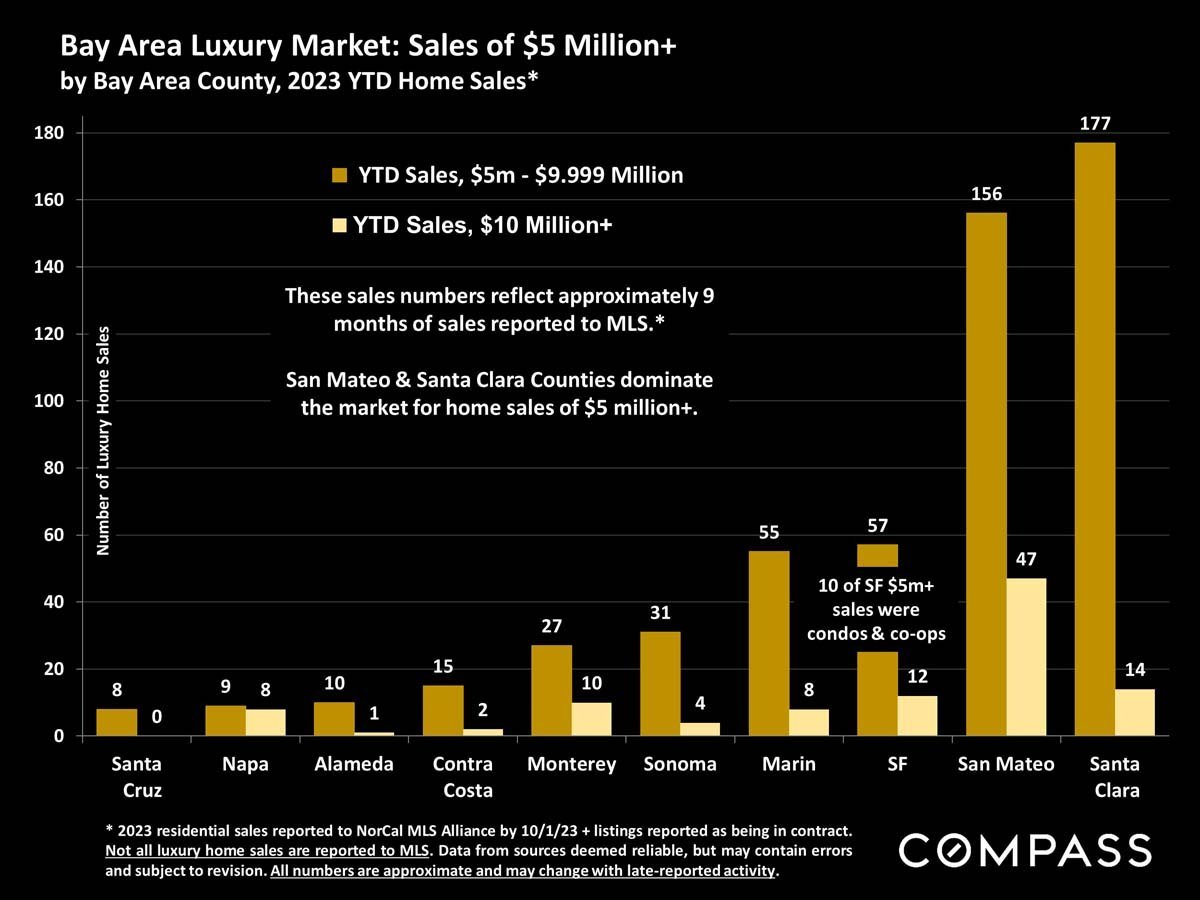
Bar chart comparing Bay Area county home sales of $5 million or more; San Mateo and Santa Clara lead.
 
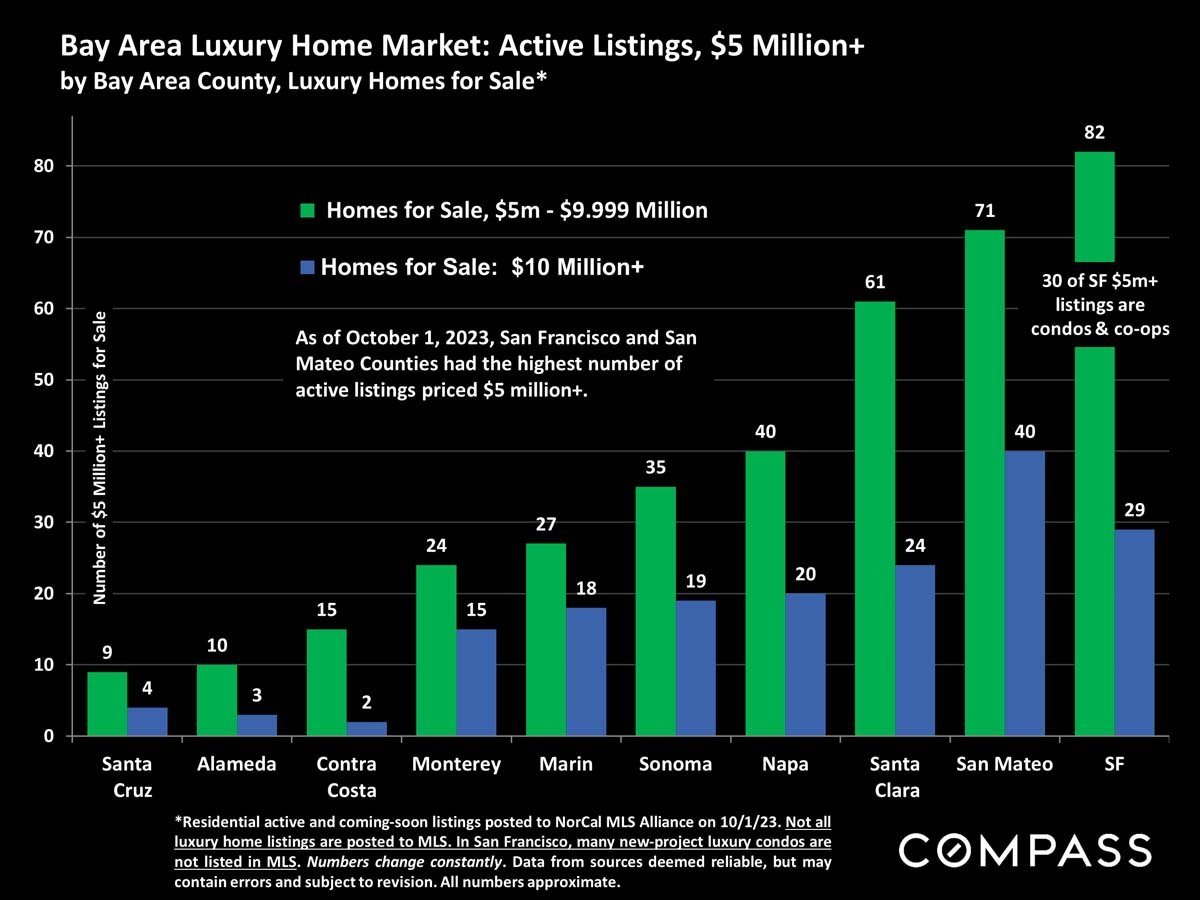
Chart comparing active $5 million-plus luxury home listings across Bay Area counties in October 2023.
 
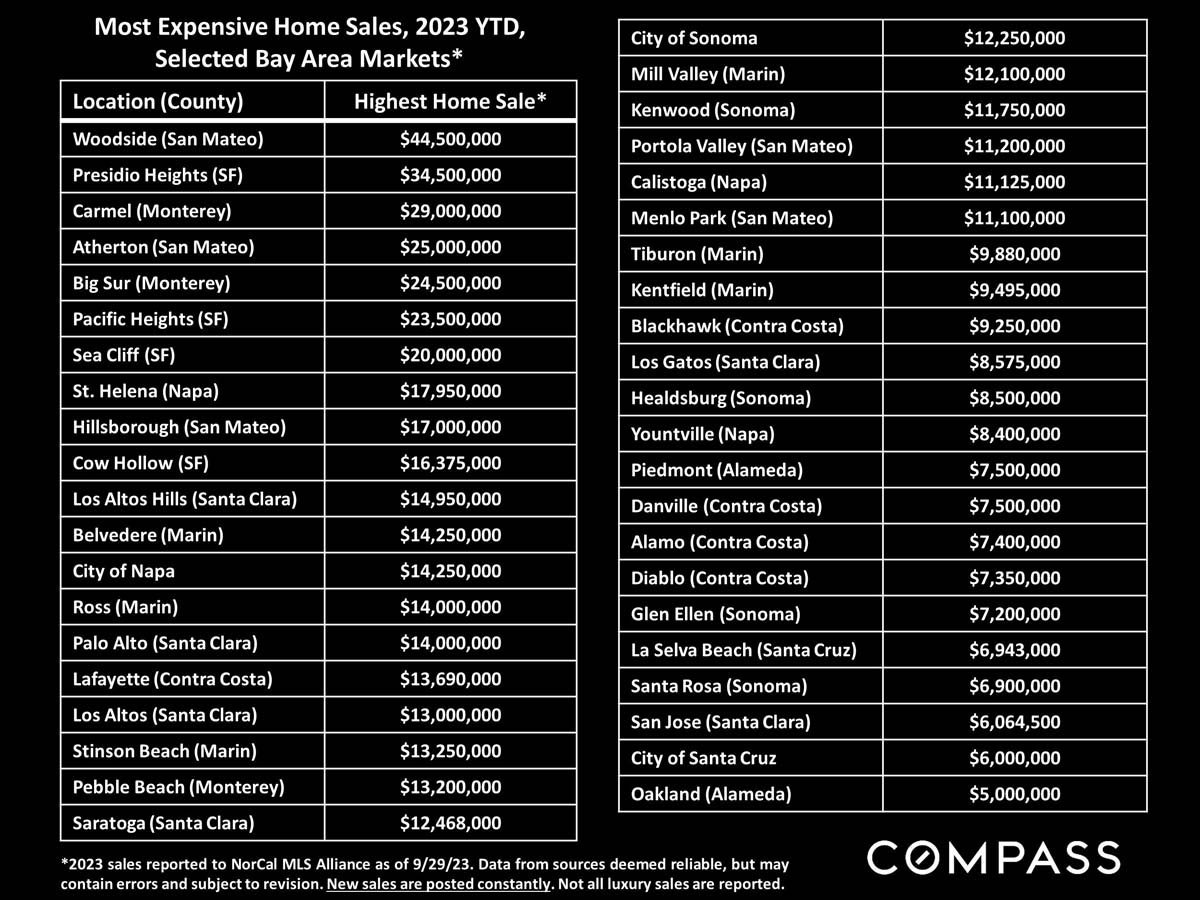
Table of the highest 2023 home sale prices in selected Bay Area markets, led by Woodside at $44.5 million.
 
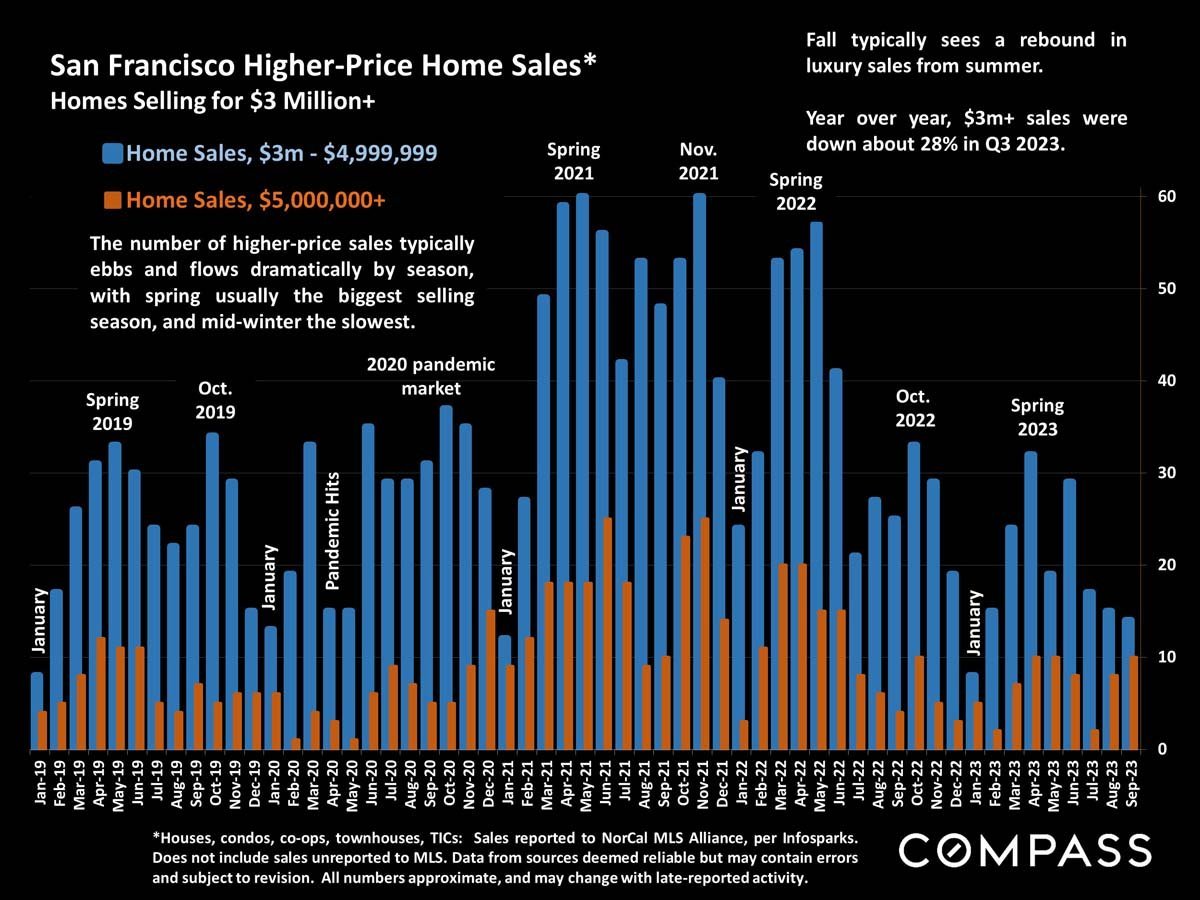
Chart of San Francisco luxury home sales, with monthly $3–5 million and $5 million-plus sales from 2019 to 2023.
 
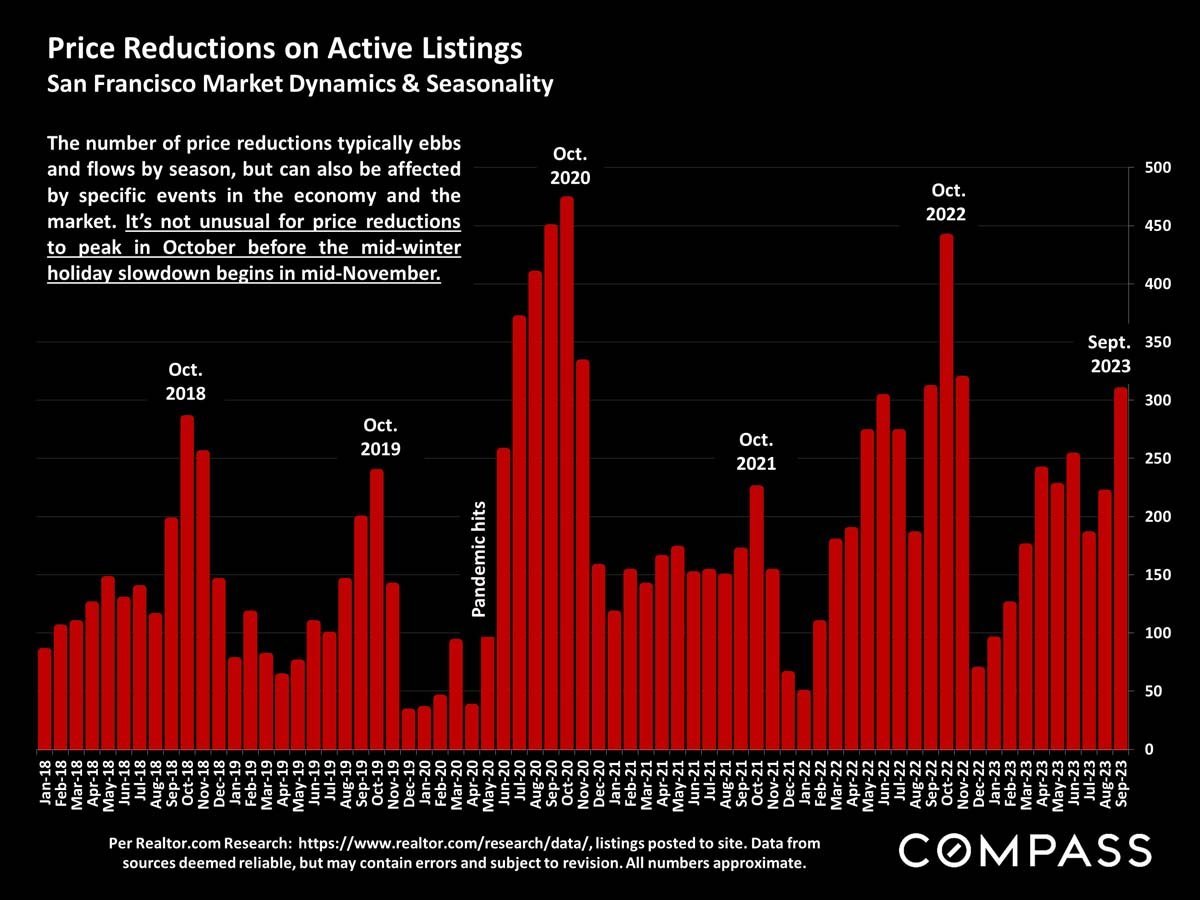
Chart of San Francisco active-listing price reductions, with red monthly bars from 2018 to September 2023.
 
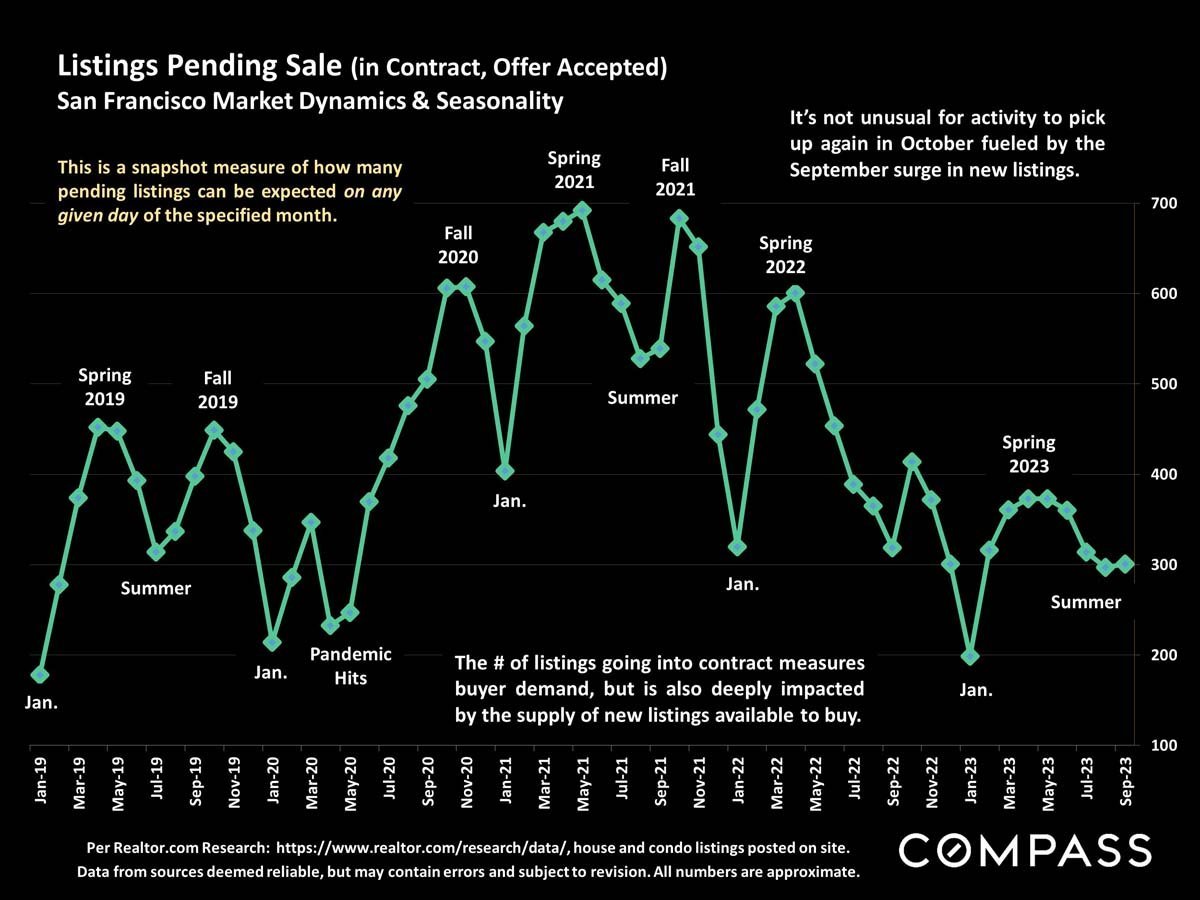
Chart of San Francisco pending listings from 2019–2023, with seasonal peaks and a January 2023 low.
 
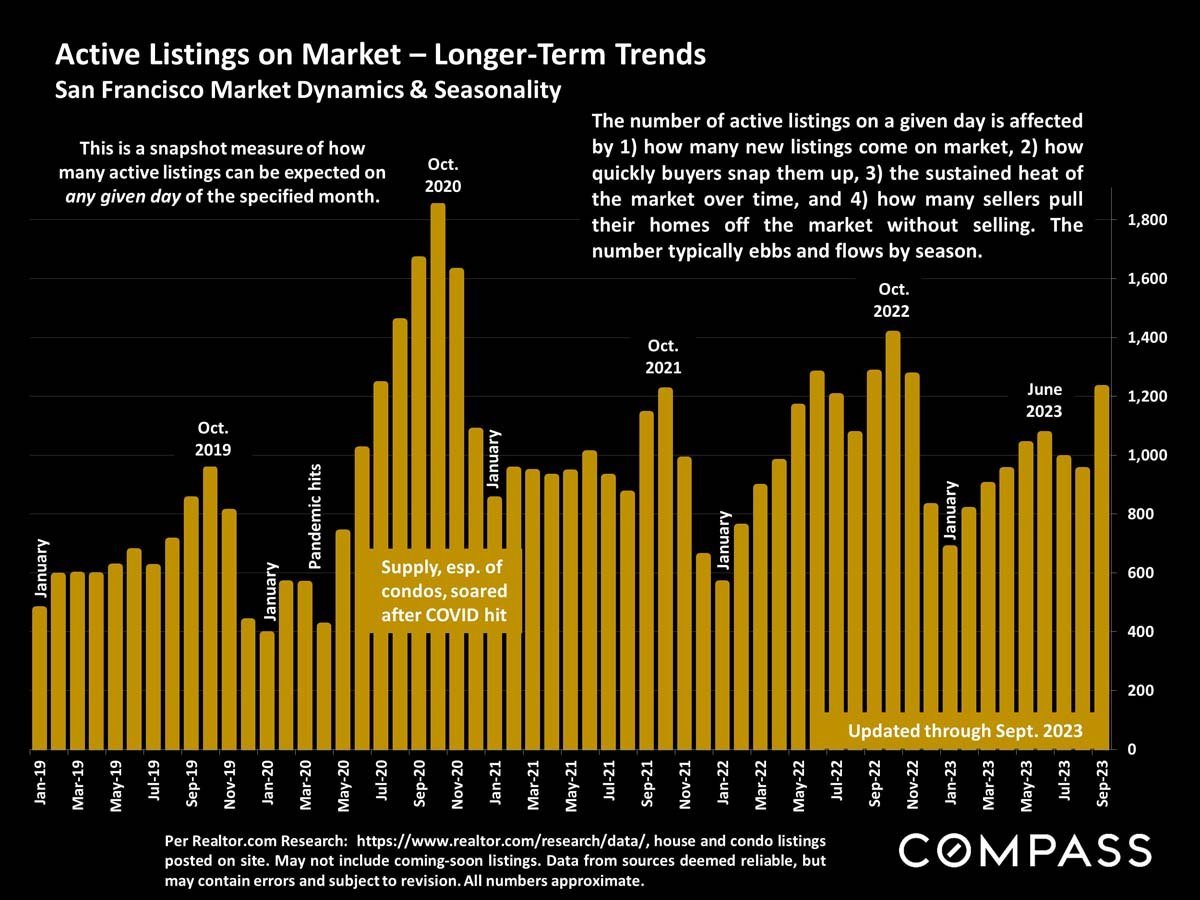
Chart of San Francisco active listings from 2019 to 2023, with a pronounced 2020 peak and seasonal fluctuations.
 
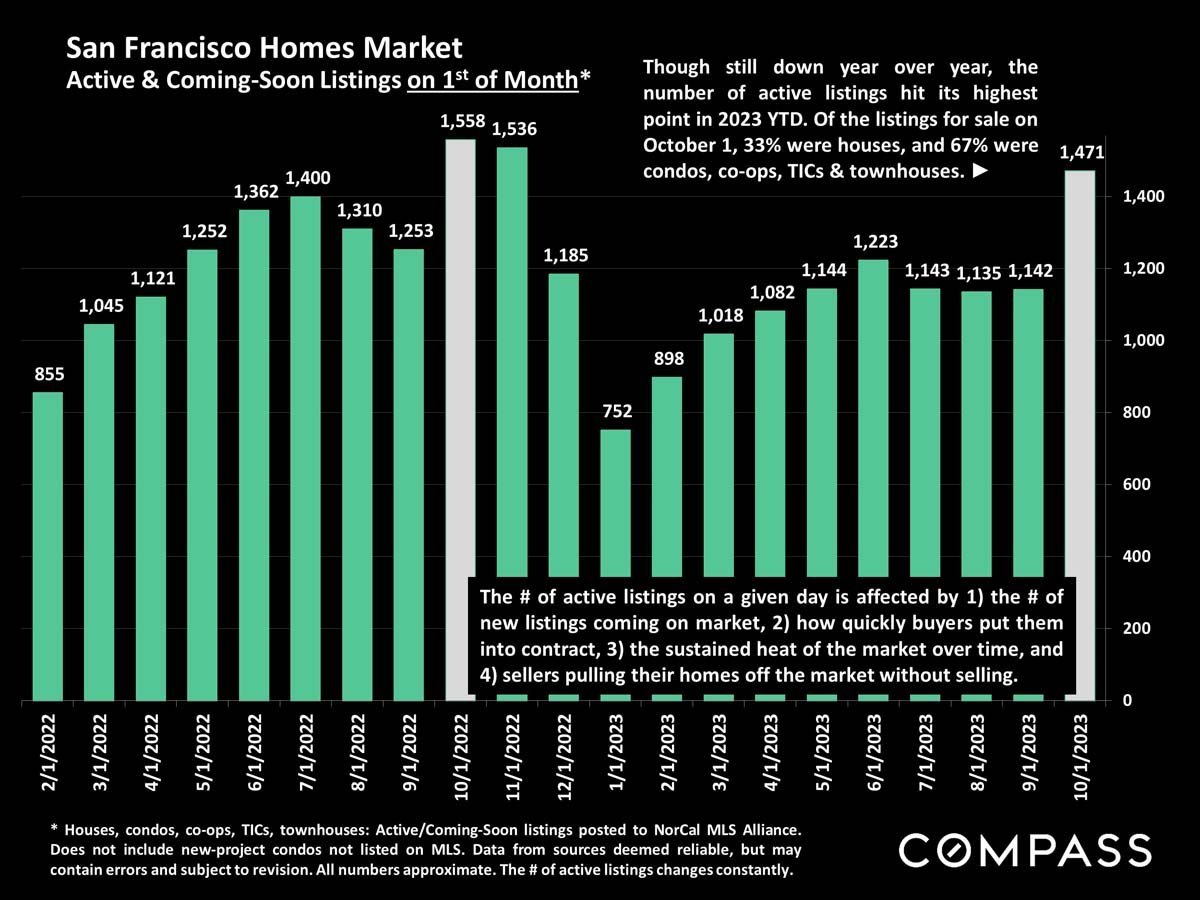
Bar chart of San Francisco active listings, rising to 1,471 in October 2023.
 
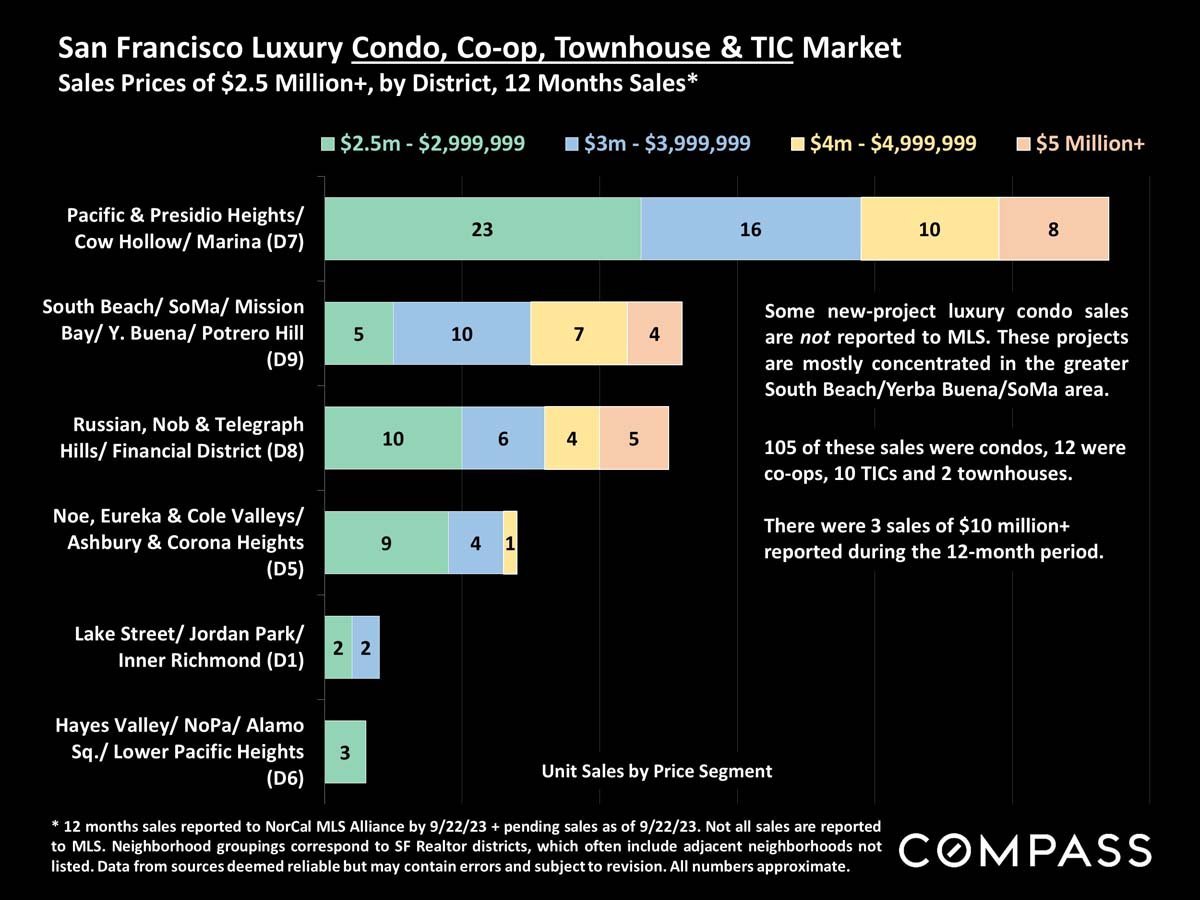
Chart of San Francisco luxury home sales by district and price range, with notes on property types and unreported sales.
 
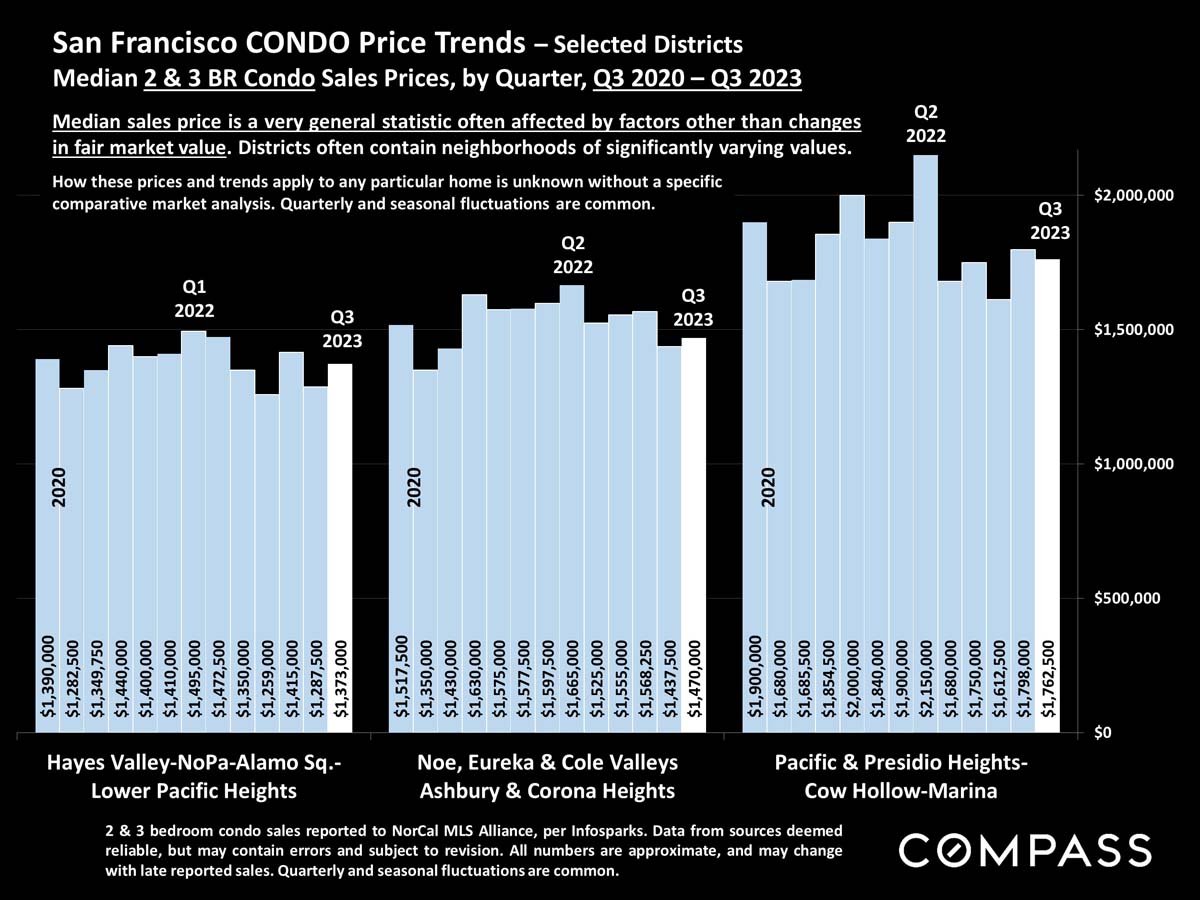
Chart of San Francisco condo prices by quarter across three district groups, from Q3 2020 to Q3 2023.
 
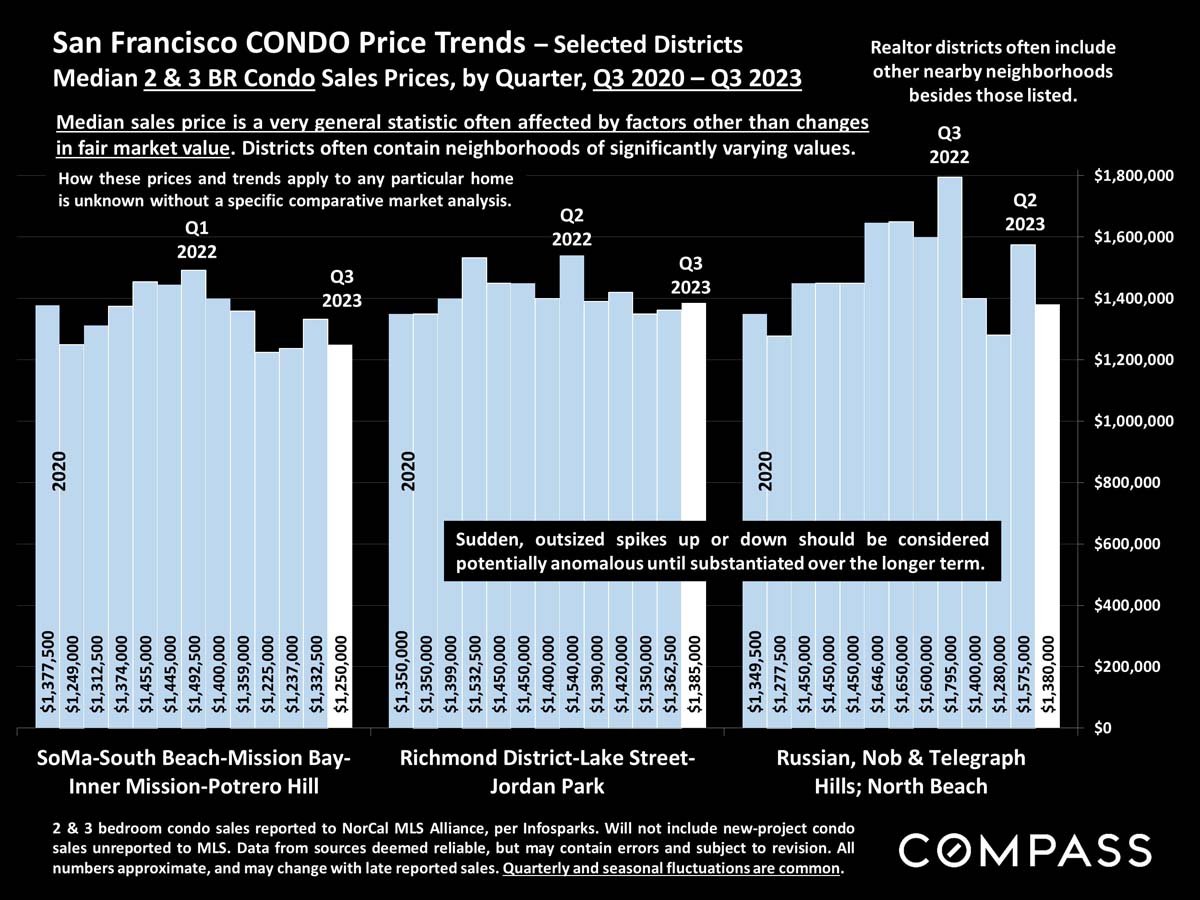
Chart comparing quarterly median San Francisco condo prices across three district groupings from 2020 to 2023.
 
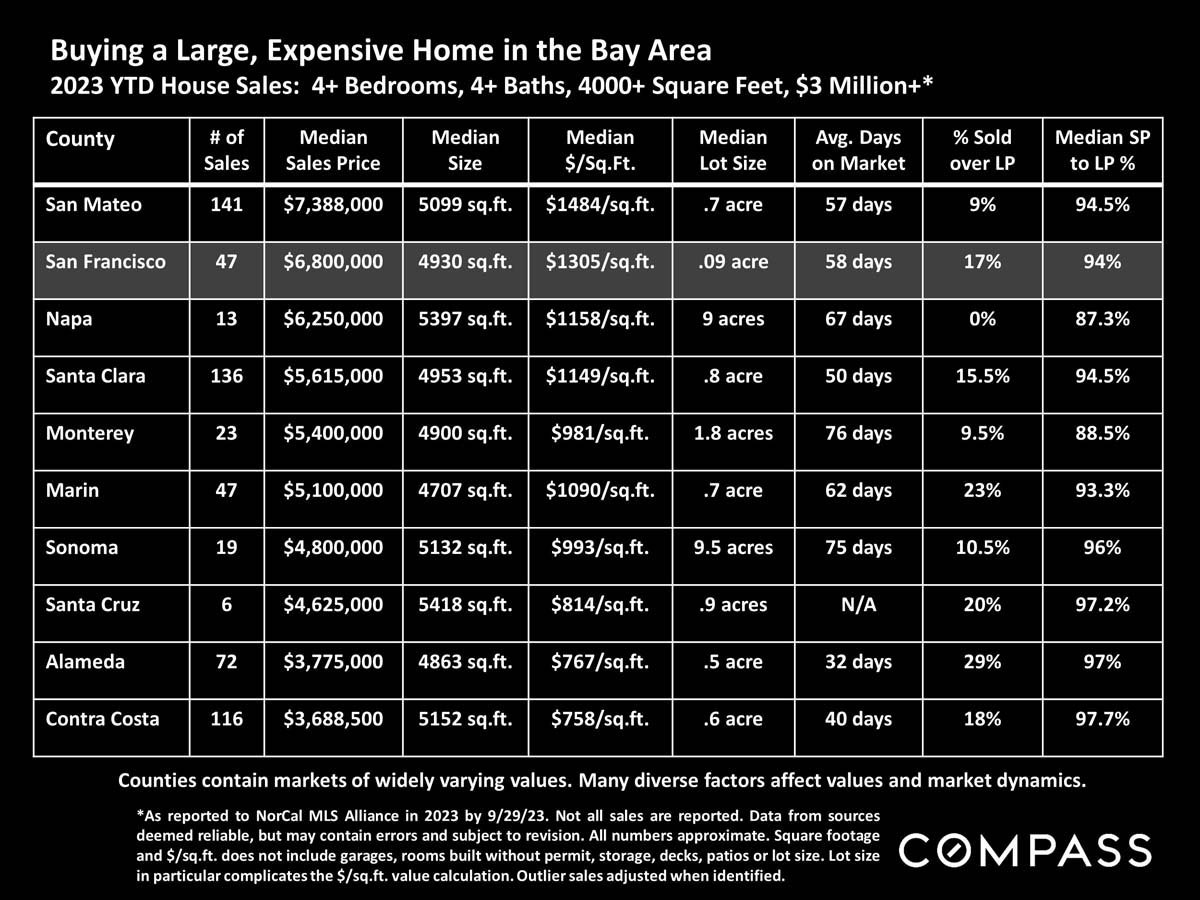
Bay Area 2023 sales comparison for large, expensive homes across ten counties.
 
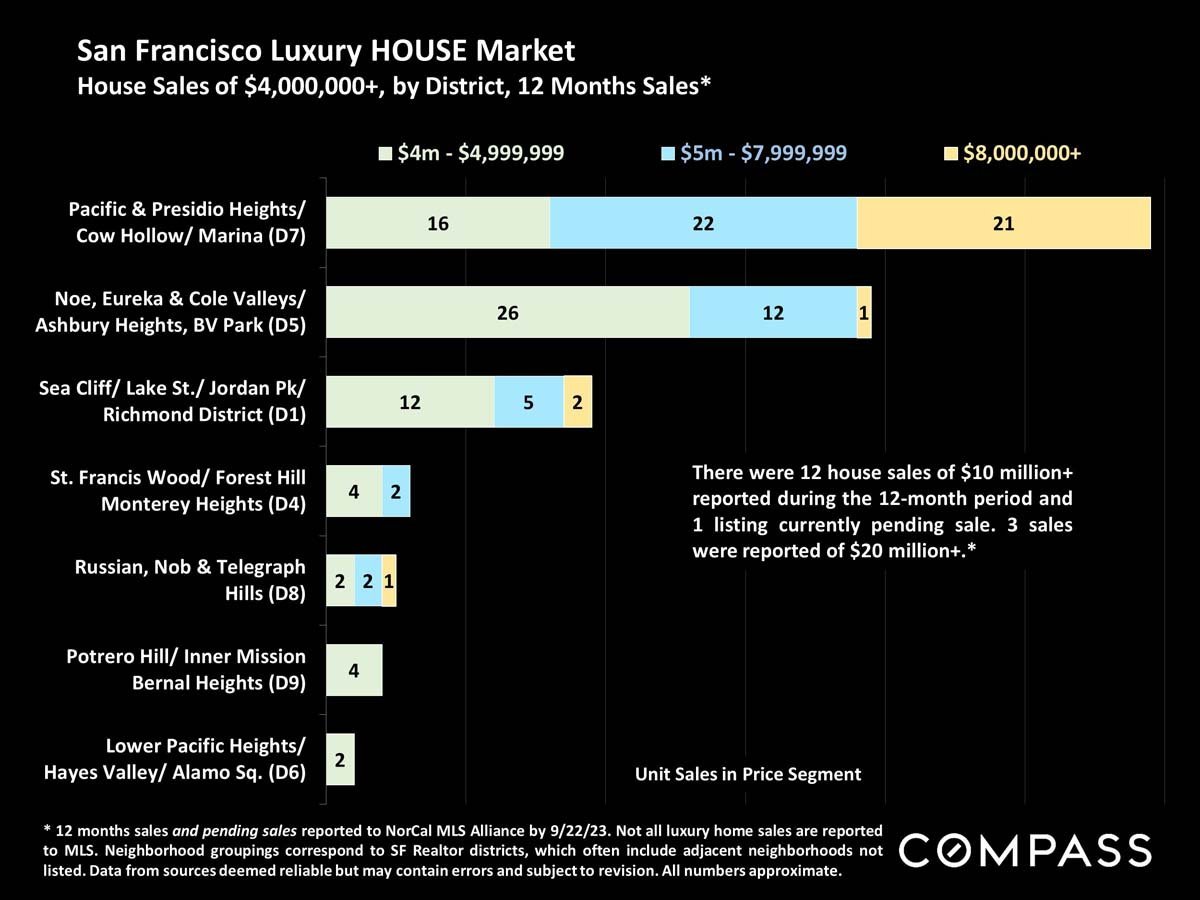
Chart of San Francisco luxury home sales by district and price segment, showing Pacific Heights-area neighborhoods leading.
 
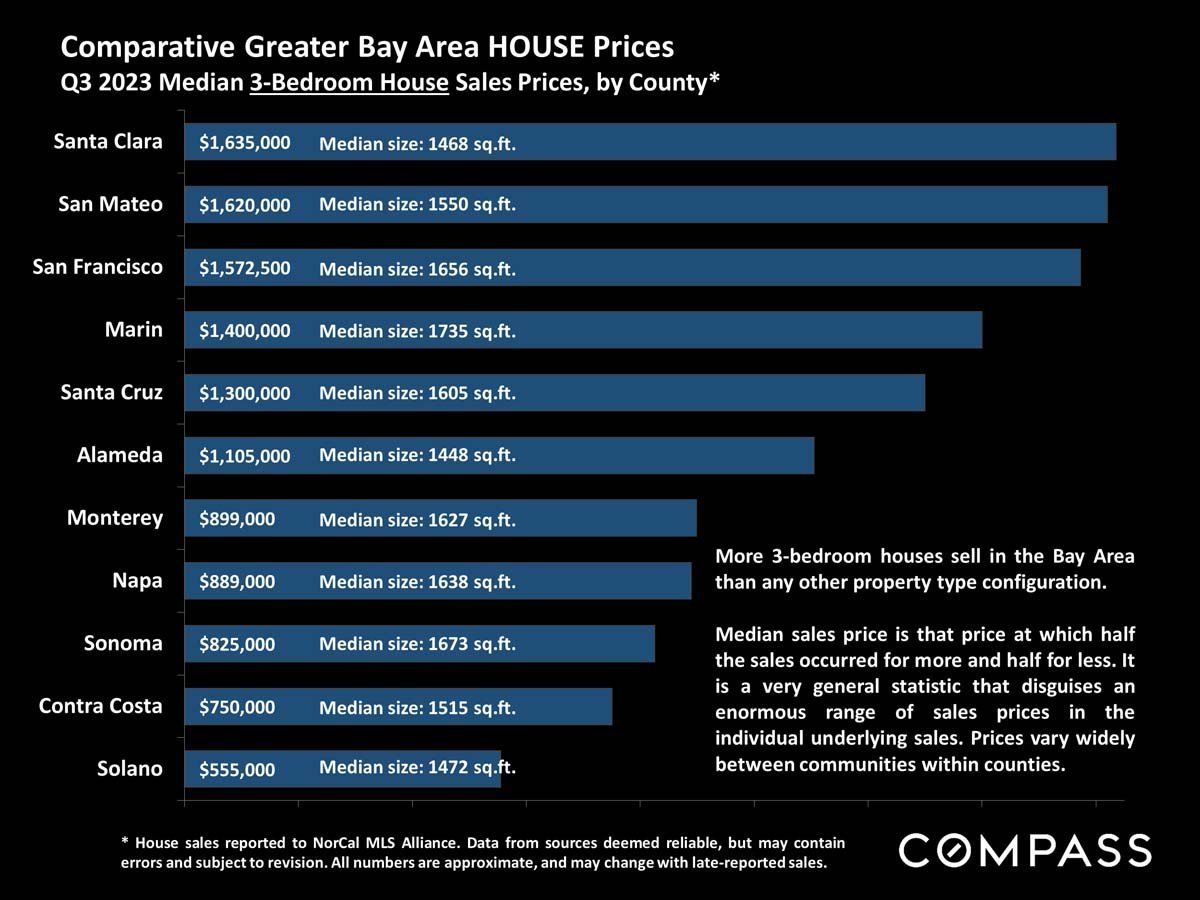
Chart comparing Q3 2023 median three-bedroom house prices across 11 Greater Bay Area counties.
 
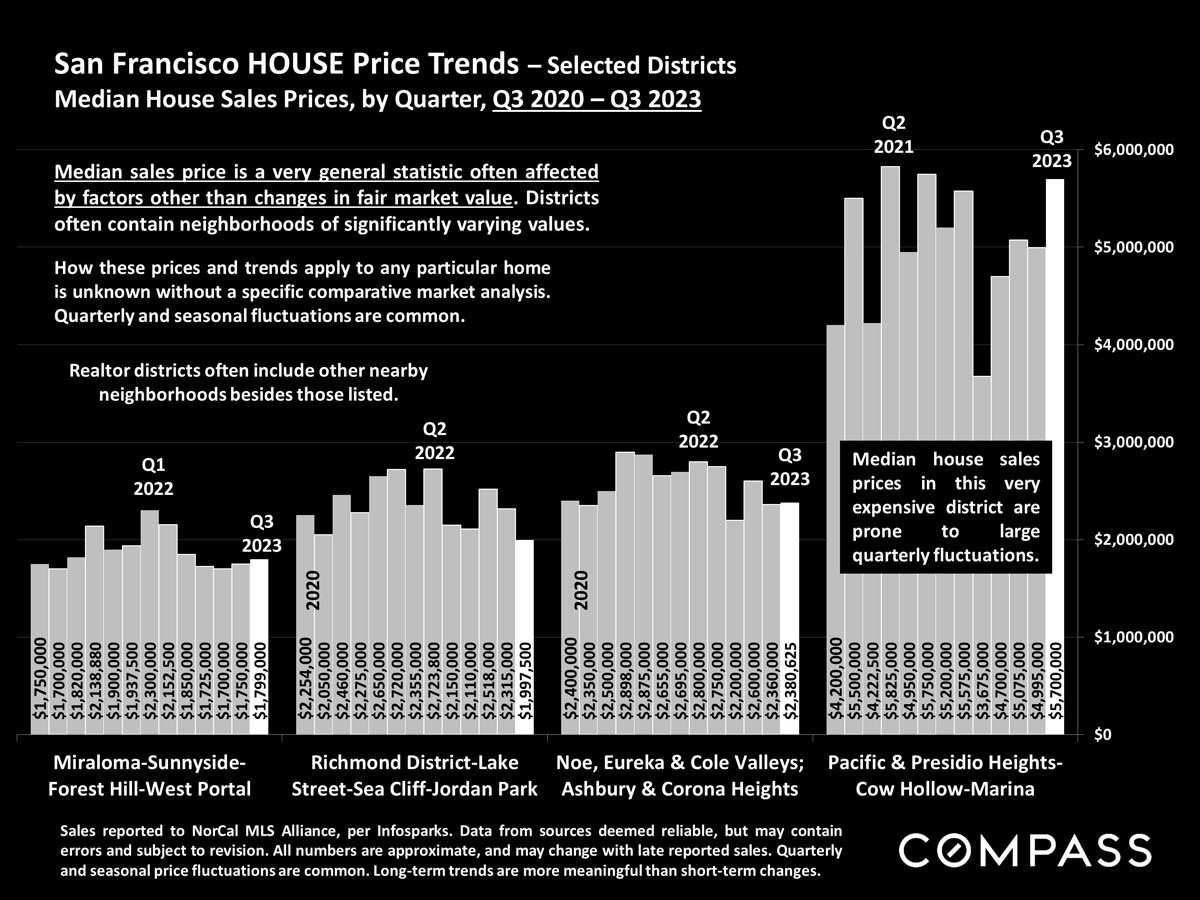
Bar chart compares quarterly median house prices across four groups of San Francisco districts, Q3 2020 to Q3 2023.
 
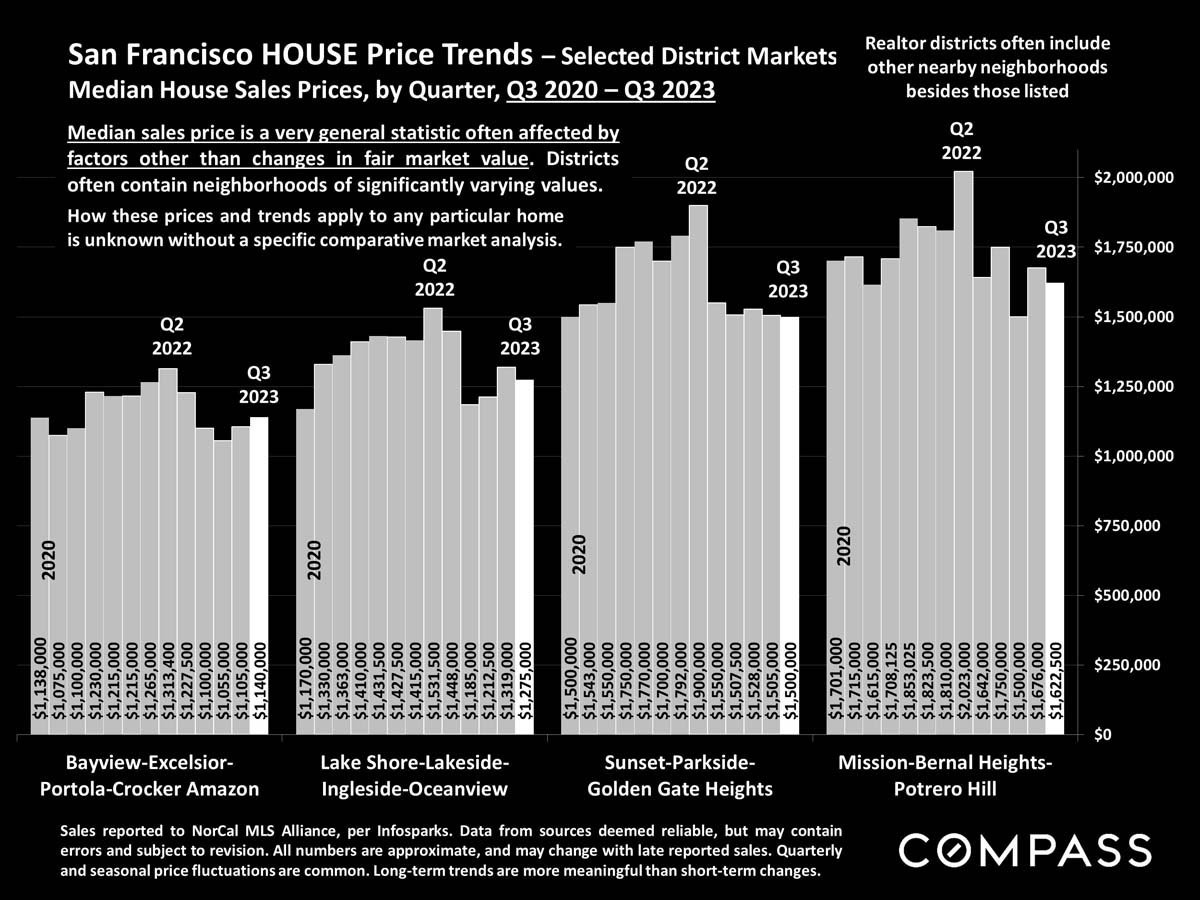
Chart comparing quarterly median house sale prices across four San Francisco district groups, from Q3 2020 to Q3 2023.
 
Chart comparing 12-month San Francisco home sales by property type and Realtor district, with a district map.
 
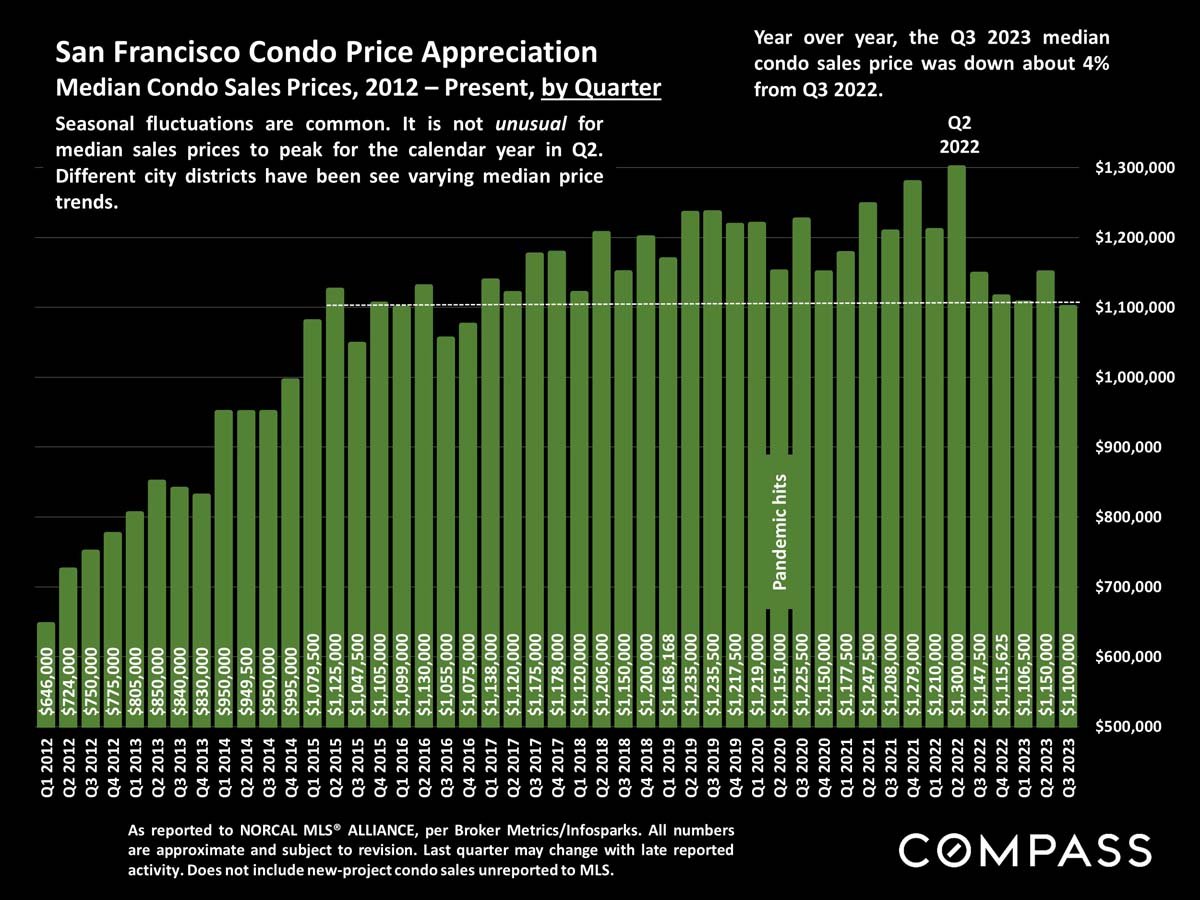
San Francisco condo median sale prices by quarter, 2012–Q3 2023, shown as green bars.
 
Chart comparing San Francisco median home prices and household incomes since 1995; home prices rose substantially faster.
 
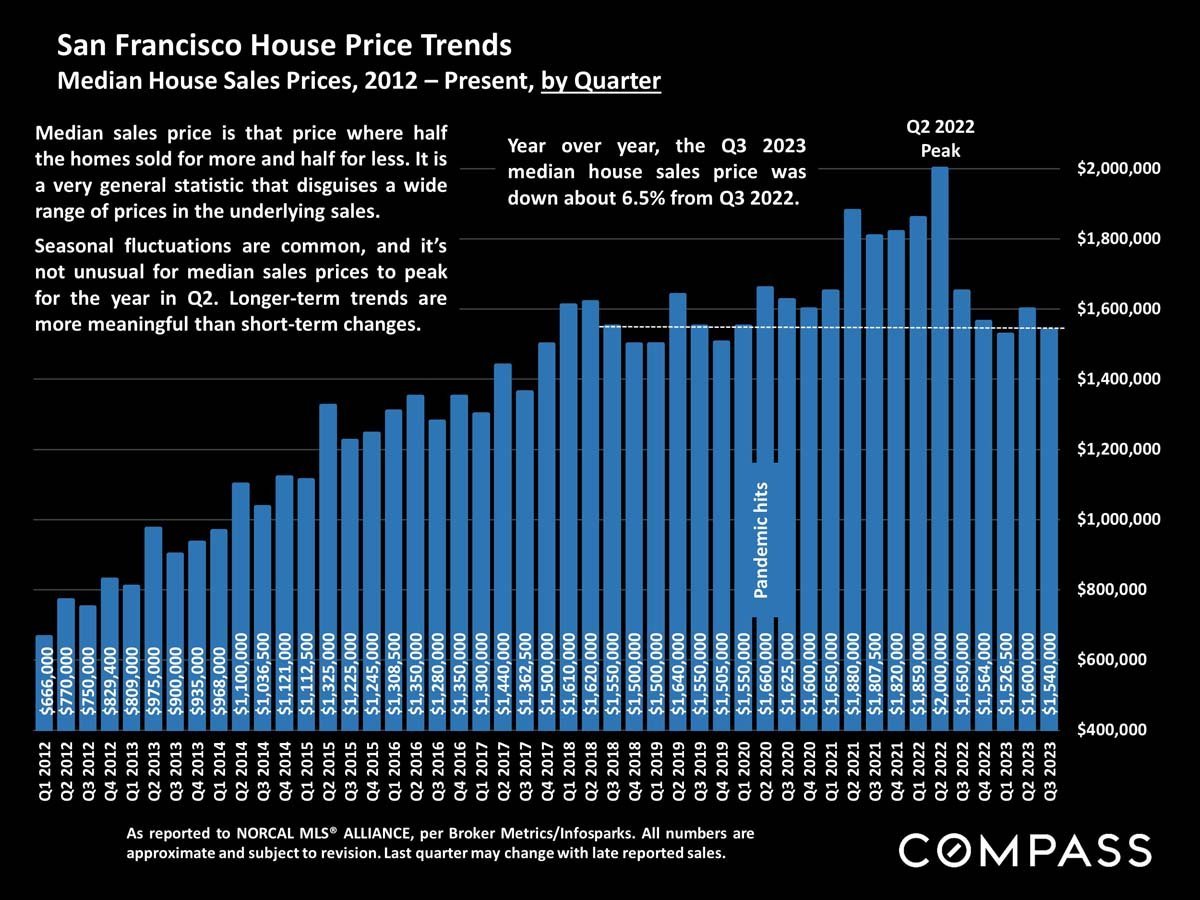
San Francisco quarterly median home sale prices, 2012–2023, peaking at $2 million in Q2 2022.
 
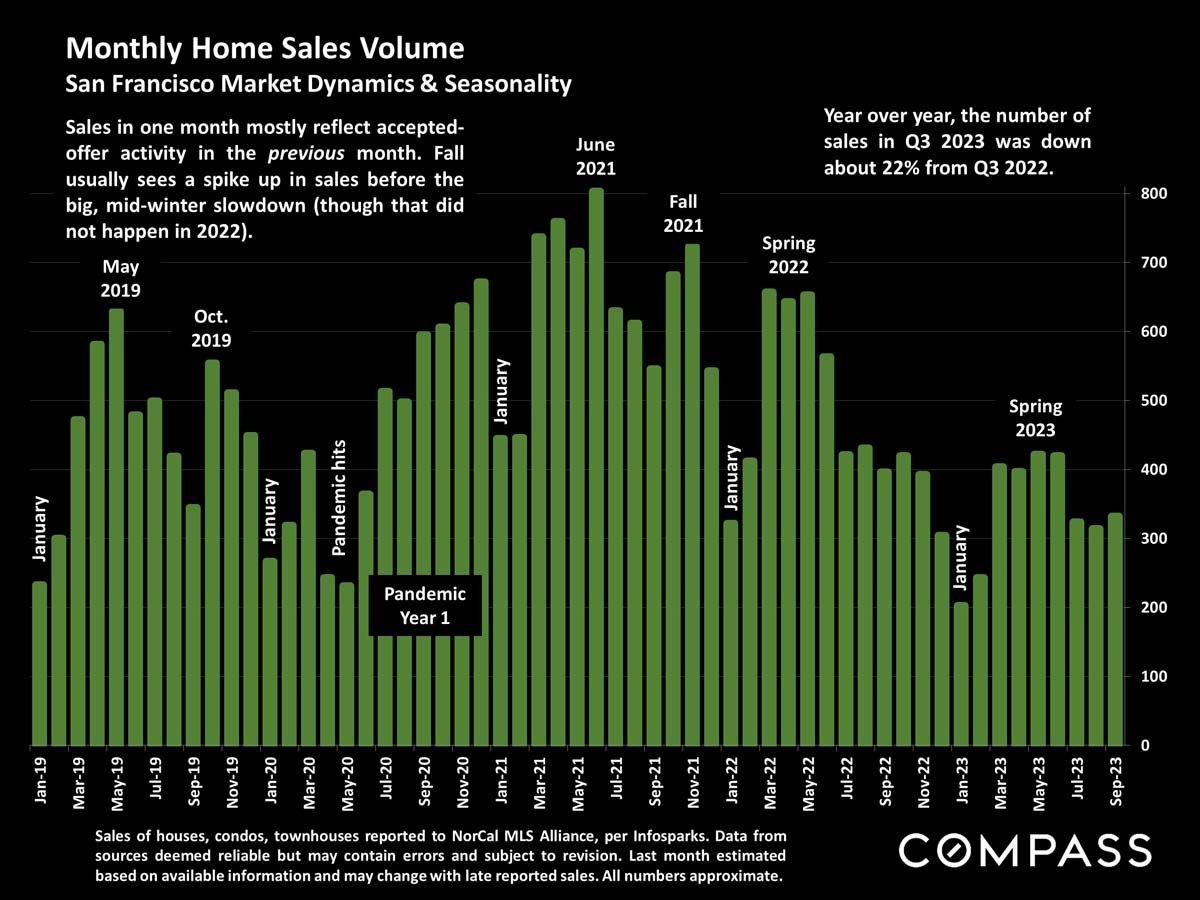
Bar chart of monthly San Francisco home sales from January 2019 through September 2023.
 
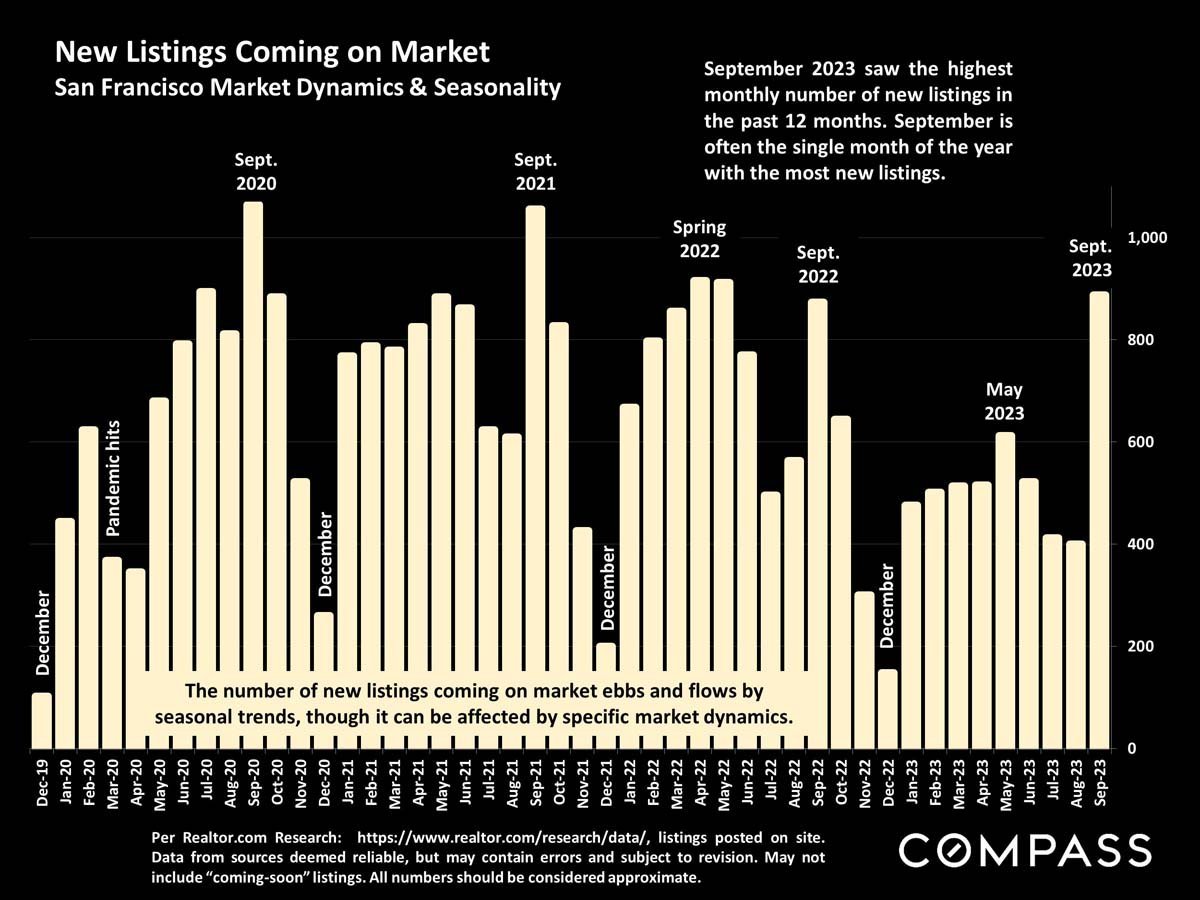
Infographic charting monthly San Francisco new listings from December 2019 to September 2023, with seasonal peaks and lows.
 
Market update on Q3 San Francisco home prices and sales, with the California Realtors’ 2024 housing forecast.

Work With Jane

Get assistance in determining the current property value, crafting a competitive offer, writing and negotiating a contract, and much more. Contact me today.
Follow Me on Instagram