San Francisco real estate September 2024 report cover with a dusk skyline and COMPASS branding.

San Francisco Home Prices, Market Conditions & Trends September 2024

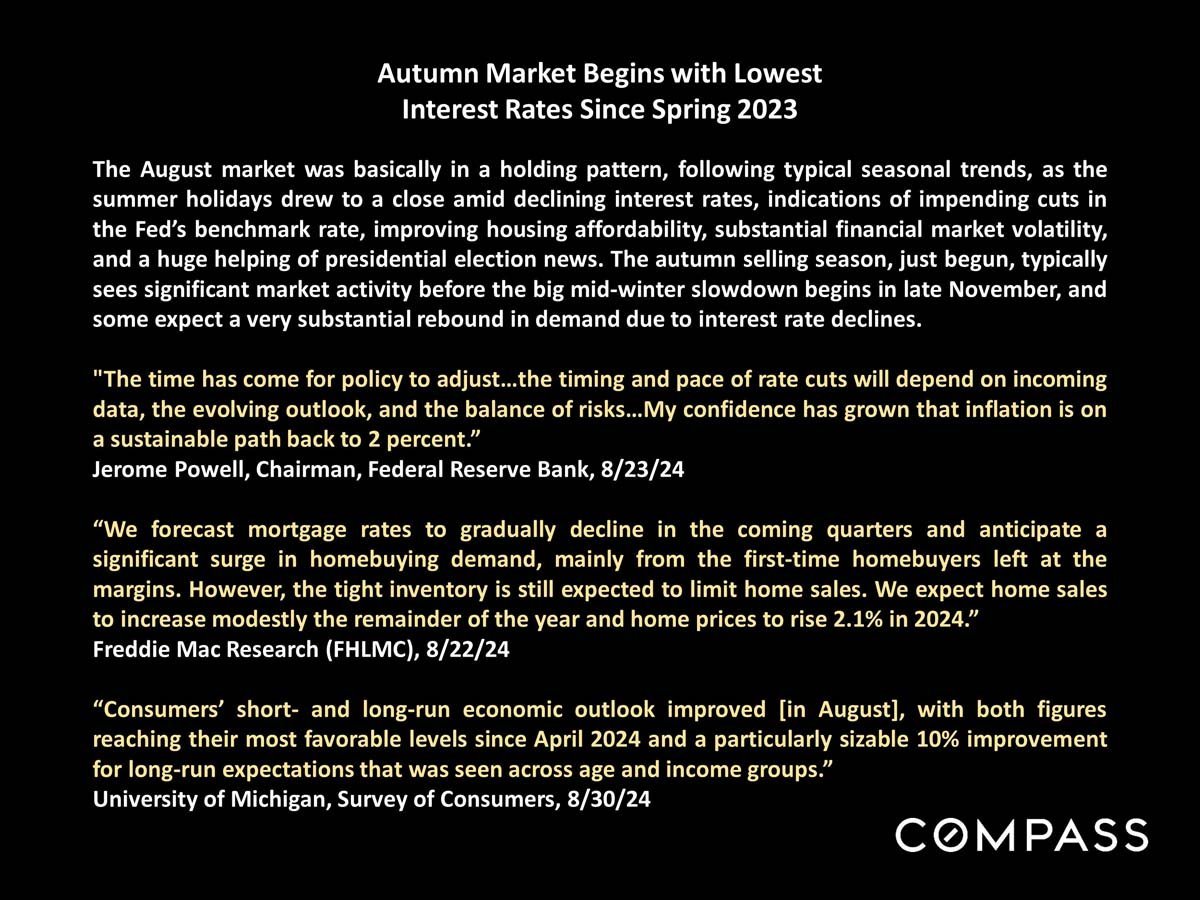
Autumn Market Begins with Lowest Interest Rates Since Spring 2023.
 
San Francisco real estate September 2024 report cover with a dusk skyline and COMPASS branding.
 
Autumn market update summarizing interest rates, housing demand, home sales, and consumer outlook.
 
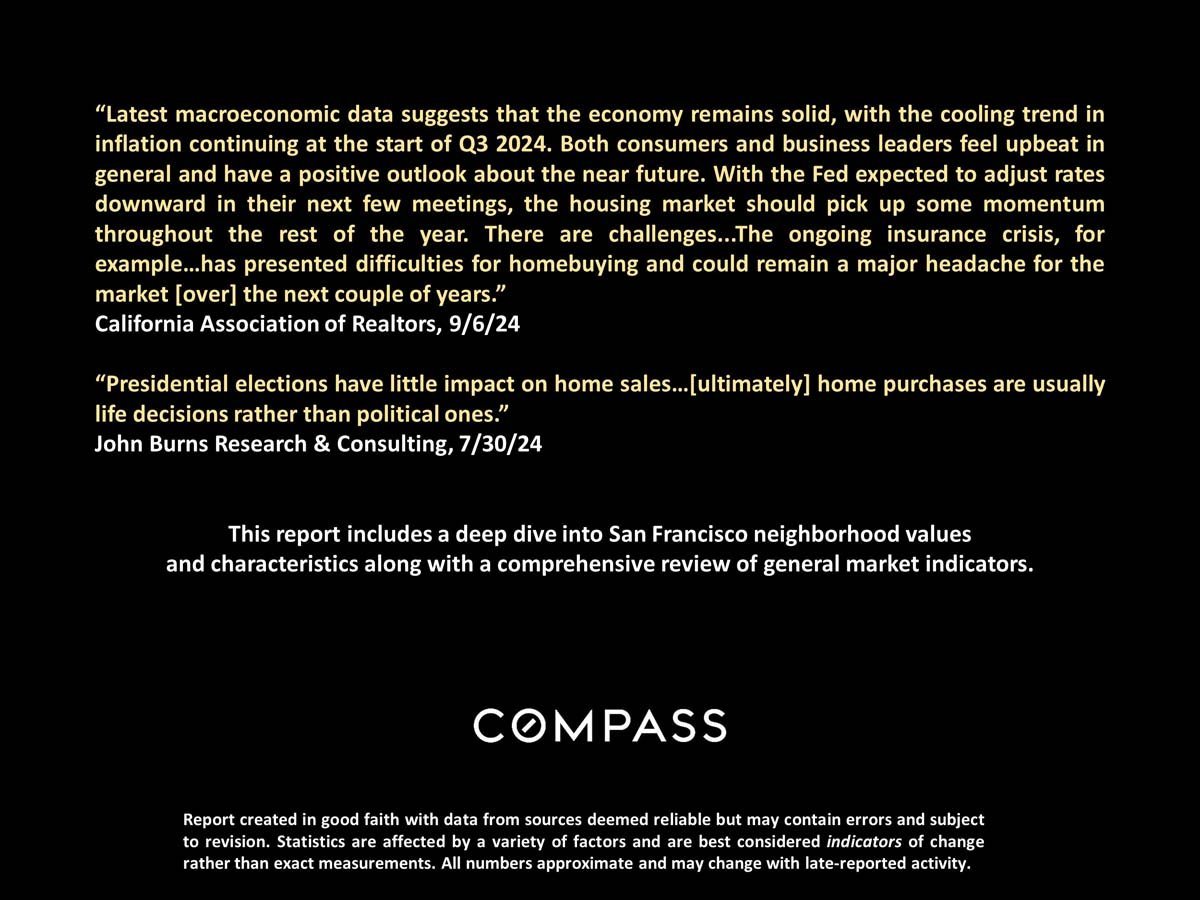
Compass San Francisco housing market report page with economic outlook quotes and a market analysis summary.
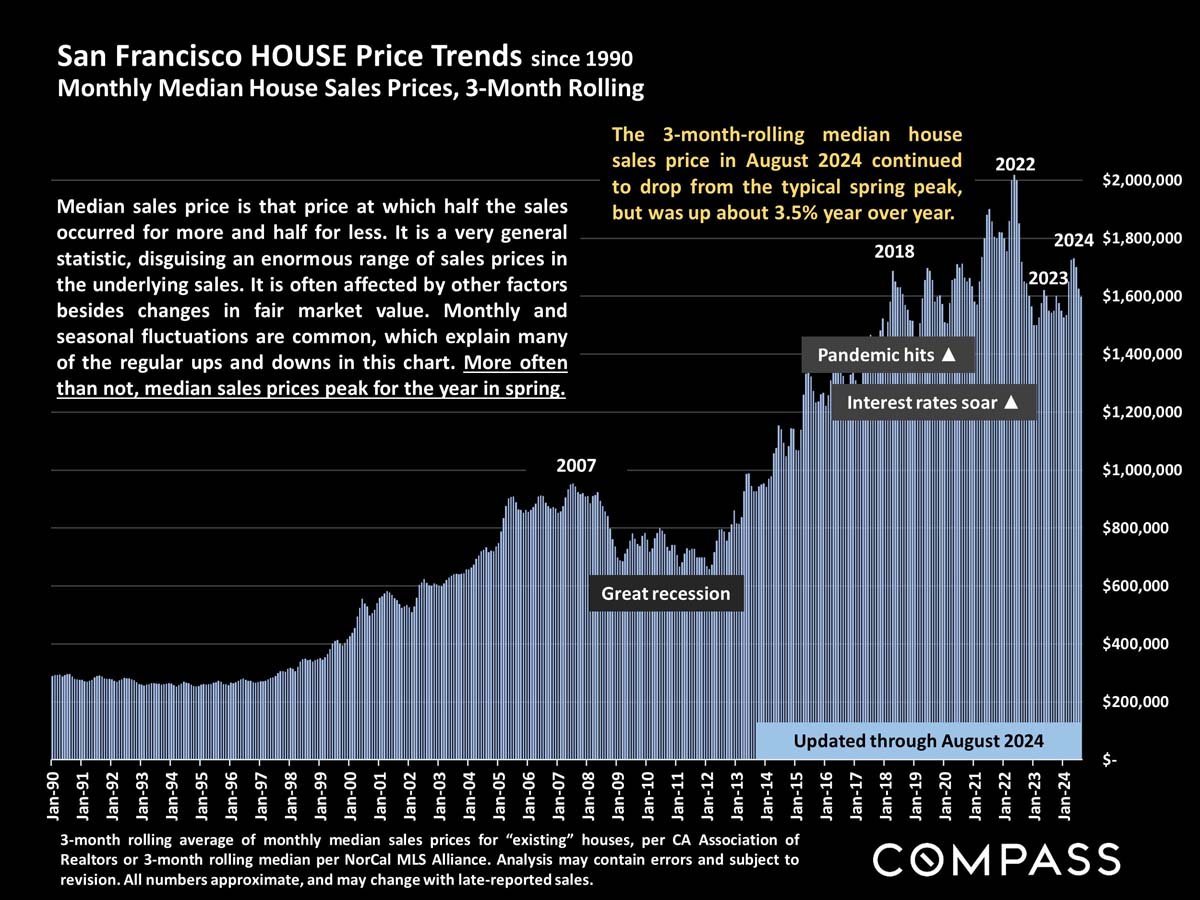
 
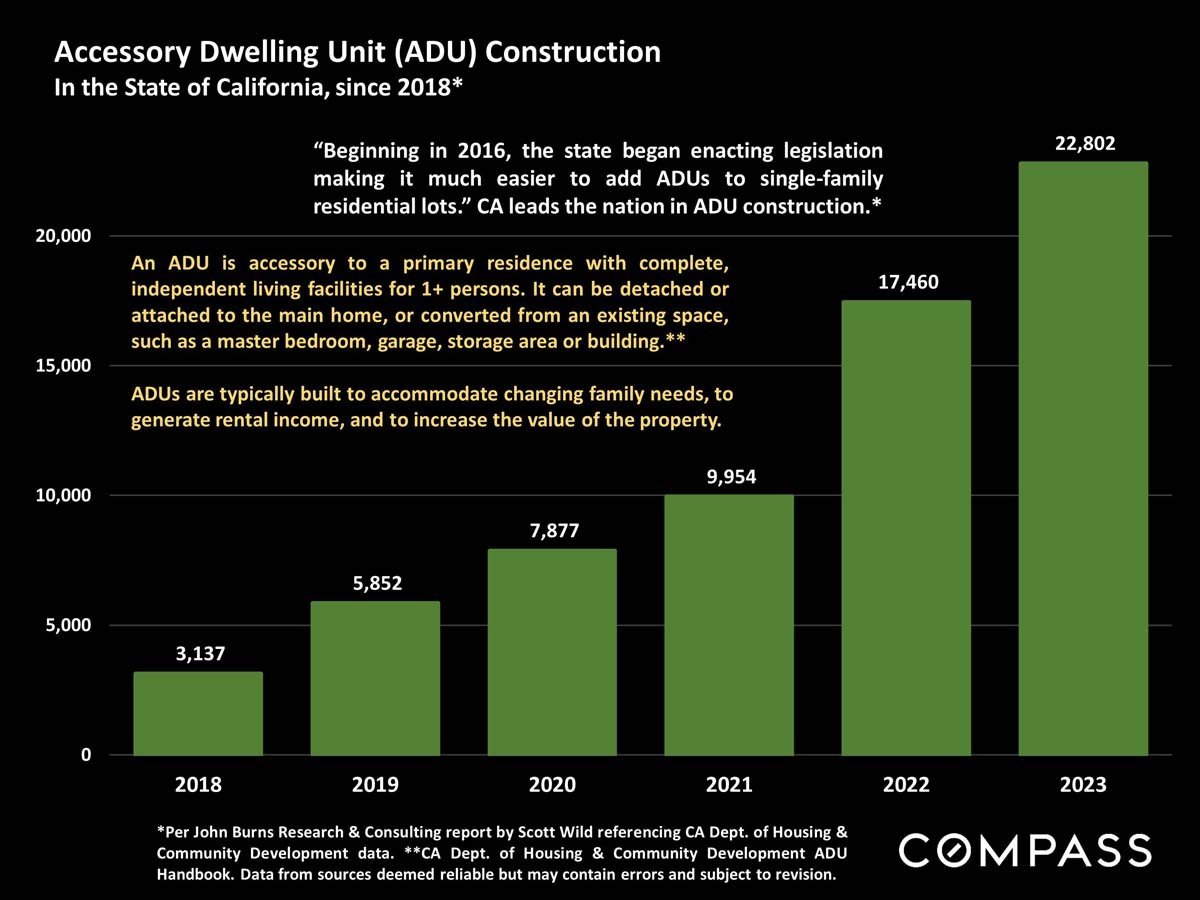
Chart of California ADU construction, increasing from 3,137 units in 2018 to 22,802 in 2023.
 
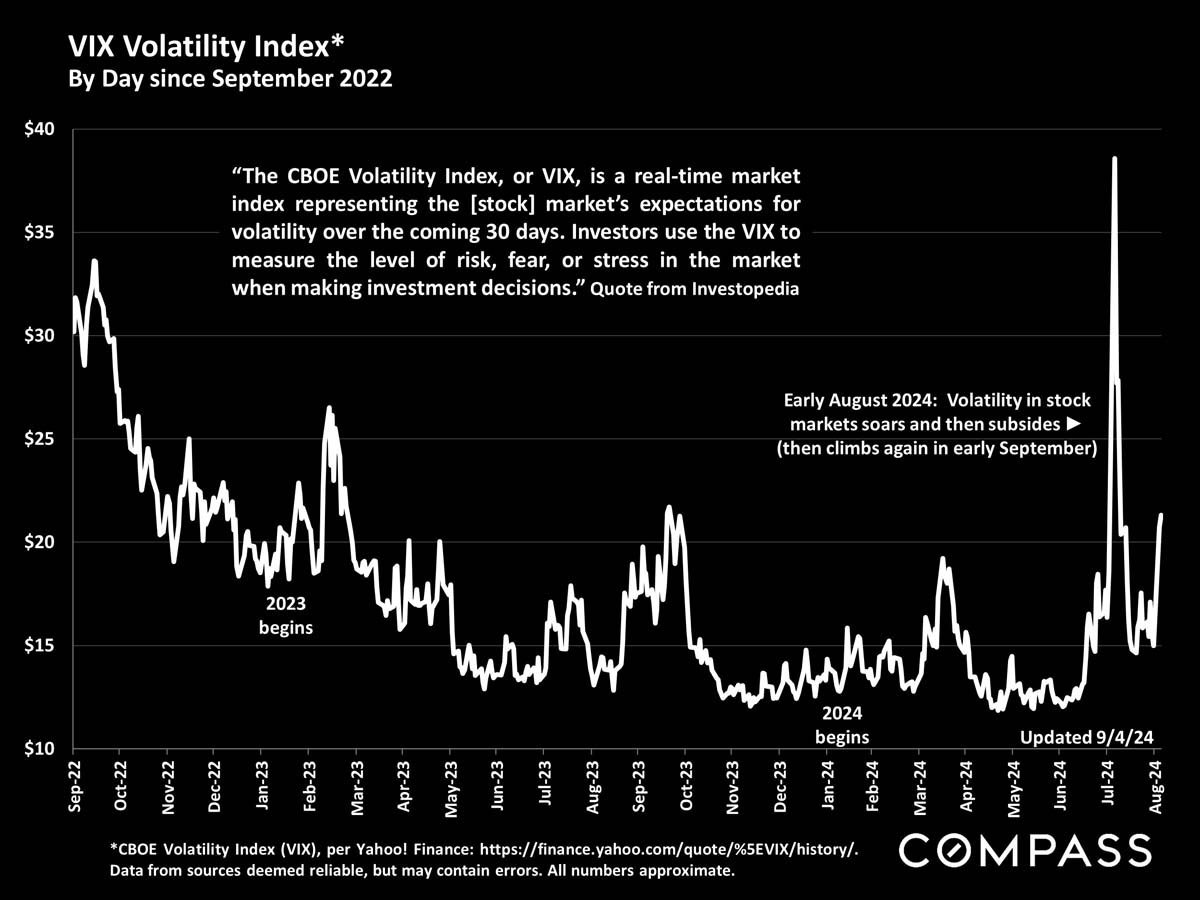
VIX volatility index chart from September 2022 to August 2024, with a sharp spike in early August 2024.
 
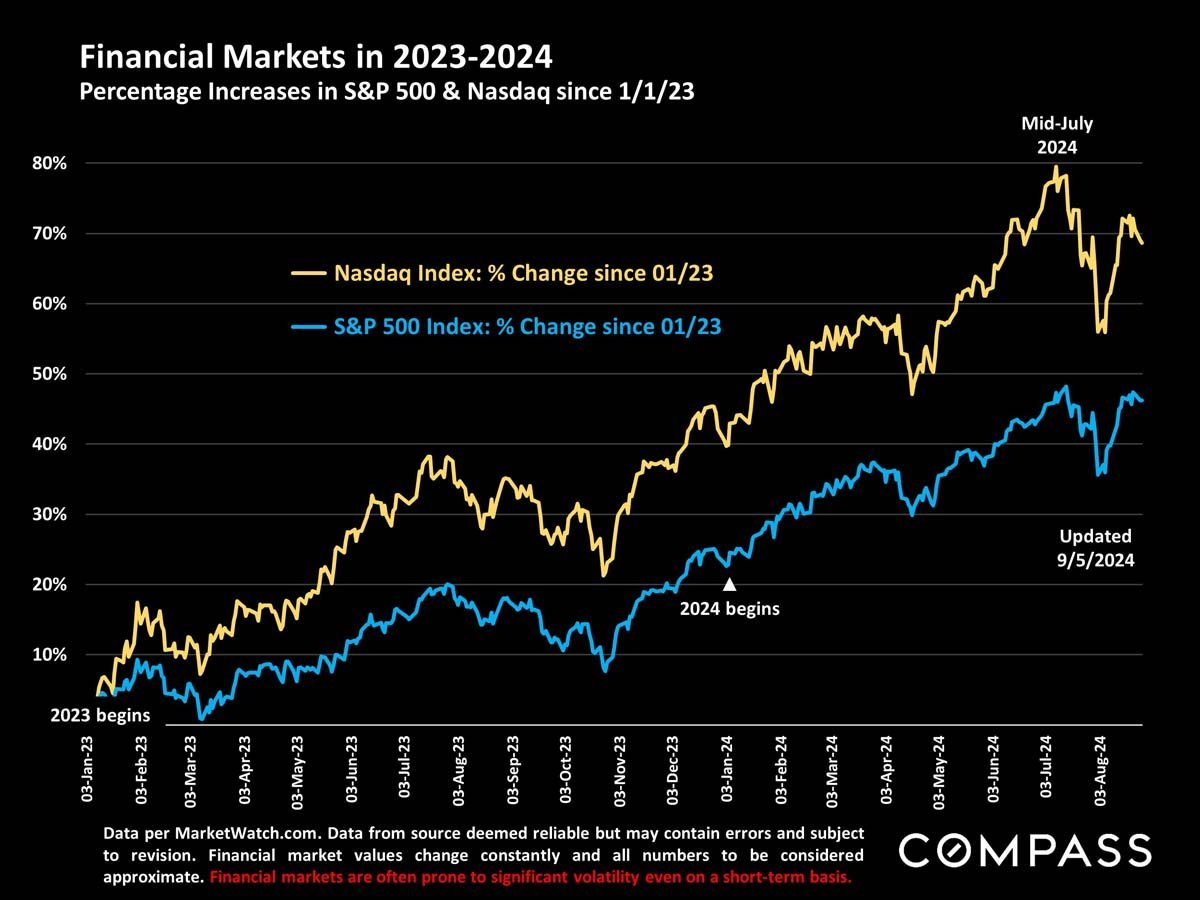
Chart comparing Nasdaq and S&P 500 gains since January 2023, with Nasdaq rising higher by September 2024.
 
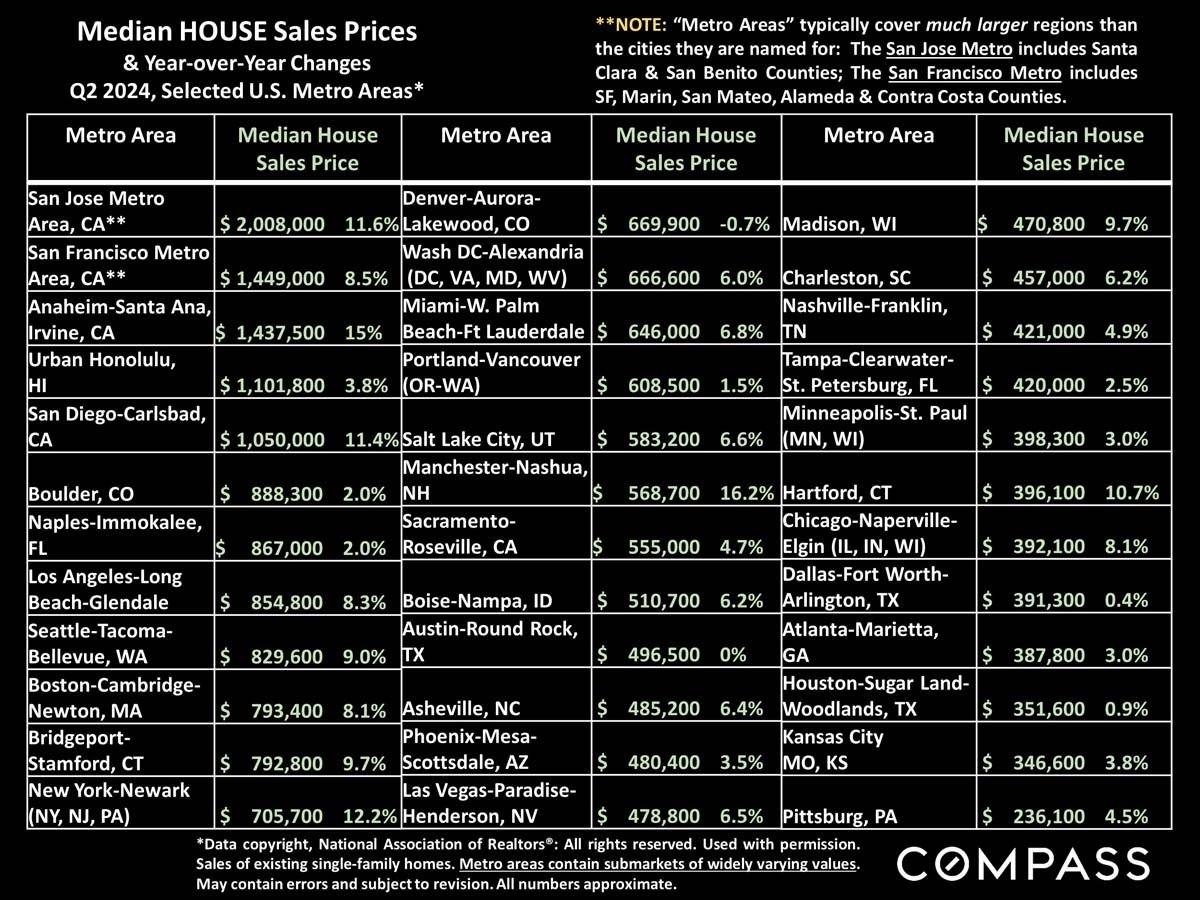
Table comparing Q2 2024 median house prices and yearly changes across U.S. metro areas, including San Francisco.
 
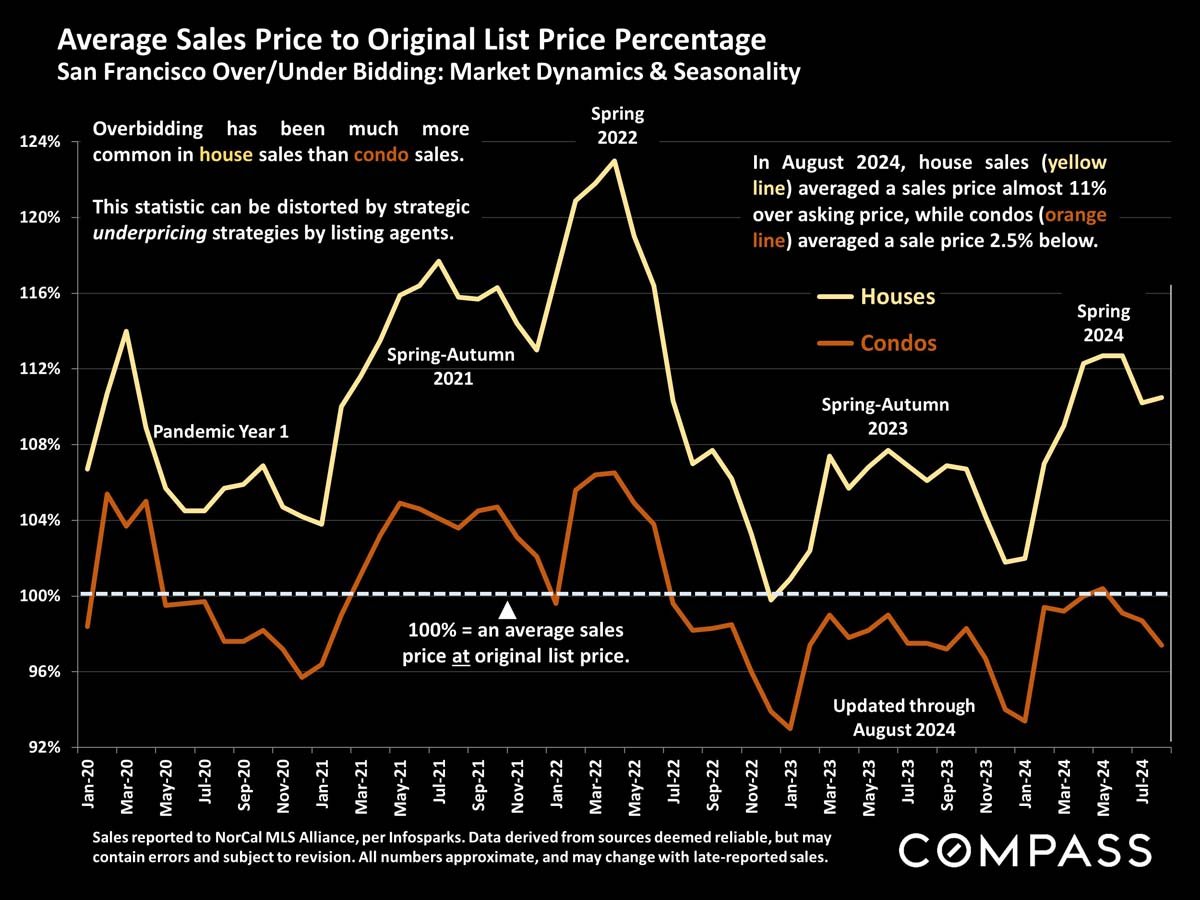
San Francisco home-price chart compares house and condo sale prices to original list prices, January 2020–August 2024.
 
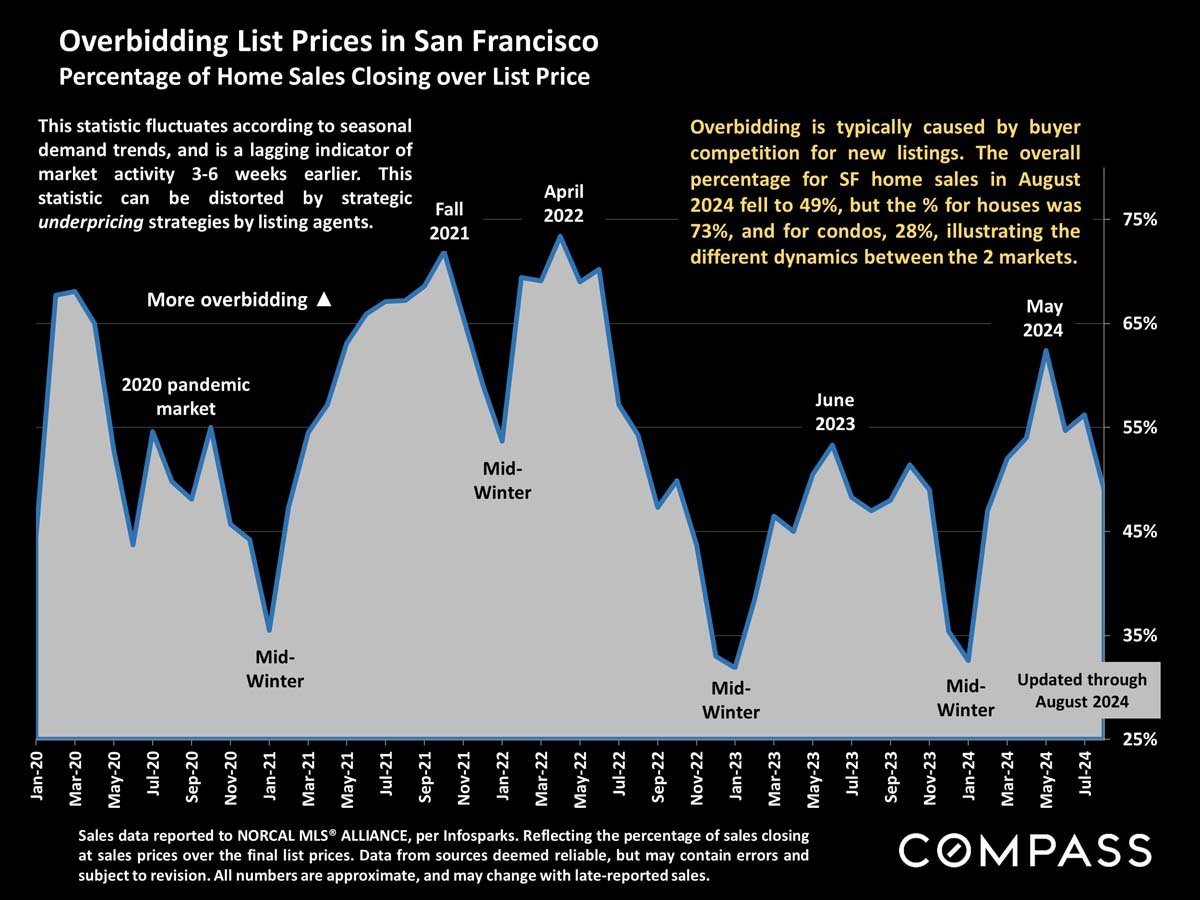
Chart of San Francisco home sales over list price, showing monthly fluctuations from January 2020 through August 2024.
 
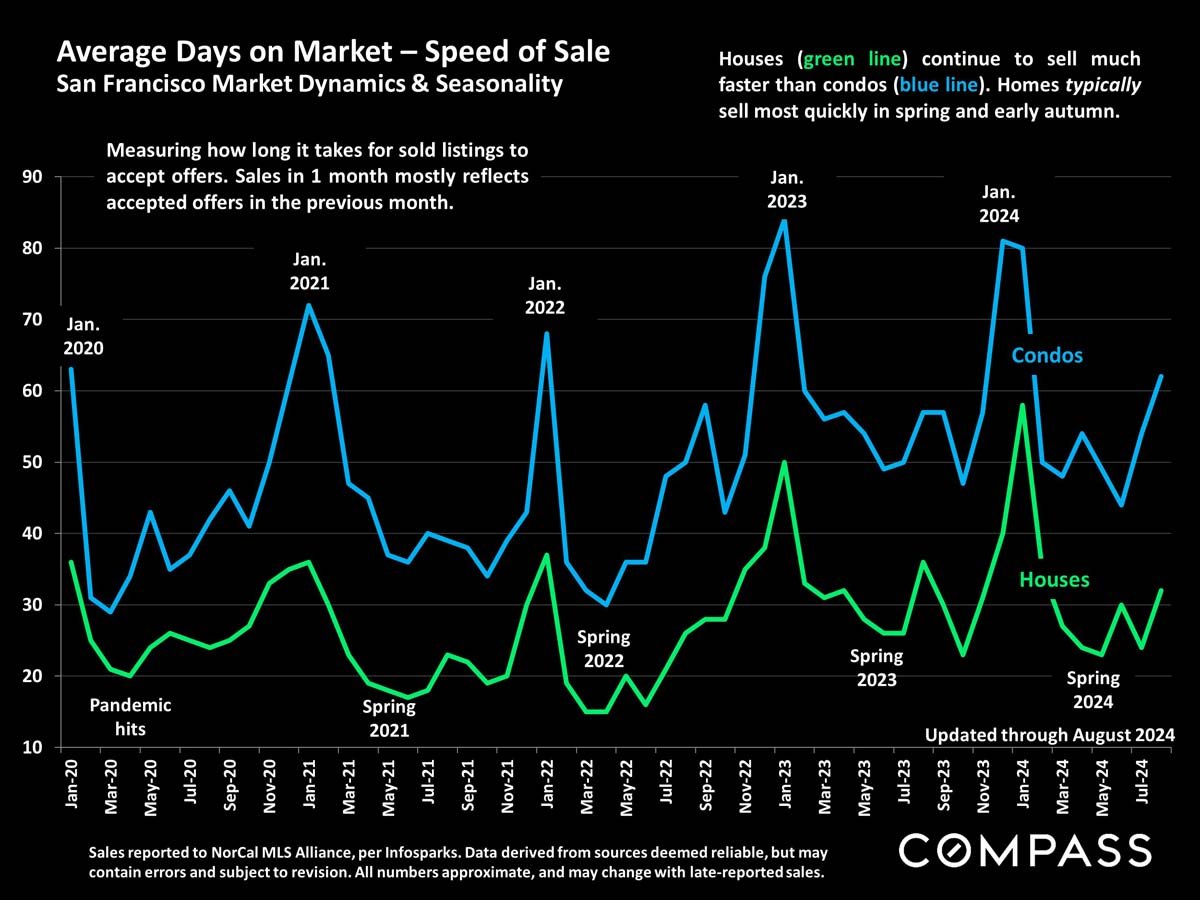
San Francisco days-on-market chart, with condos generally taking longer to sell than houses from 2020 to August 2024.
 
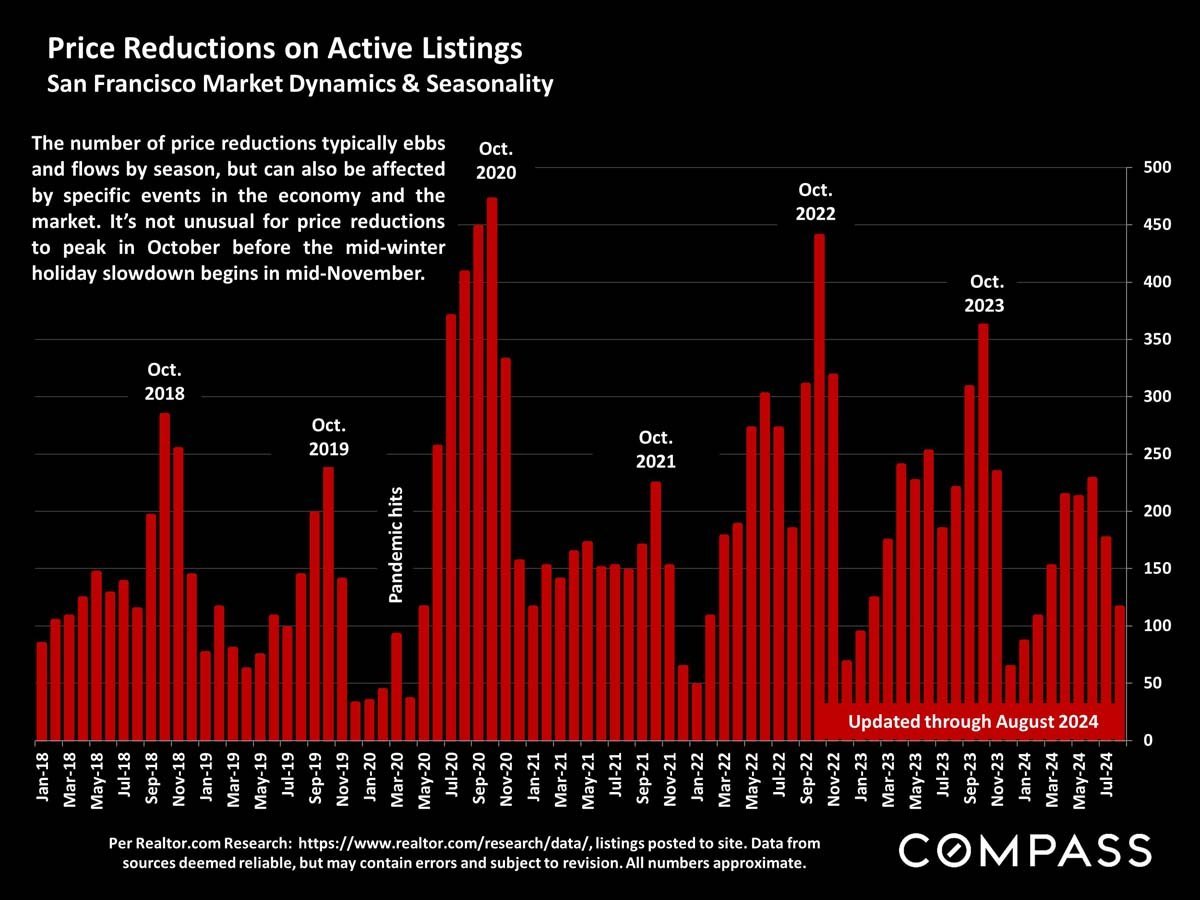
Bar chart of San Francisco active-listing price reductions by month, January 2018 through July 2024.
 
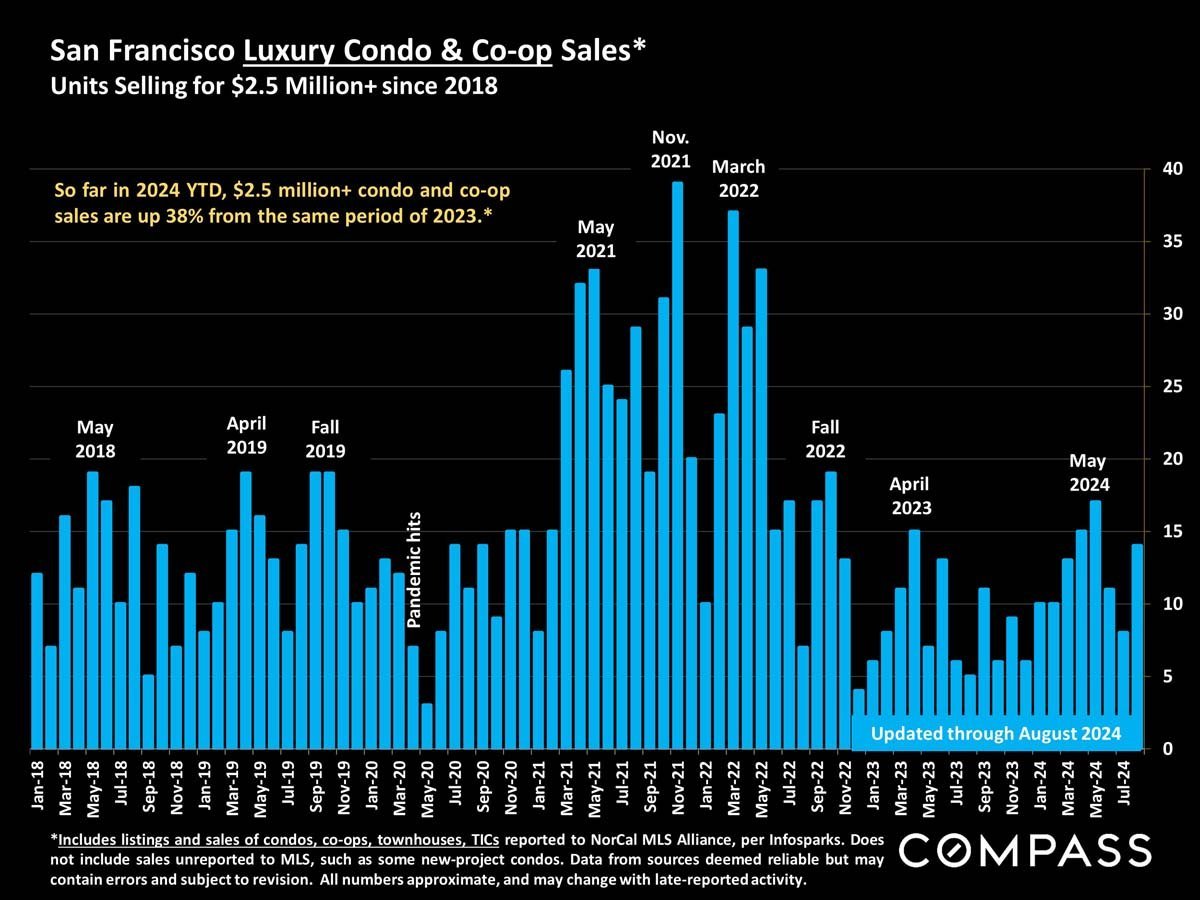
Chart of San Francisco luxury condo and co-op sales; 2024 year-to-date sales are up 38% year over year.
 
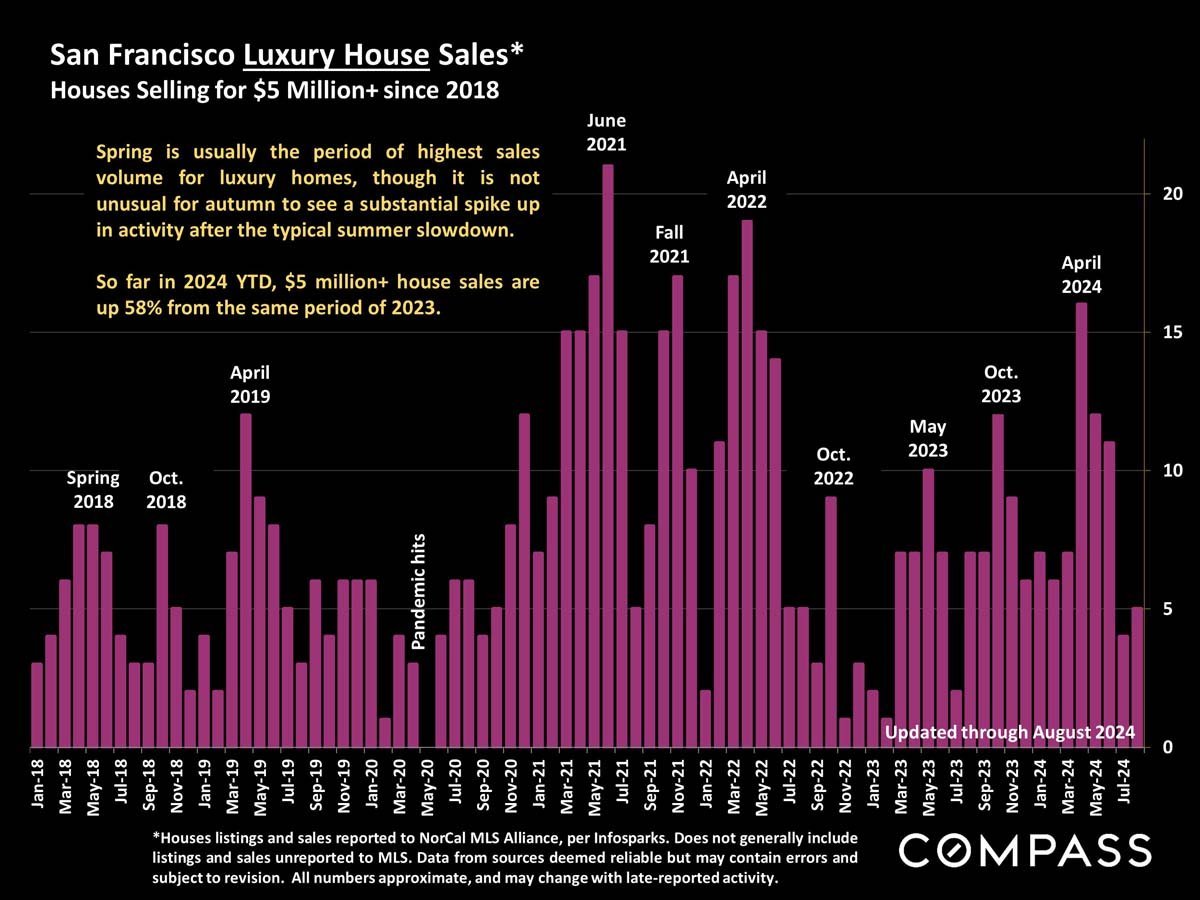
Chart of San Francisco $5 million-plus home sales, with monthly bars from 2018 to August 2024.
 
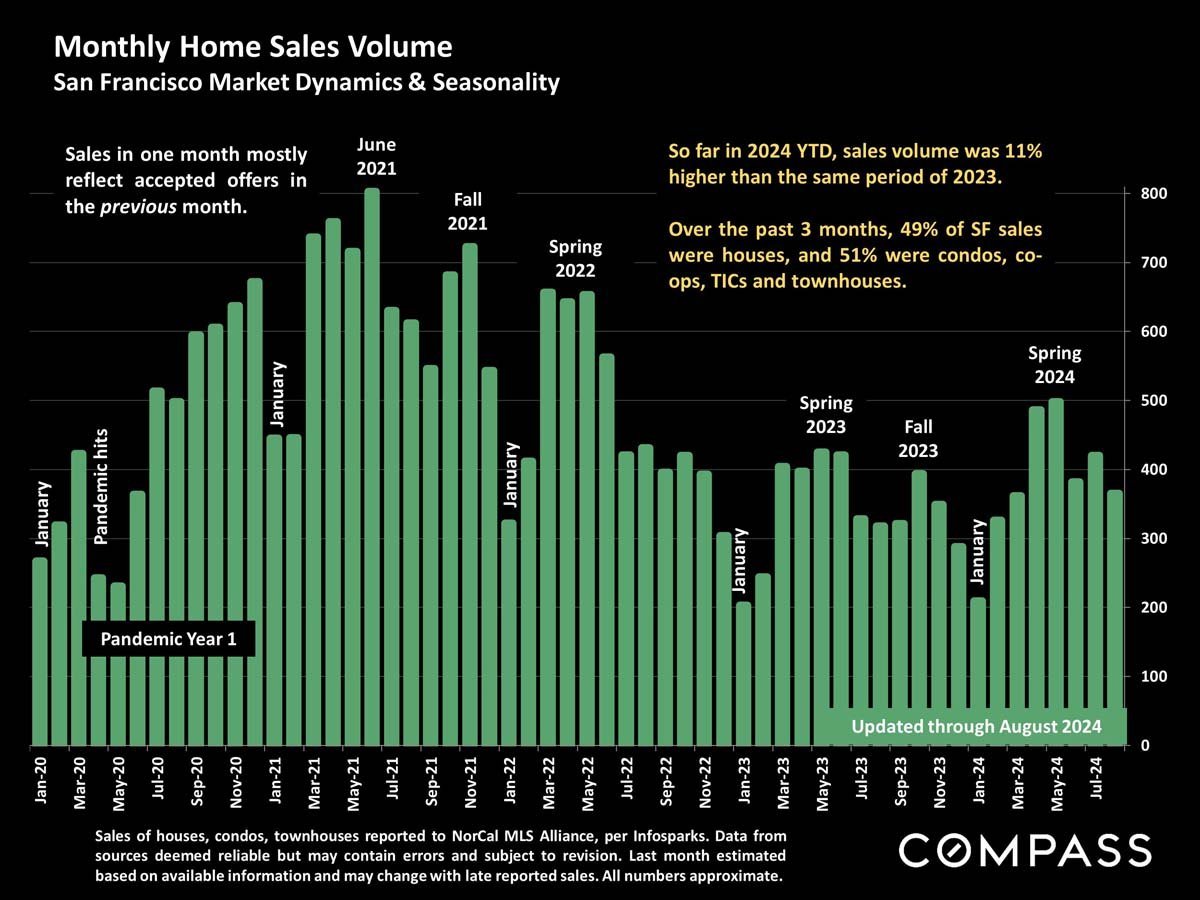
Chart of monthly San Francisco home sales, January 2020–August 2024, with seasonal milestones and year-over-year notes.
 
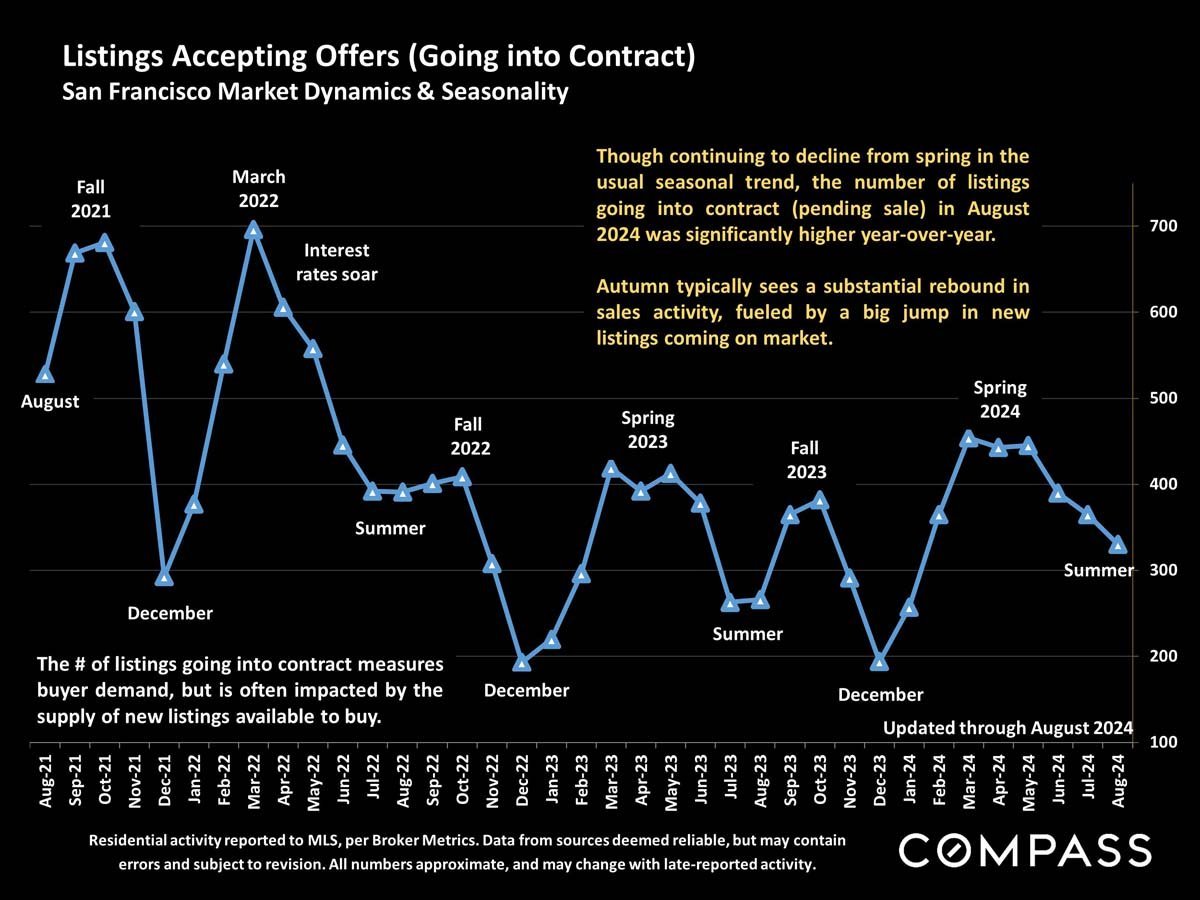
Chart of San Francisco listings going into contract, August 2021–August 2024, with seasonal trends marked.
 
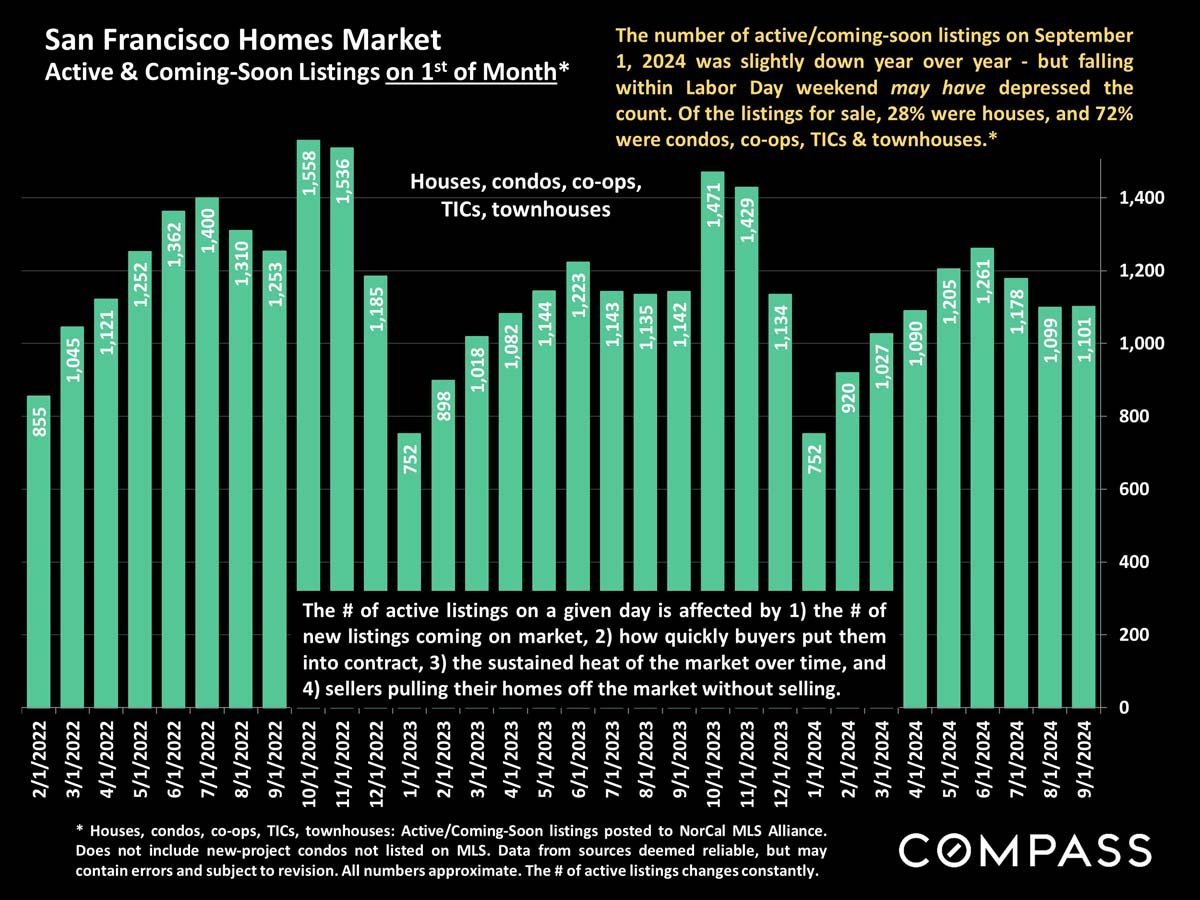
Bar chart of San Francisco active and coming-soon listings, February 2022–September 2024; September 2024 shows 1,101 listings.
 
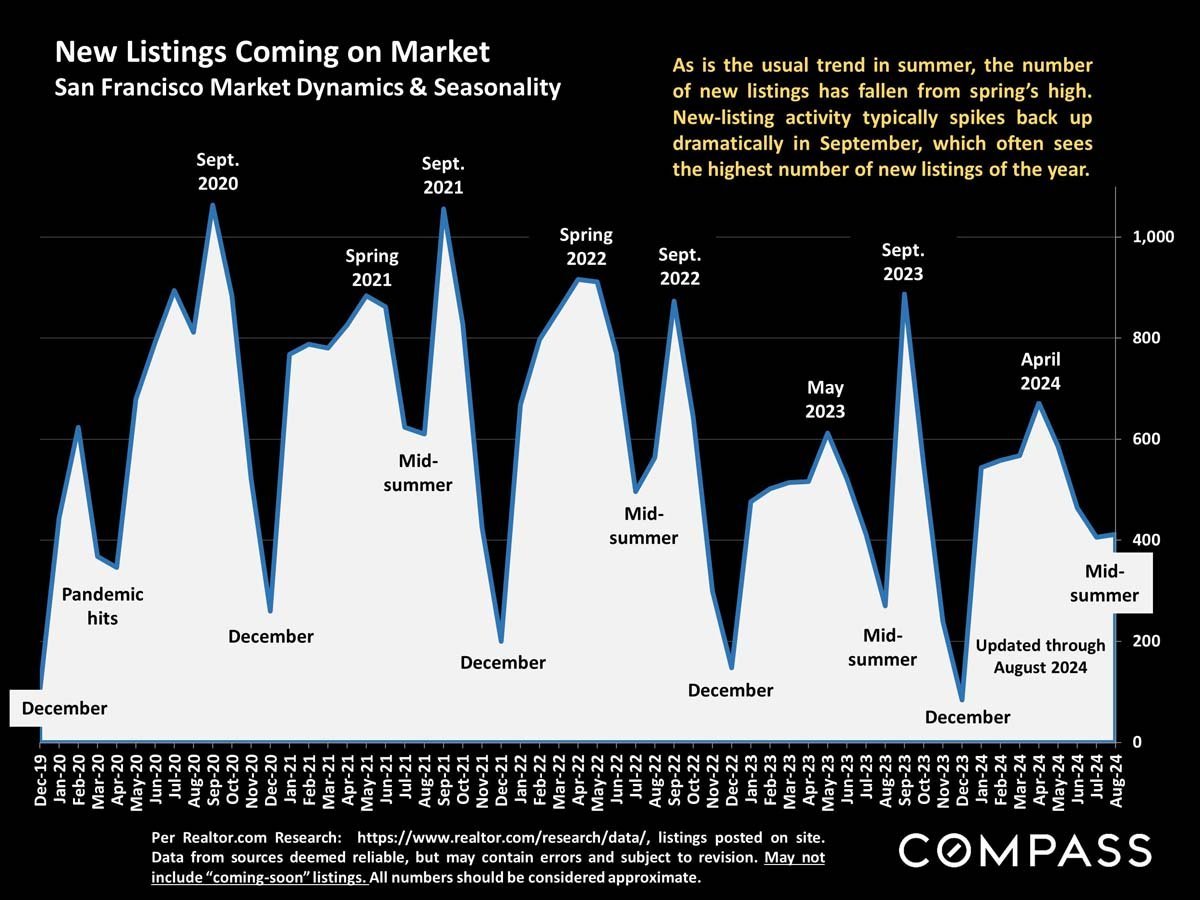
San Francisco new-listings chart showing seasonal September peaks and December lows from 2019 to 2024.
 
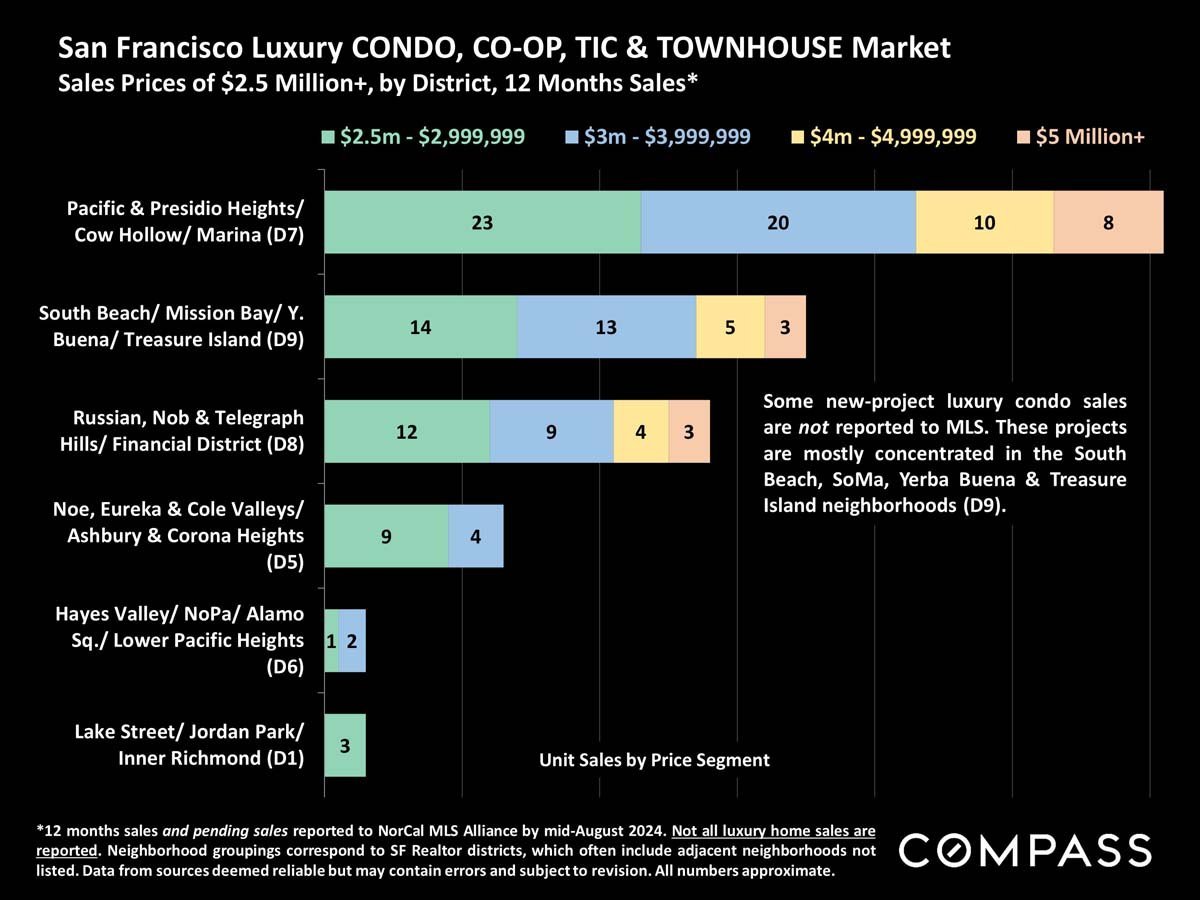
Chart of luxury condo, co-op, TIC, and townhouse sales by San Francisco district and price segment.
 
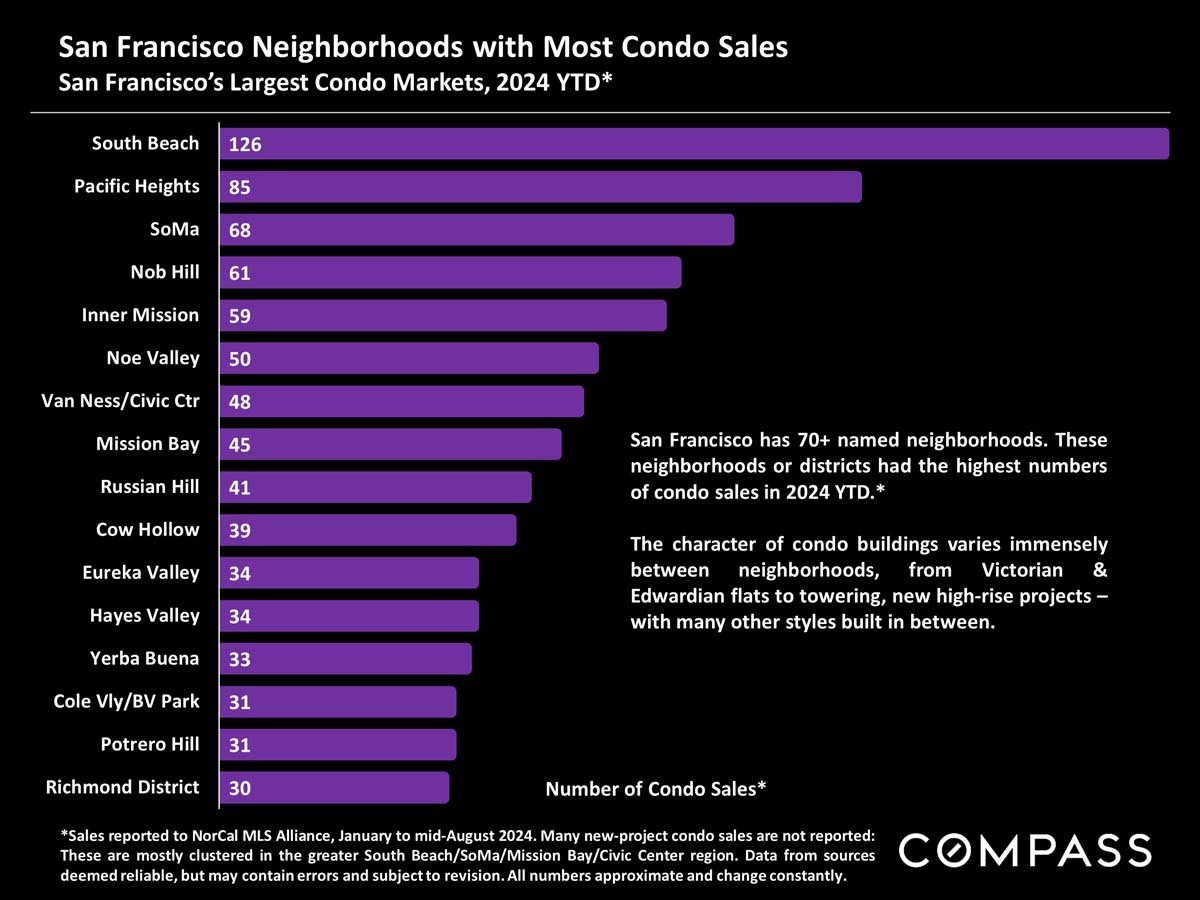
Chart of San Francisco condo sales by neighborhood in 2024; South Beach leads with 126 sales.
 
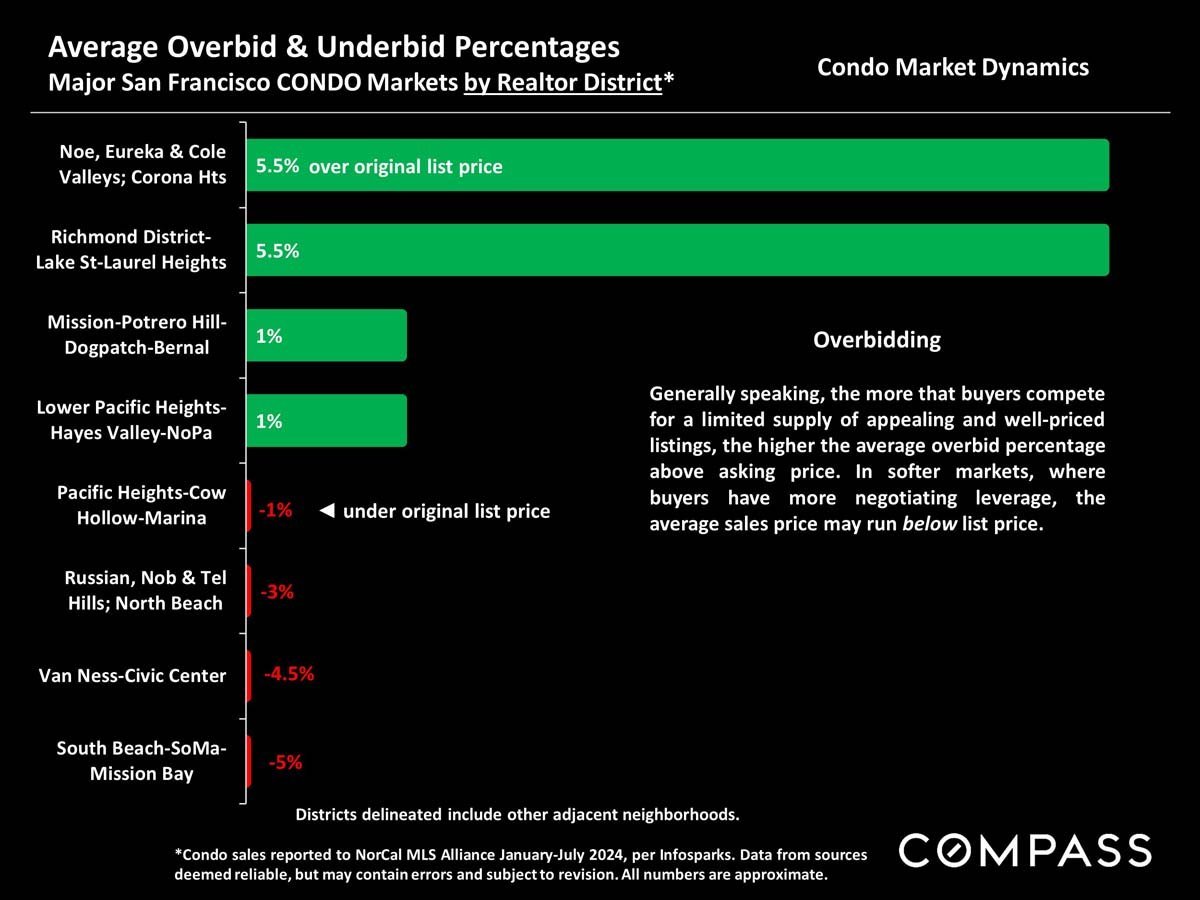
San Francisco condo overbid and underbid percentages by Realtor district, January–July 2024.
 
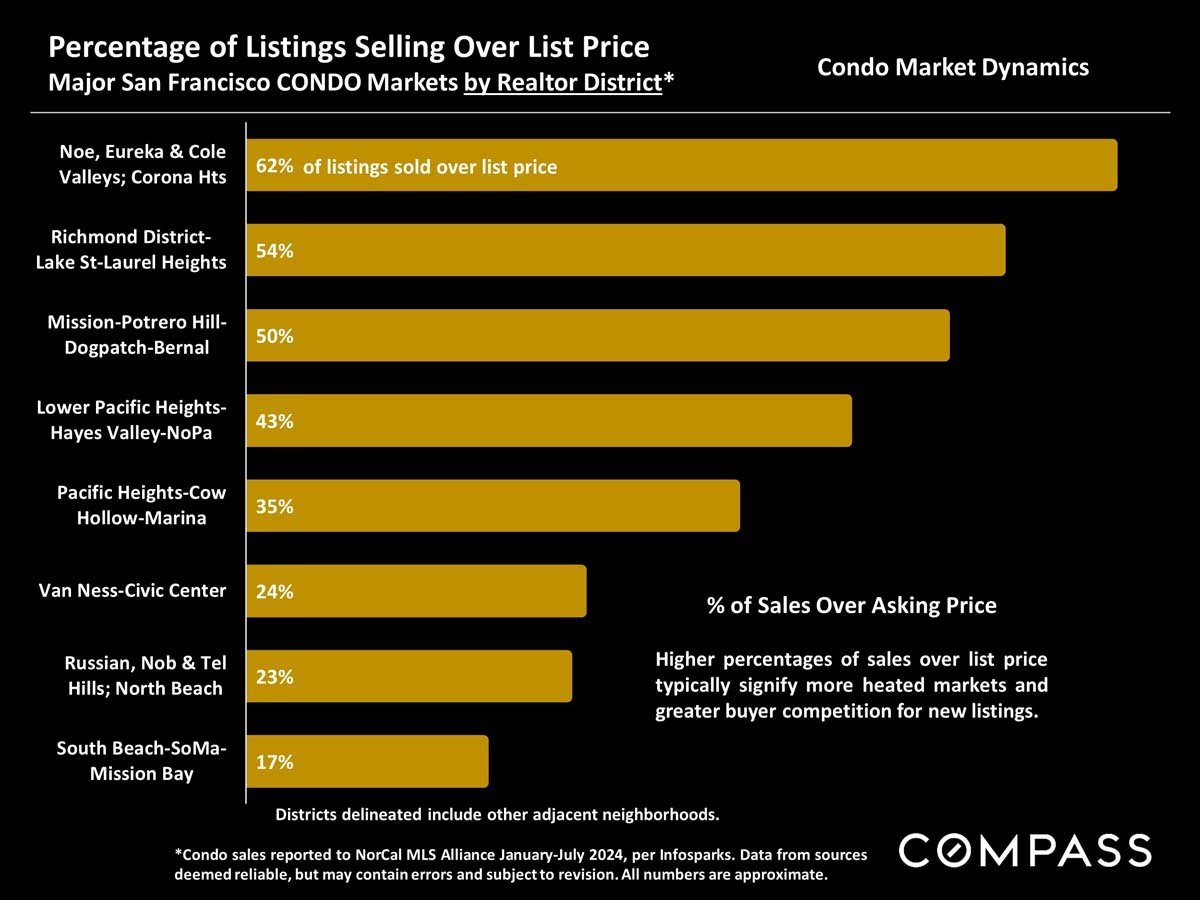
San Francisco condo chart showing the share of listings sold over asking price by district, led by Noe and Eureka at 62%.
 
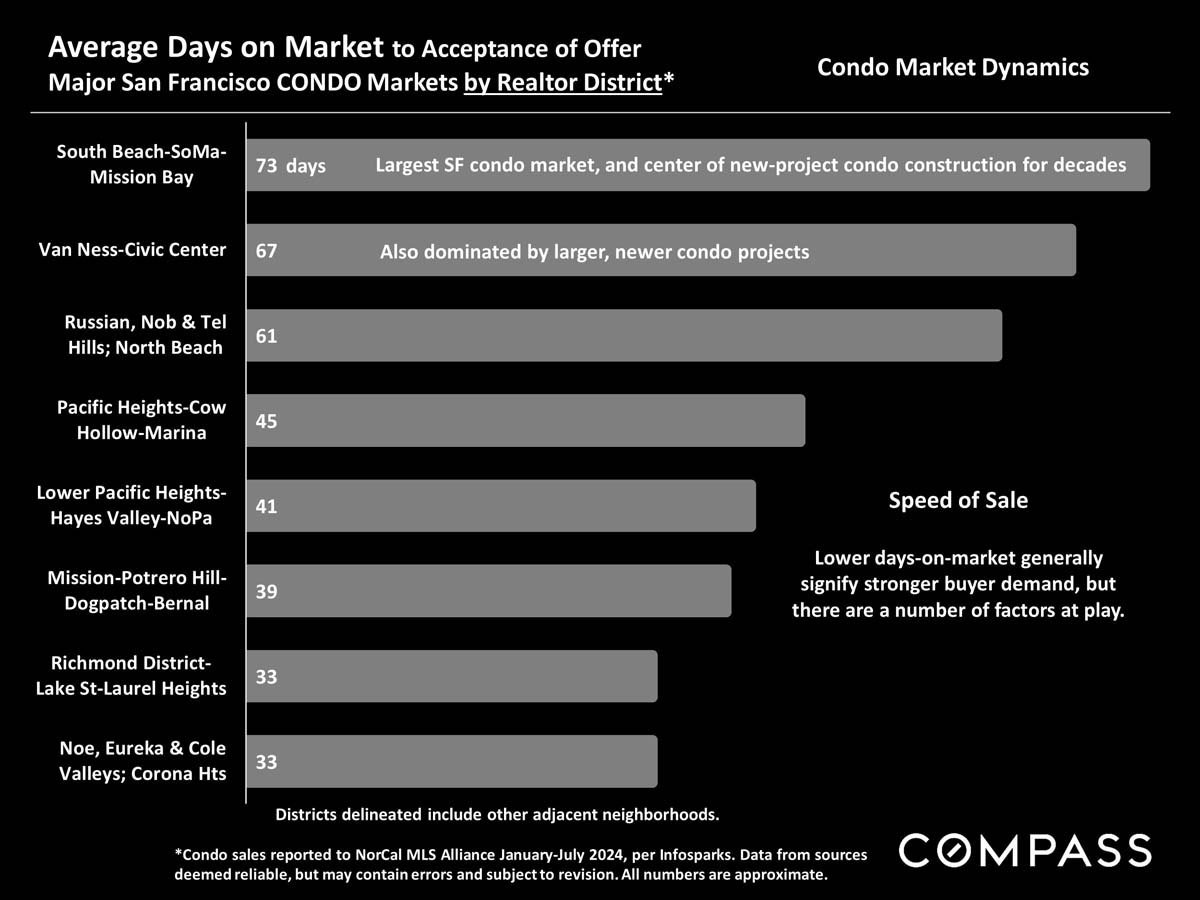
Chart compares average days to offer acceptance across San Francisco condo districts, ranging from 73 to 33 days.
 
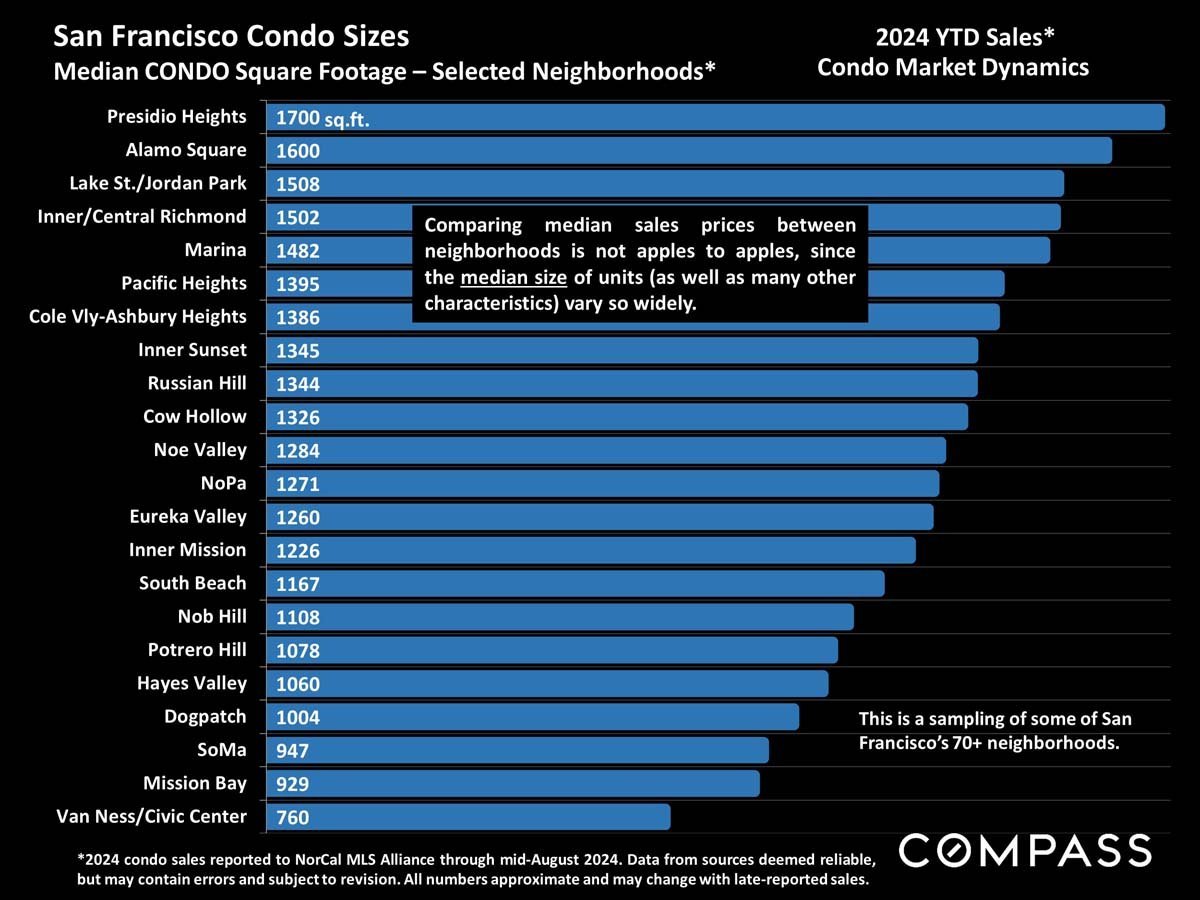
Bar chart comparing median condo square footage across 24 San Francisco neighborhoods, from 760 to 1,700 square feet.
 
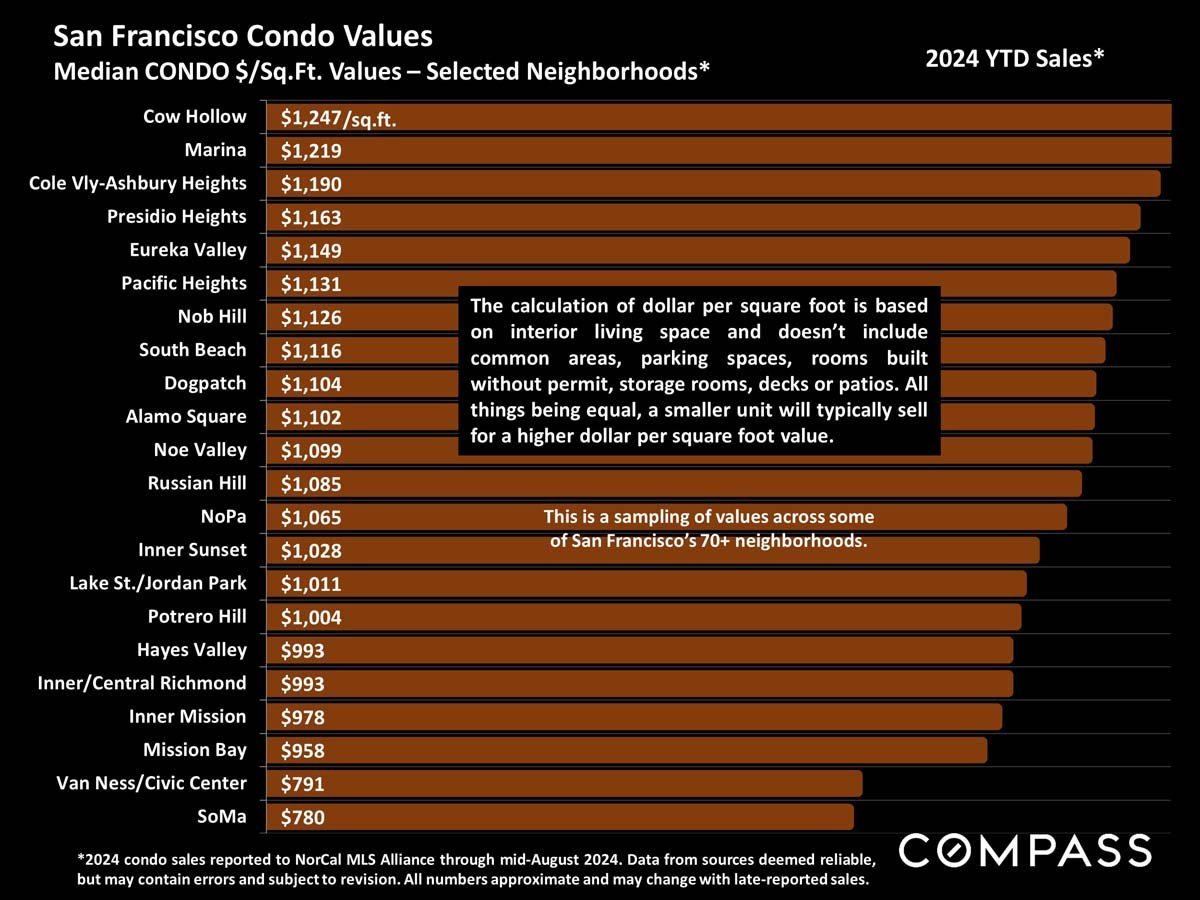
Bar chart of 2024 San Francisco condo median prices per square foot by neighborhood, from Cow Hollow to SoMa.
 
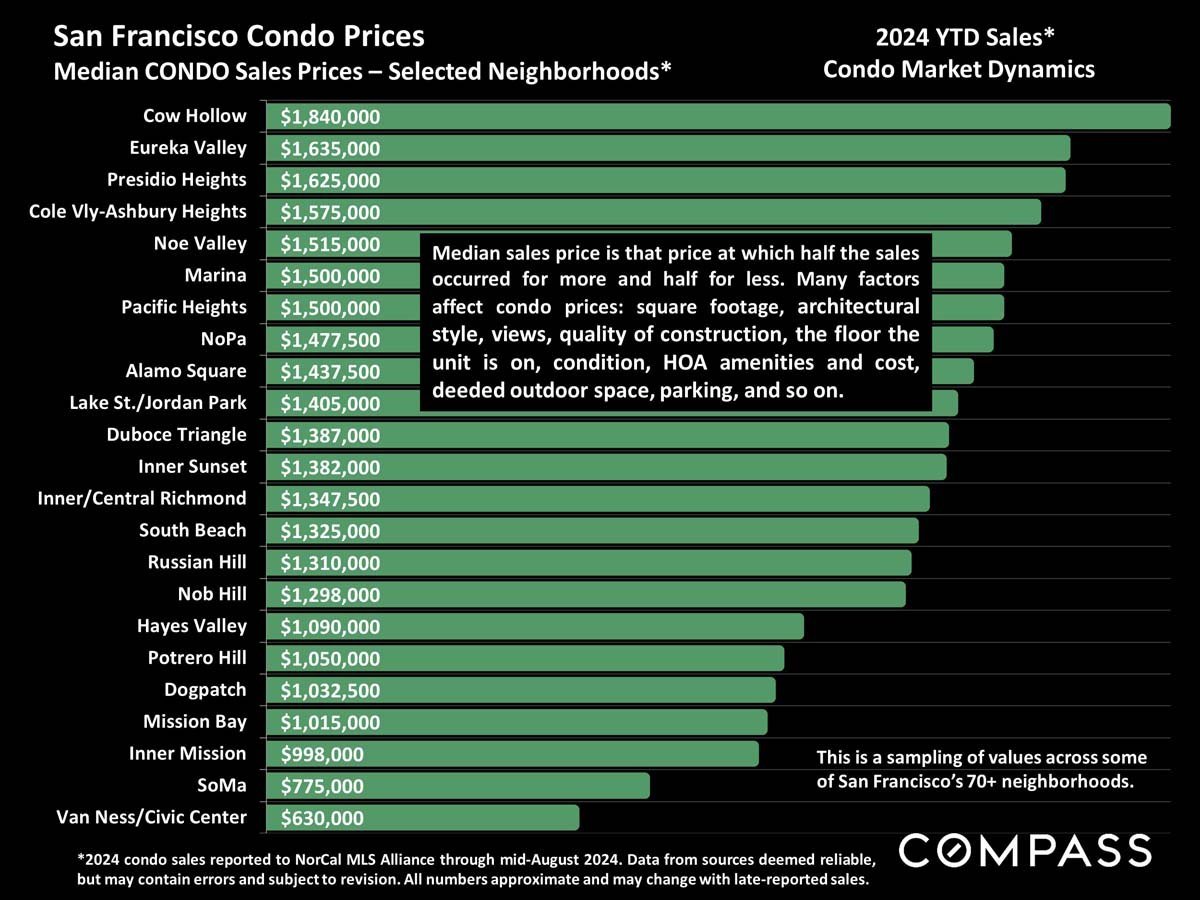
Chart of 2024 year-to-date median condo prices across selected San Francisco neighborhoods.
 
San Francisco condo market report by neighborhood and Realtor district, with the Golden Gate Bridge above the title.
 
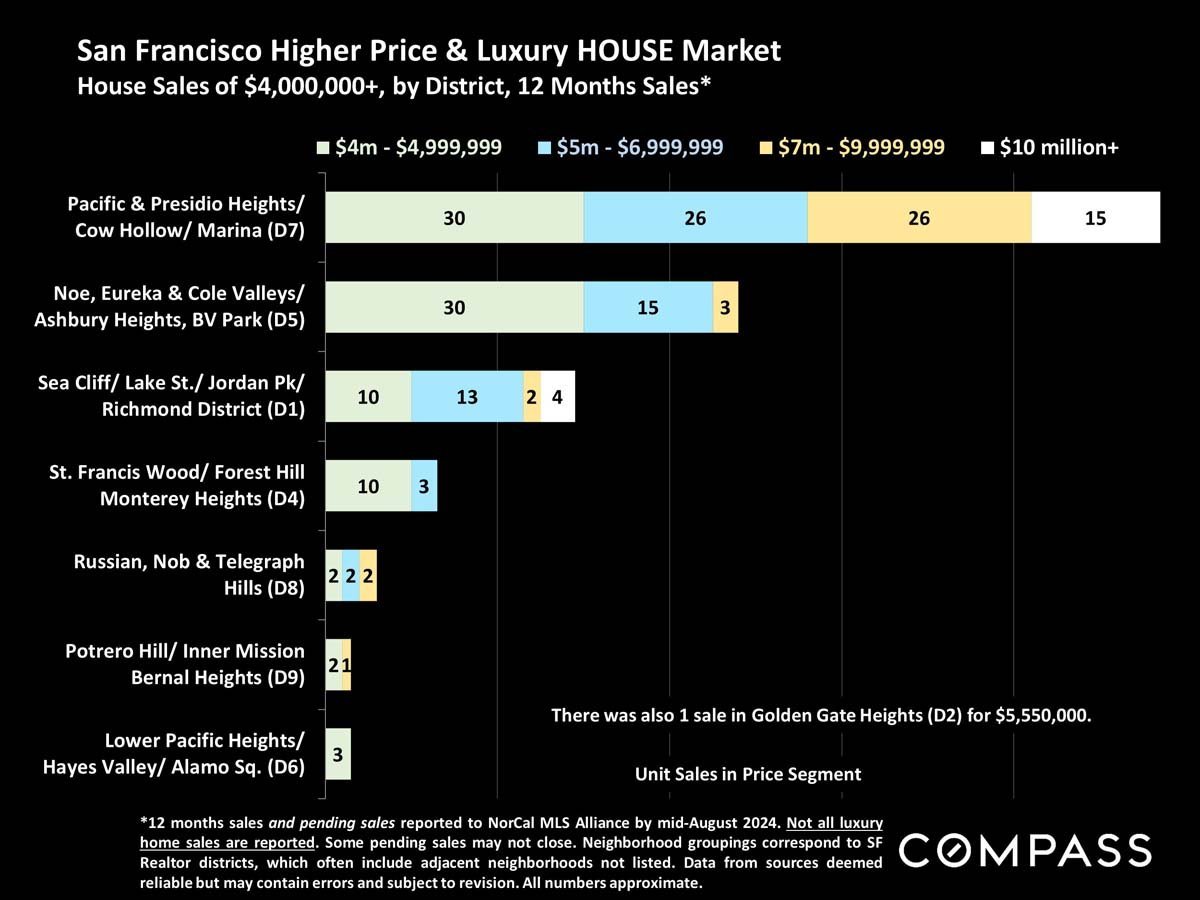
Chart of San Francisco luxury home sales by district and price range, with Pacific Heights and Marina leading.
 
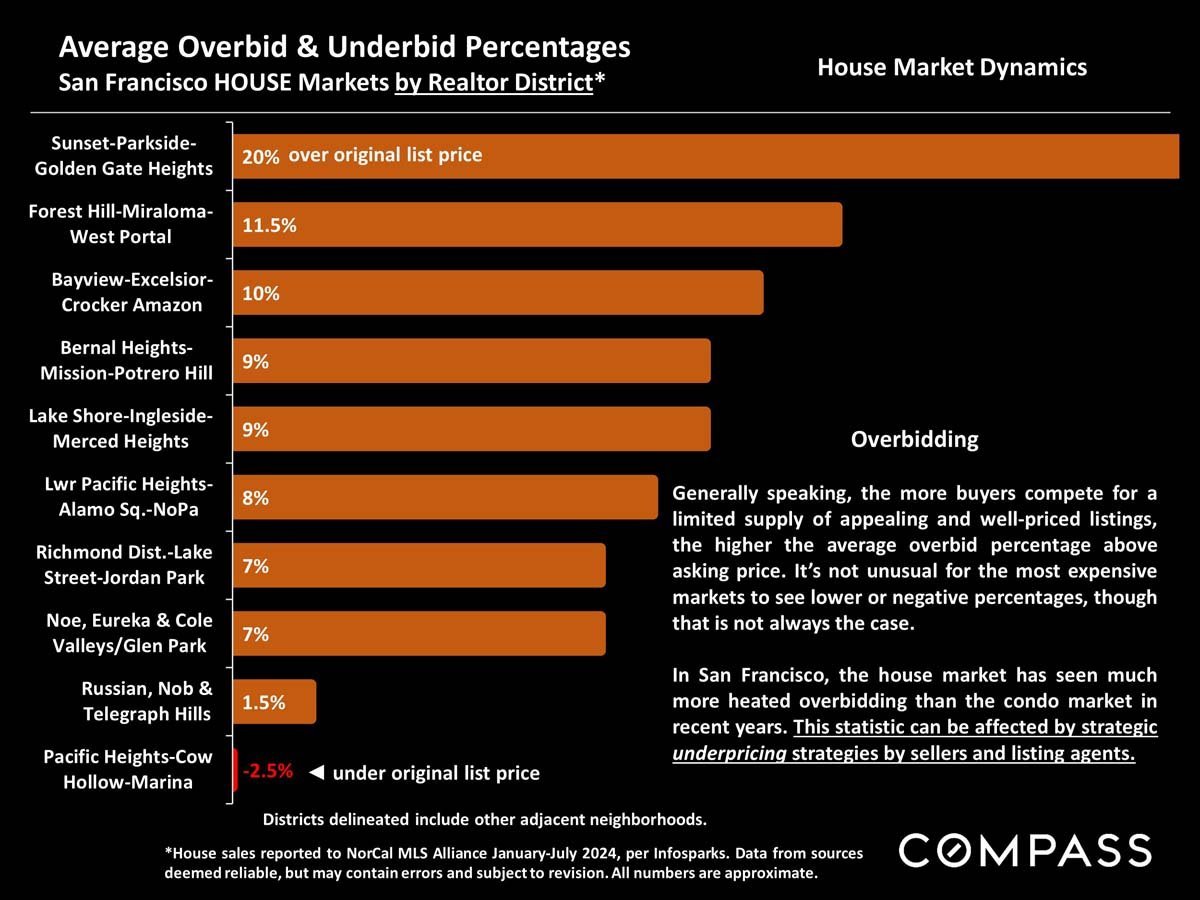
San Francisco house-market overbidding by realtor district, led by Sunset-Parkside-Golden Gate Heights at 20%.
 
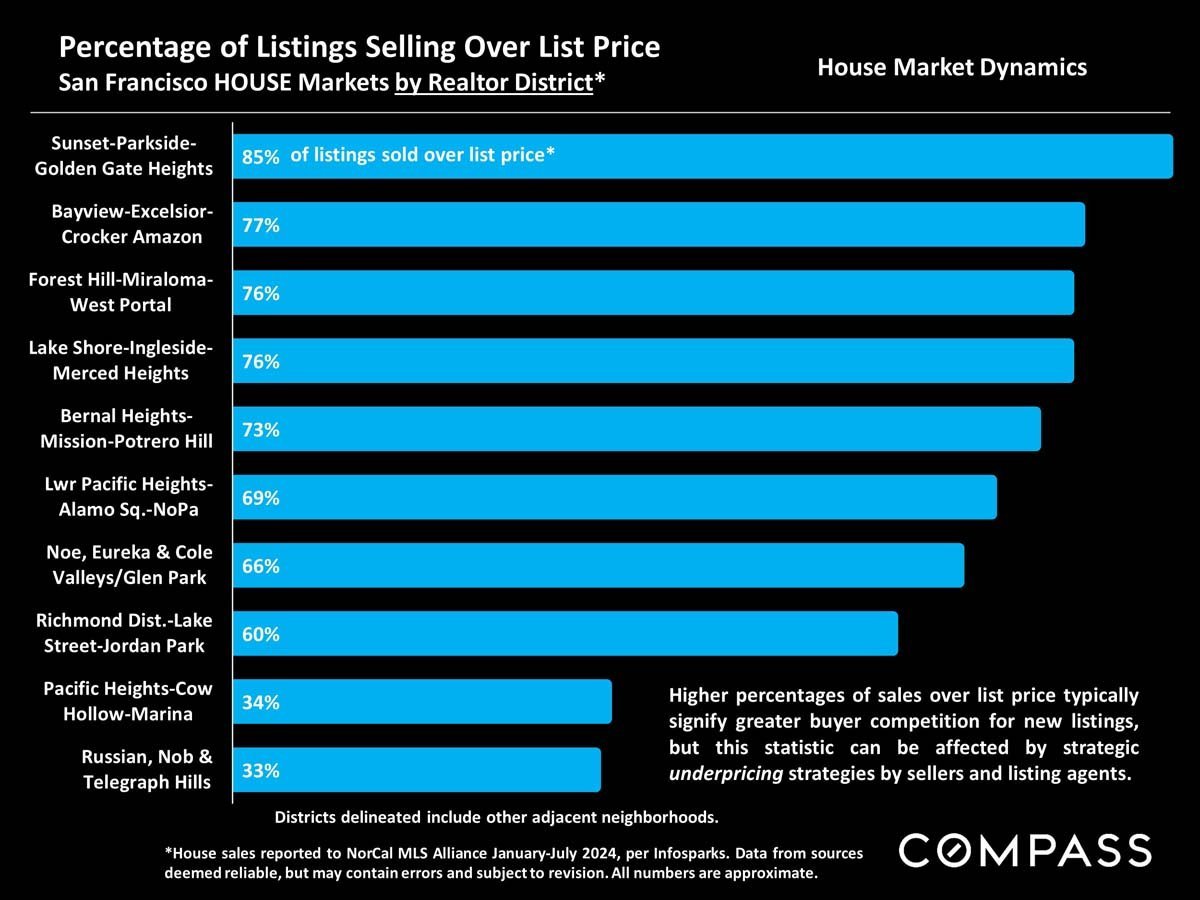
Bar chart of San Francisco districts’ listings sold over asking price, ranging from 33% to 85%.
 
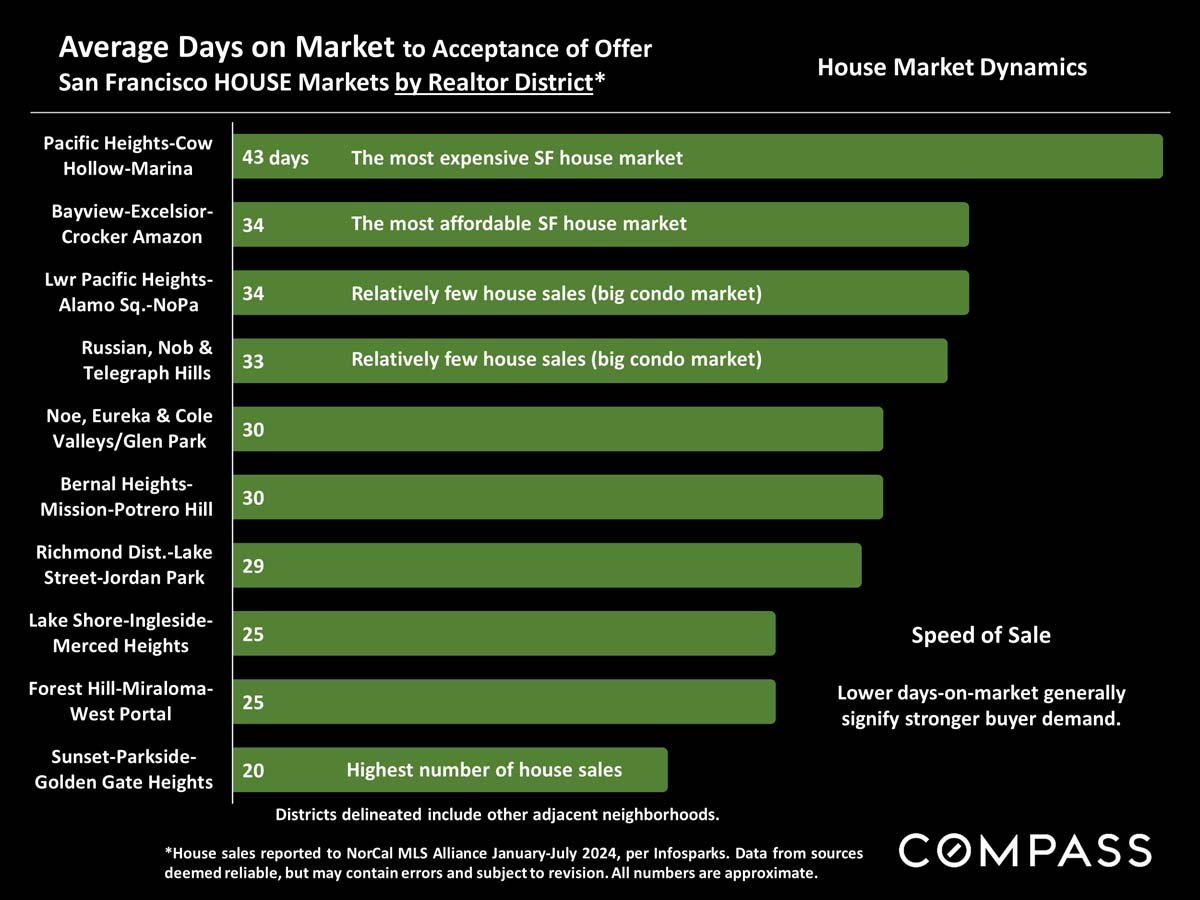
Bar chart of San Francisco house market days on market by district, ranging from 20 days in Sunset-Parkside to 43 in Pacific Heights.
 
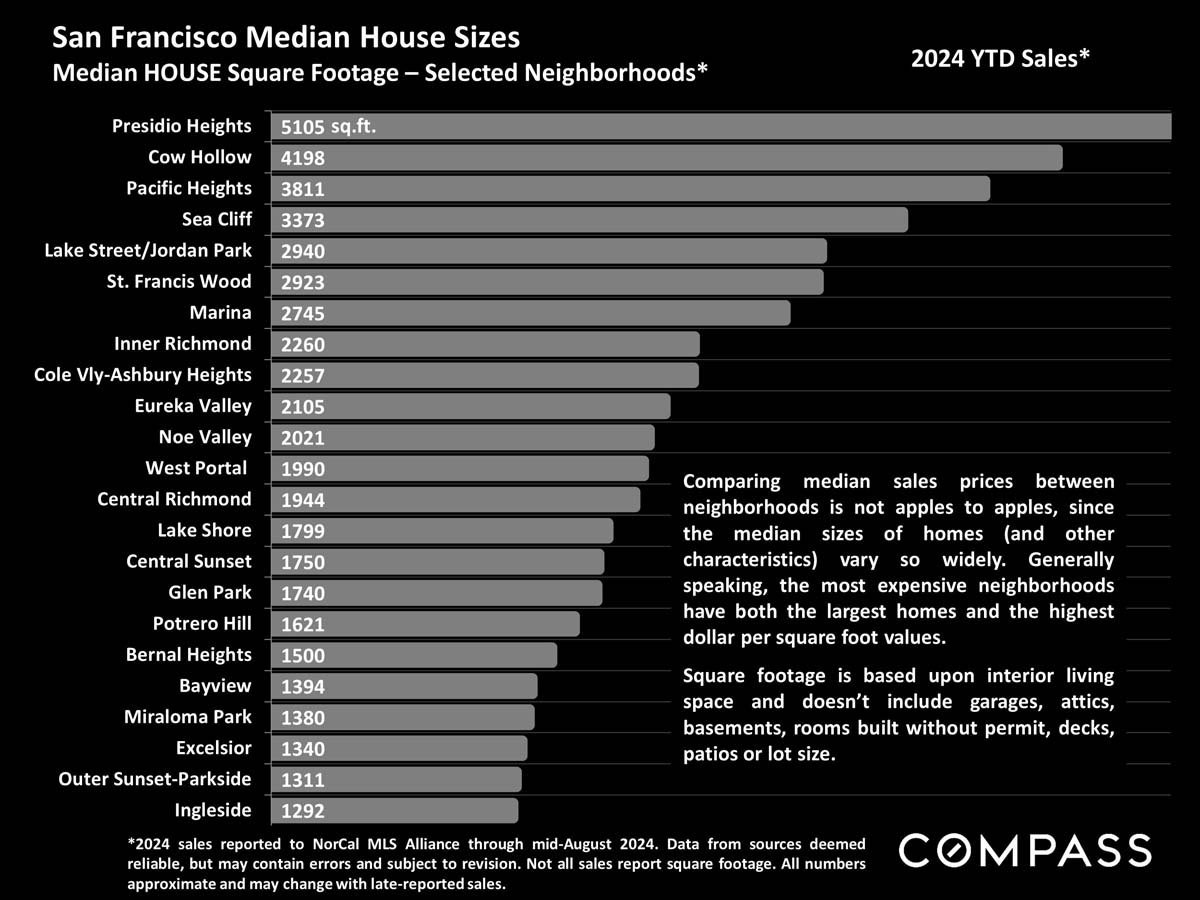
Chart comparing median house square footage across selected San Francisco neighborhoods.
 
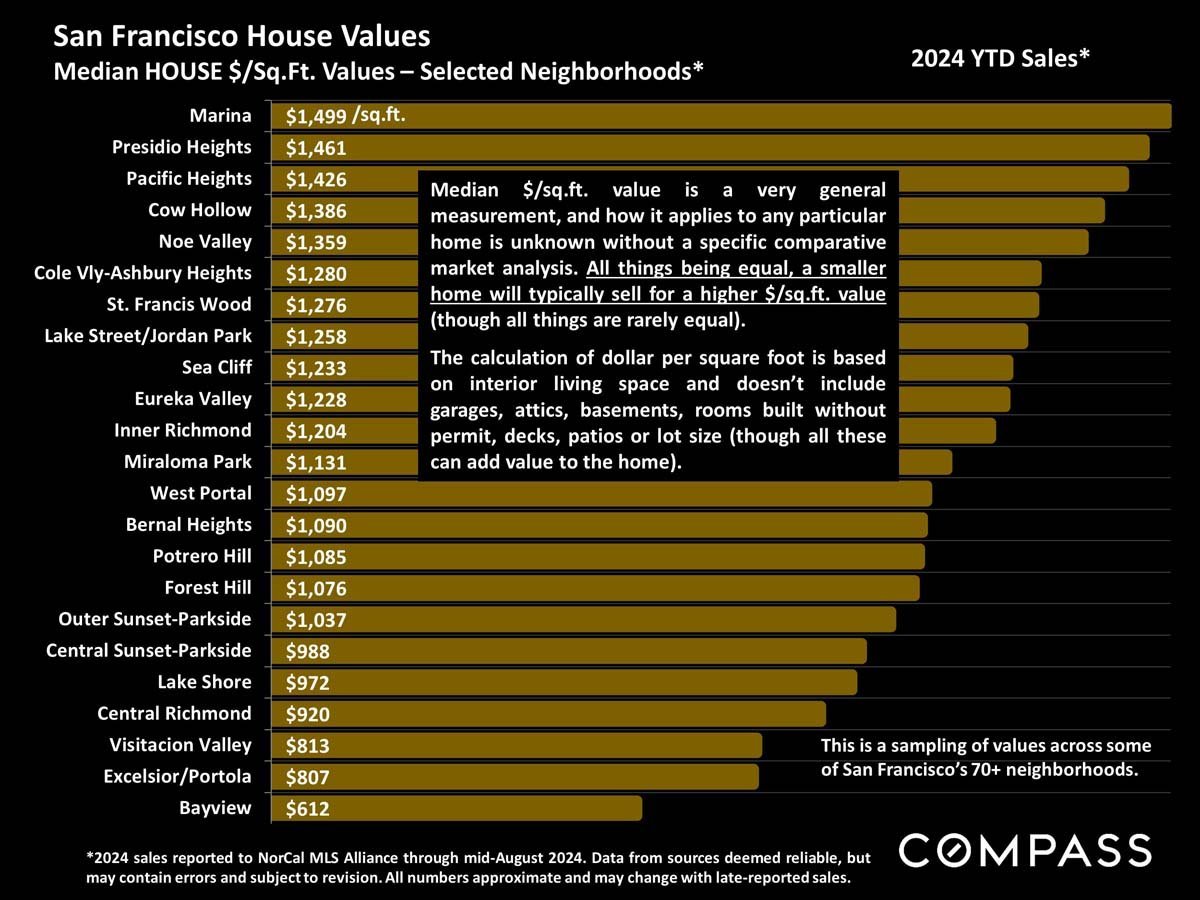
Chart of median San Francisco home values per square foot, from Marina at $1,499 to Bayview at $612.
 
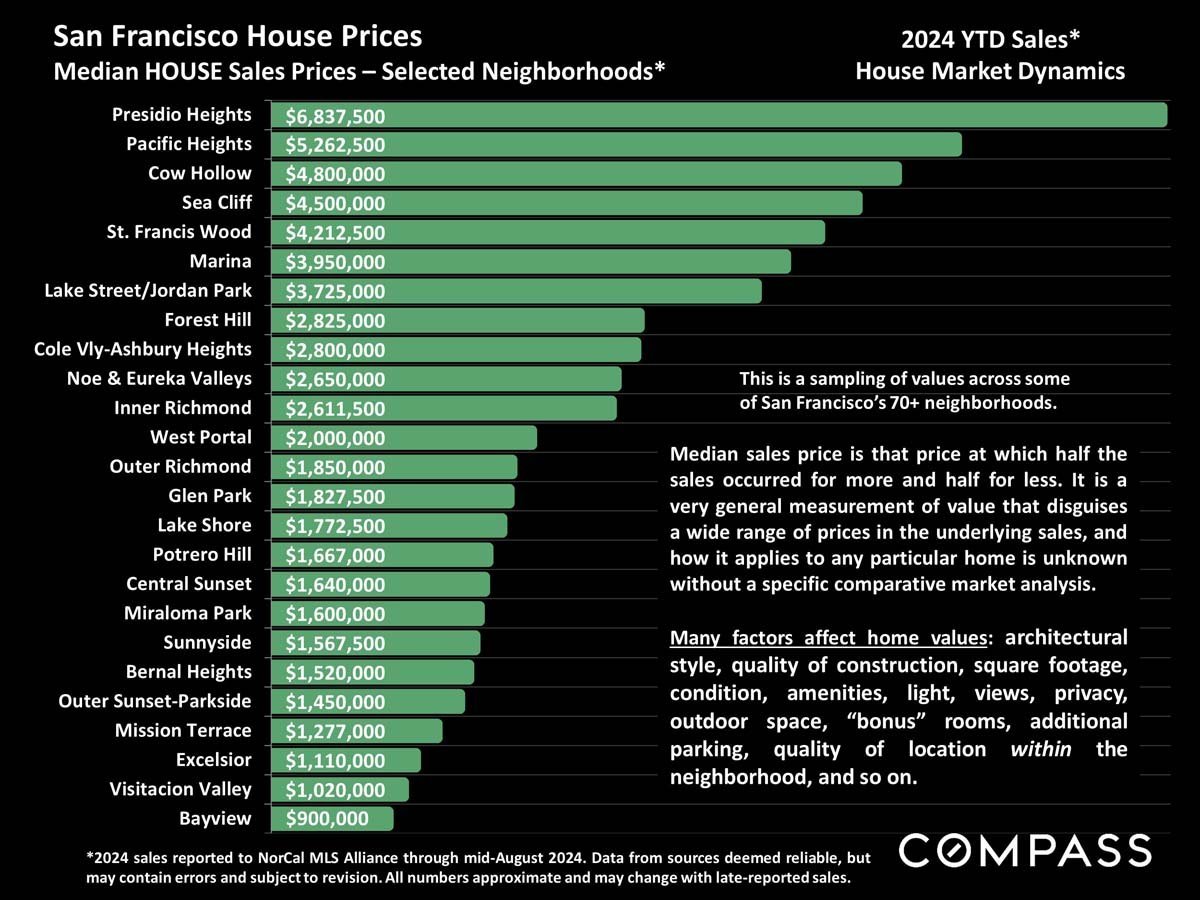
Chart of 2024 median house prices across selected San Francisco neighborhoods, from Presidio Heights to Bayview.
 
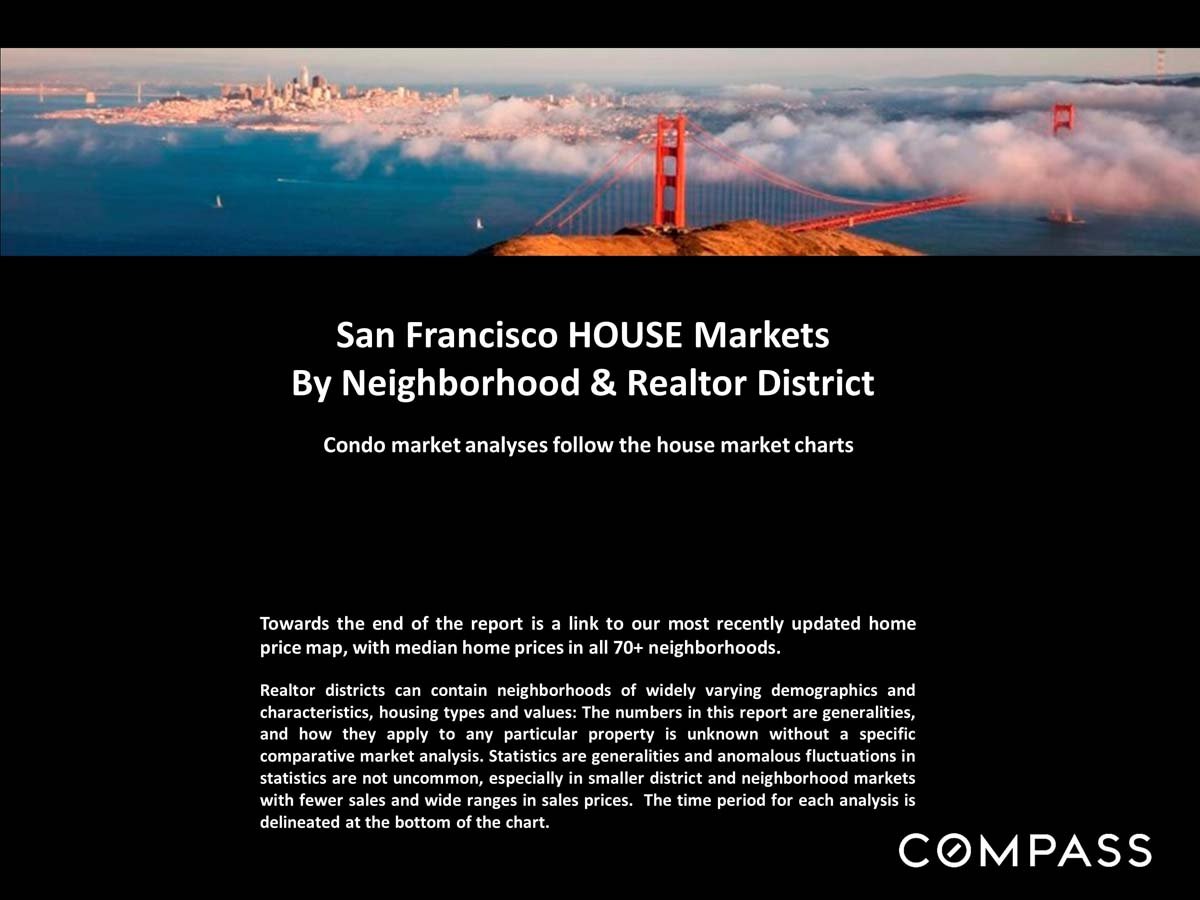
San Francisco home market report cover with Golden Gate Bridge panorama and Compass branding.
 
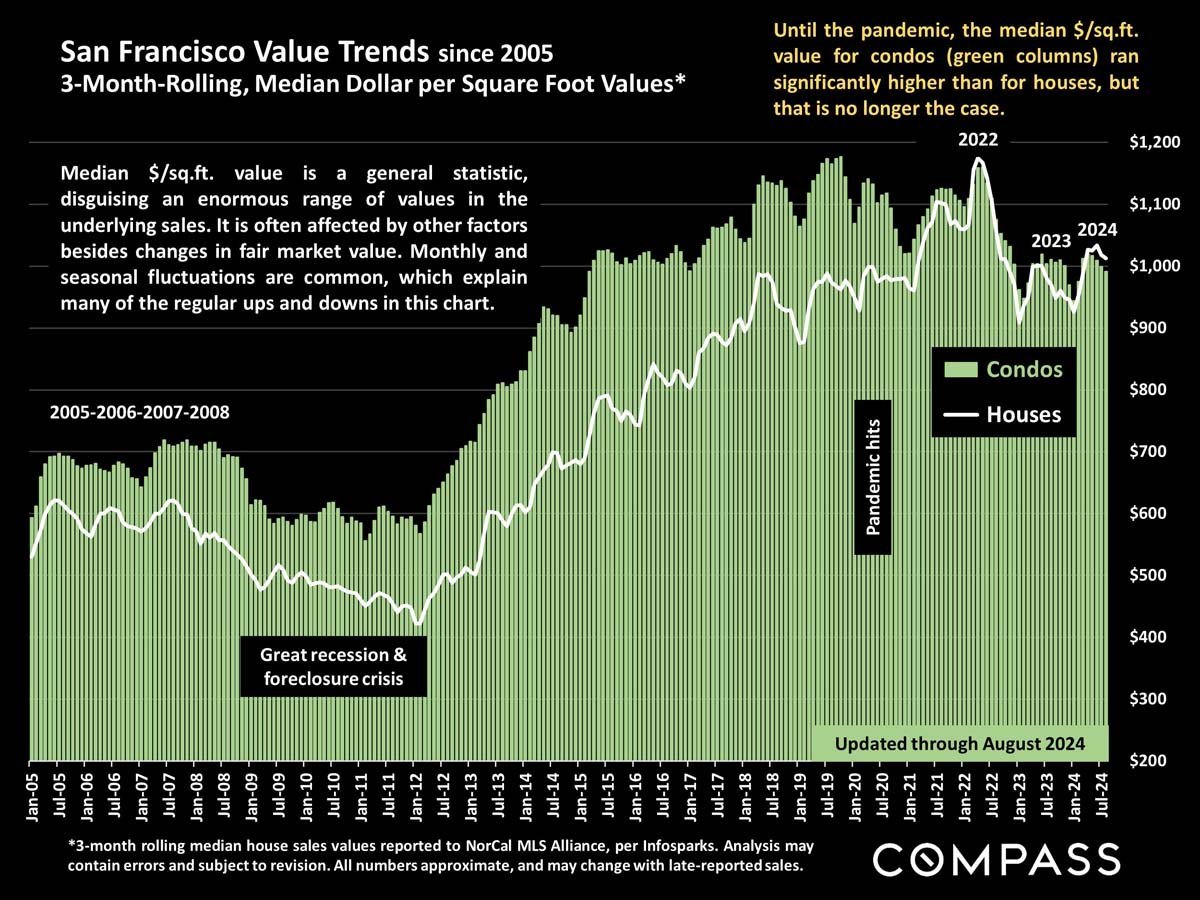
Chart comparing San Francisco condo and house prices per square foot from 2005 to 2024.
 
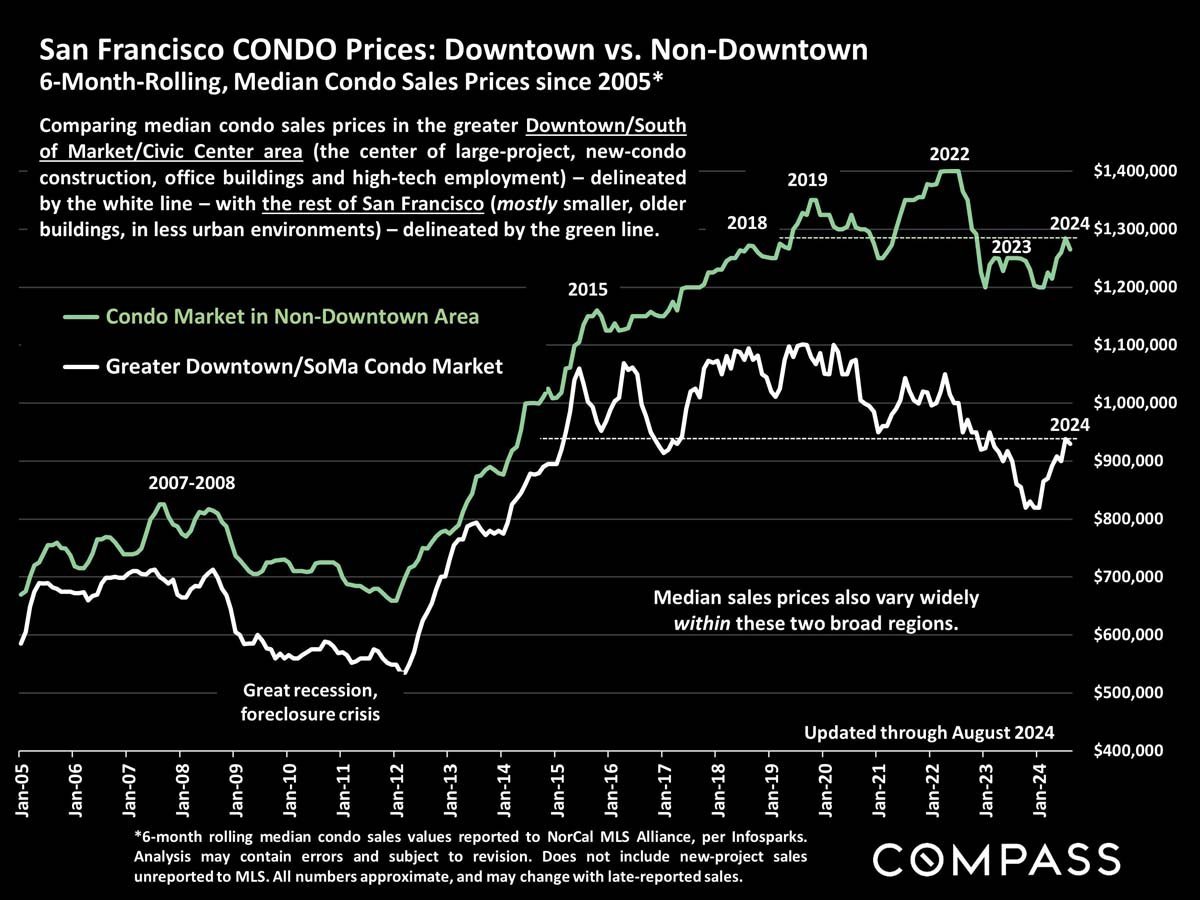
Chart comparing San Francisco Downtown/SoMa and non-Downtown condo prices from 2005 to August 2024.
 
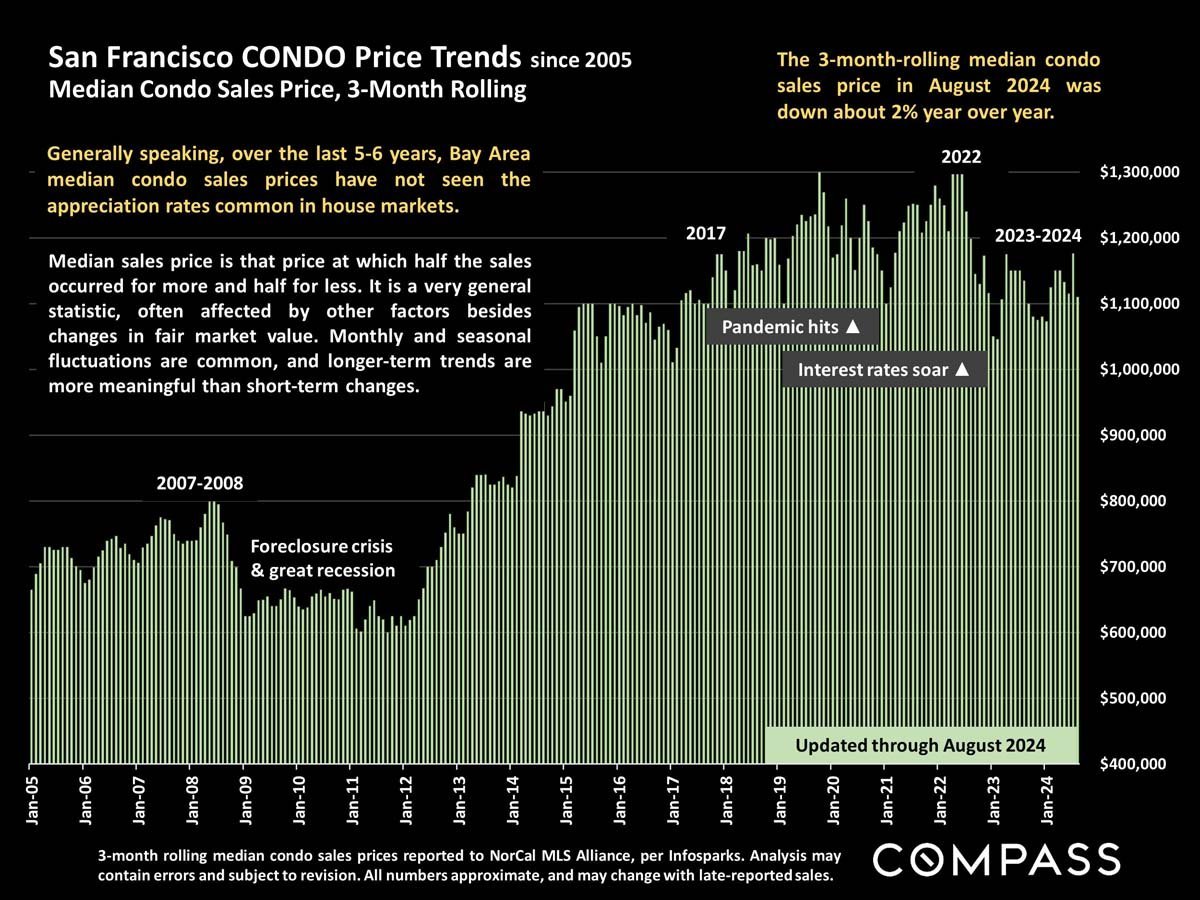
San Francisco condo price trend chart, showing rolling median sales prices from 2005 through August 2024.
 
Chart of San Francisco median house prices since 1990, peaking in 2022 and updated through August 2024.
 
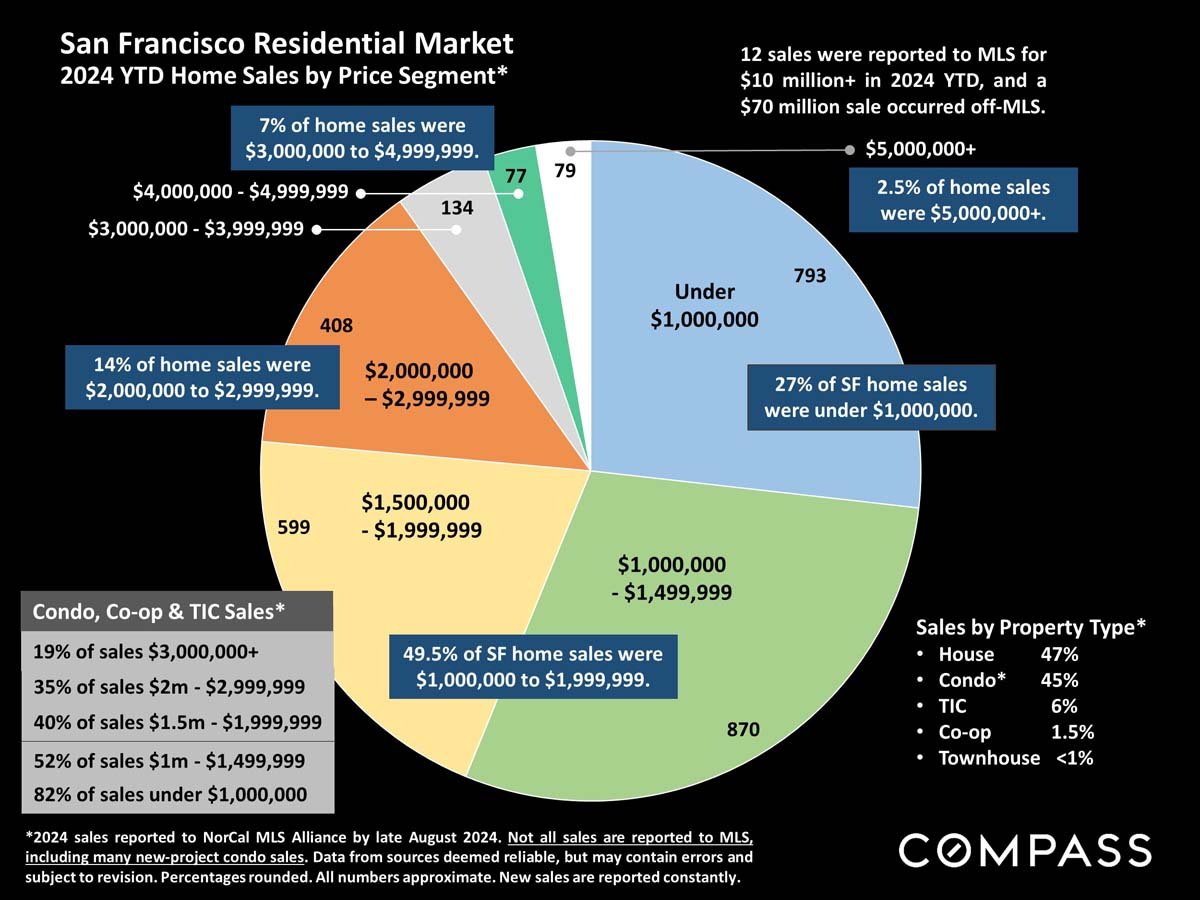
San Francisco 2024 year-to-date home sales infographic with price-segment pie chart and property-type statistics.
 
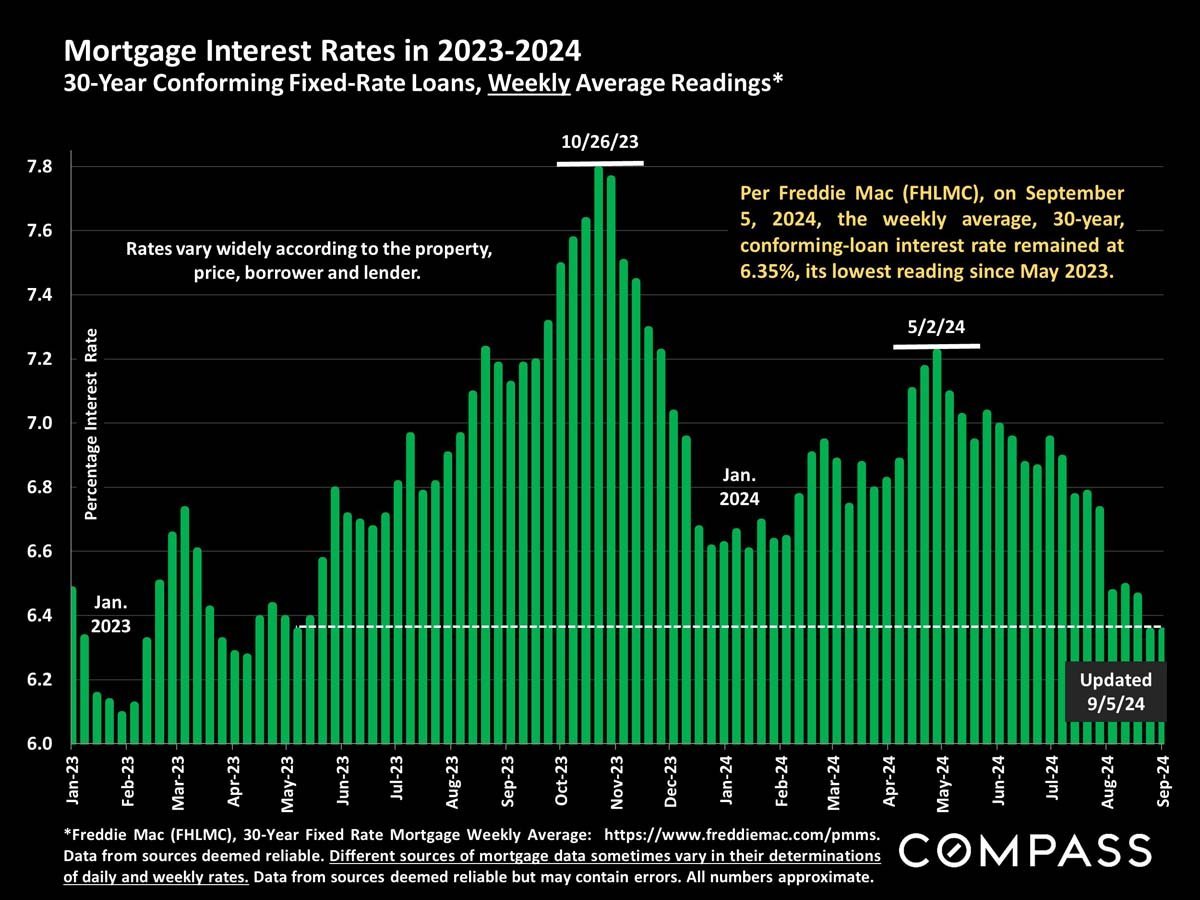
Bar chart of weekly 30-year fixed mortgage rates from January 2023 to September 2024, peaking near 7.8%.
 
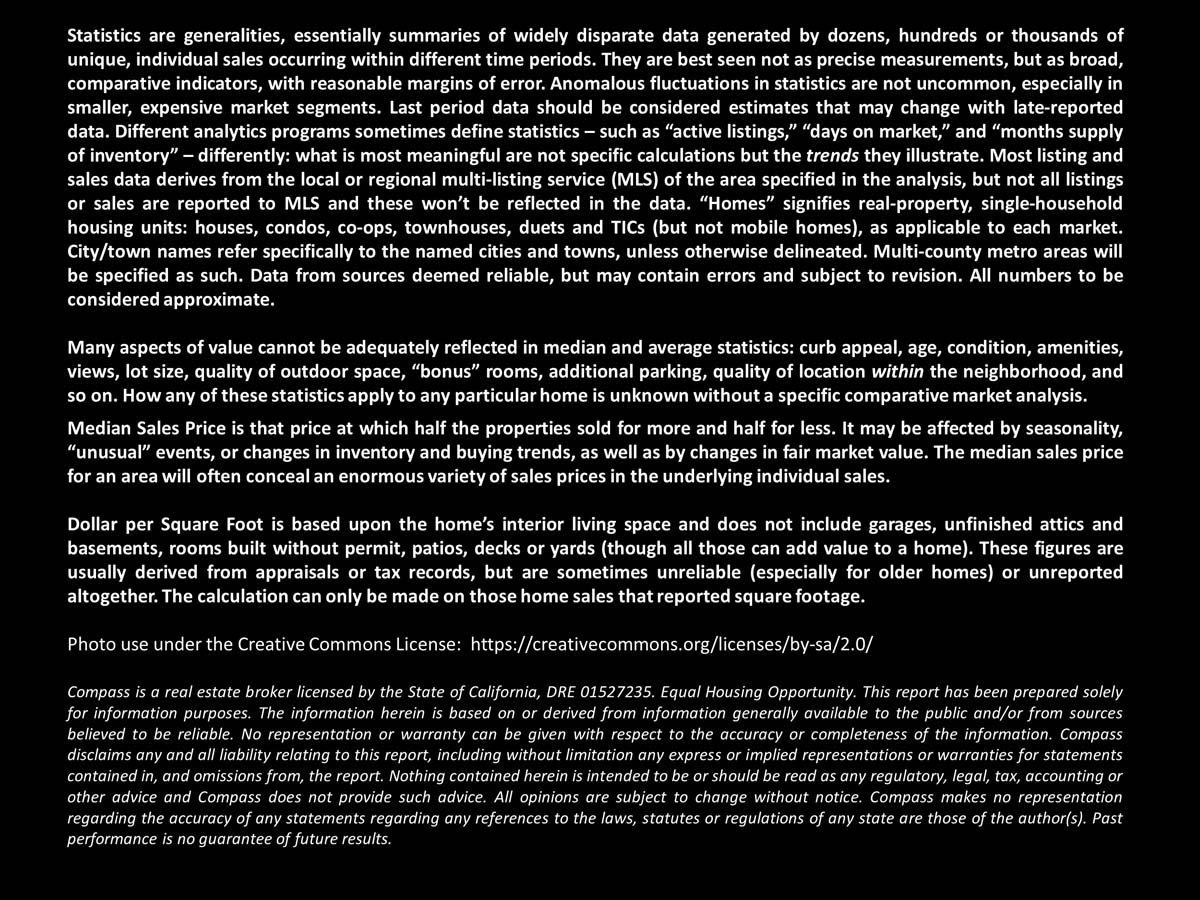
Market report notes explain real estate statistics, pricing measures, photo licensing, and legal disclaimers.

Work With Jane

Get assistance in determining the current property value, crafting a competitive offer, writing and negotiating a contract, and much more. Contact me today.

Follow Me on Instagram