San Francisco Real Estate September 2025 report cover with a panoramic view of the city and Golden Gate Bridge.

San Francisco Home Prices, Market Conditions & Trends September 2025

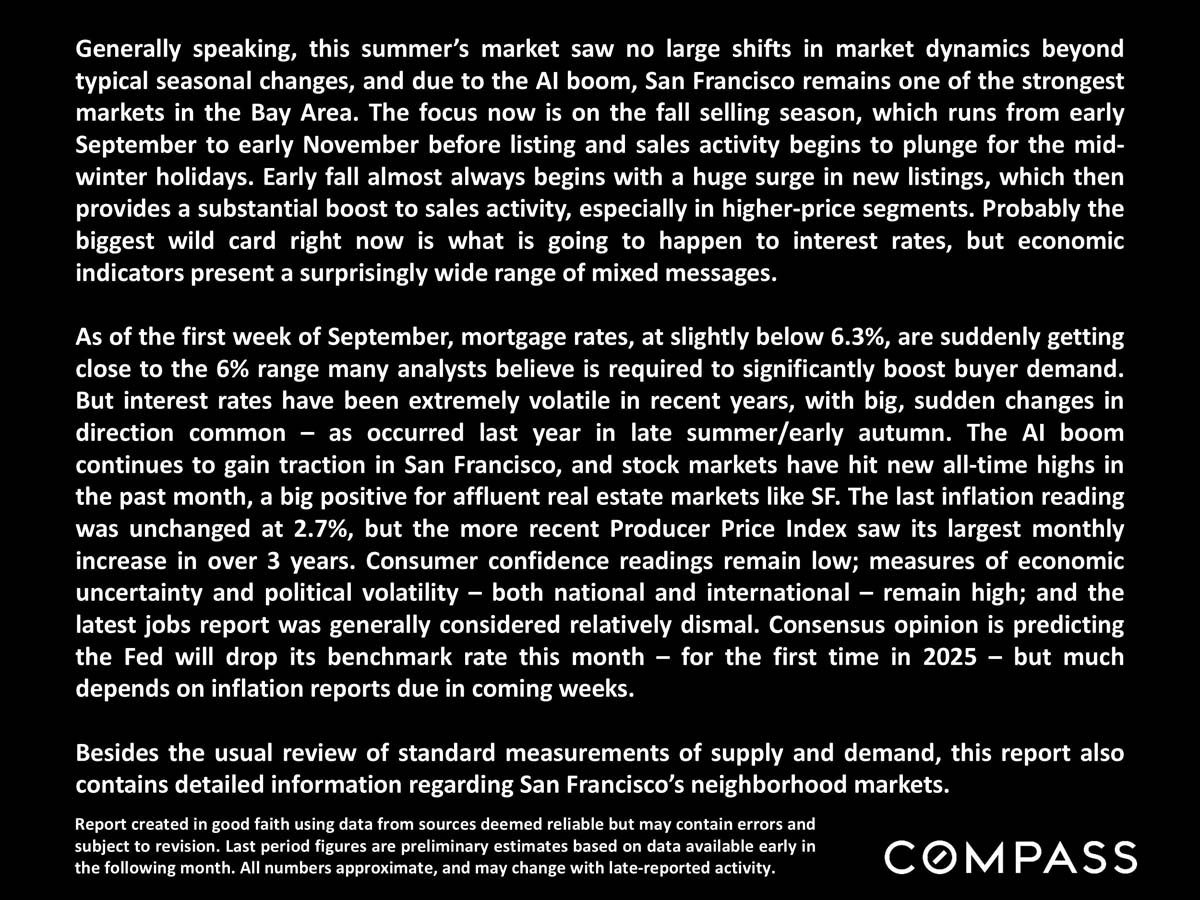
Generally speaking, this summer’s market saw no large shifts in market dynamics beyond typical seasonal changes, and due to the AI boom, San Francisco remains one of the strongest markets in the Bay Area.
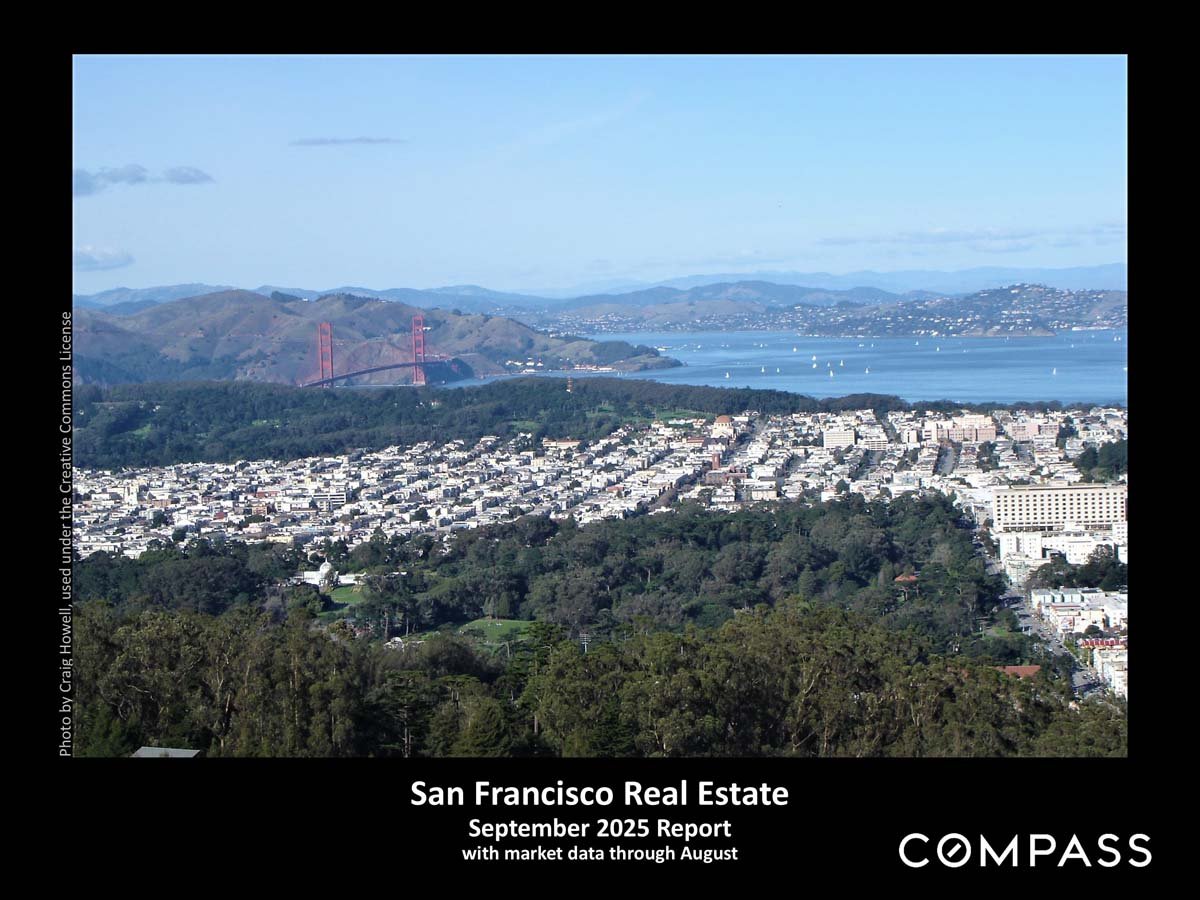
San Francisco Real Estate September 2025 report cover with a panoramic view of the city and Golden Gate Bridge.

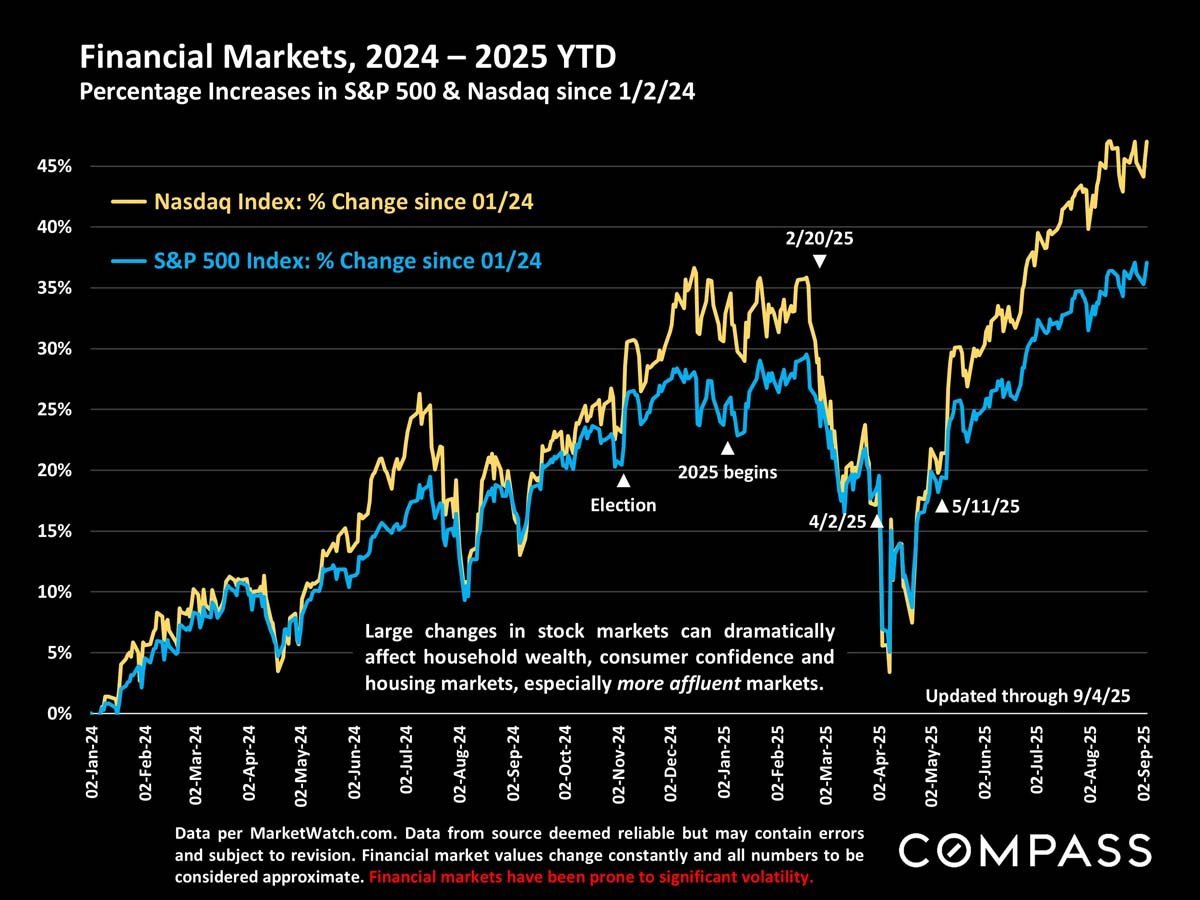
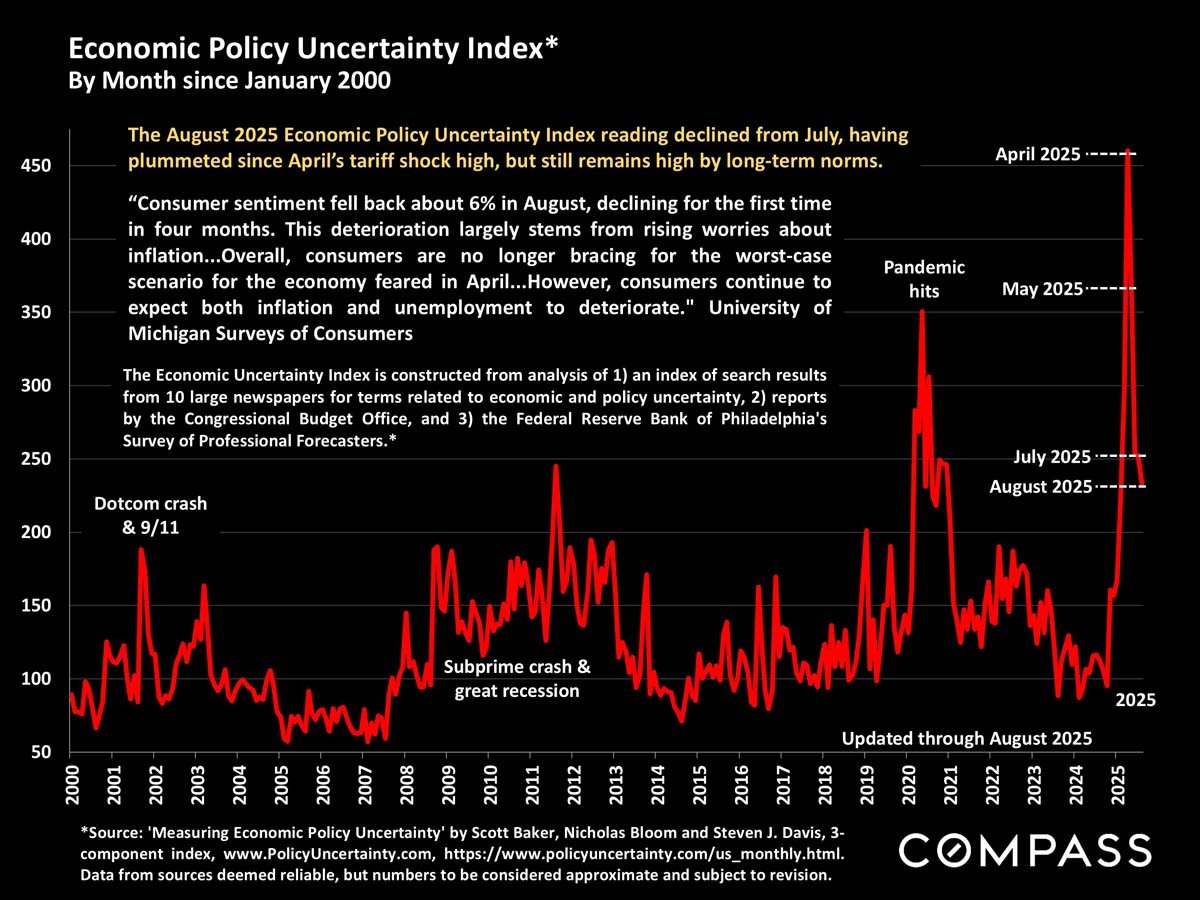
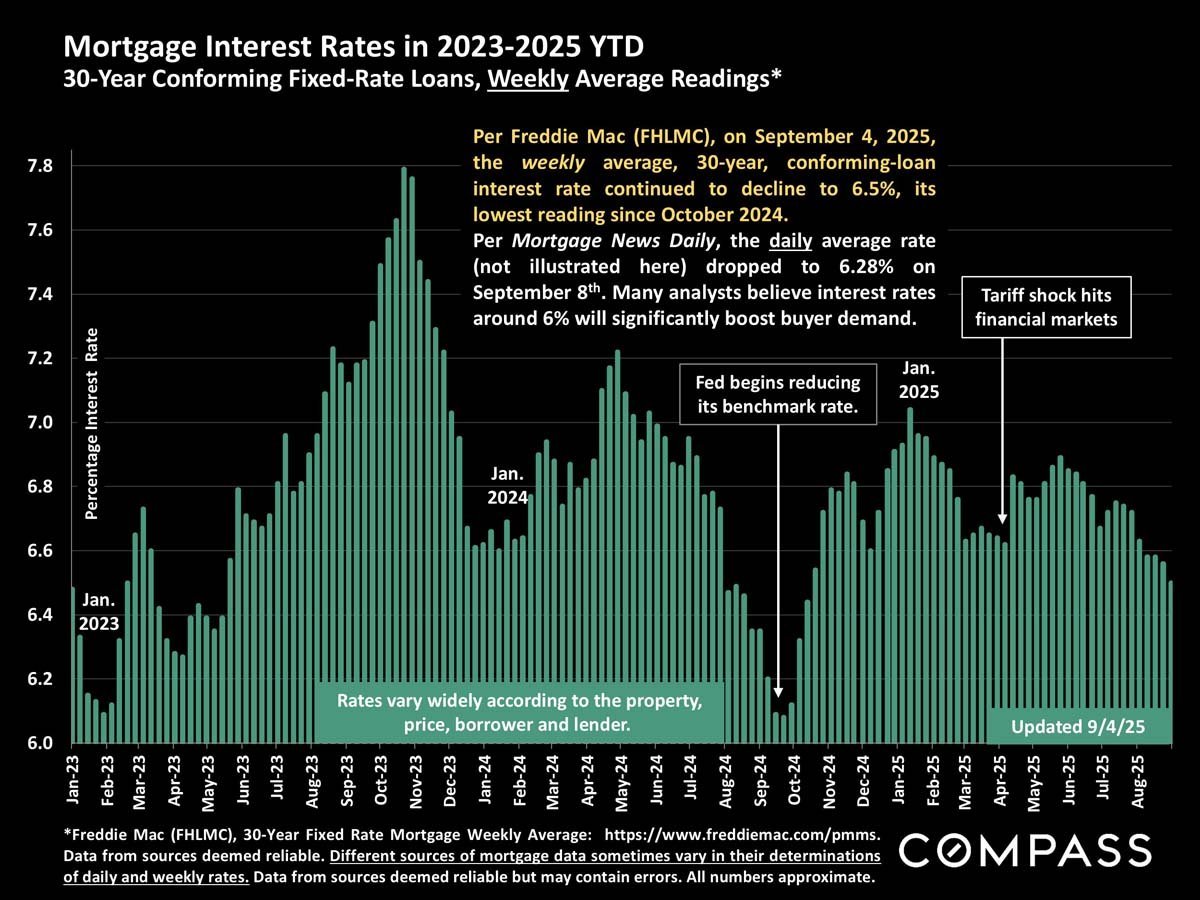
September 2025 San Francisco housing market overview, covering fall market activity, mortgage rates, and economic conditions.Chart of weekly 30-year conforming mortgage rates from 2023 to 2025, with rate peaks and market-event annotations.Chart comparing Nasdaq and S&P 500 gains from January 2024 through September 2025; Nasdaq ends higher.Economic policy uncertainty chart, with a sharp April 2025 spike and declining readings through August.

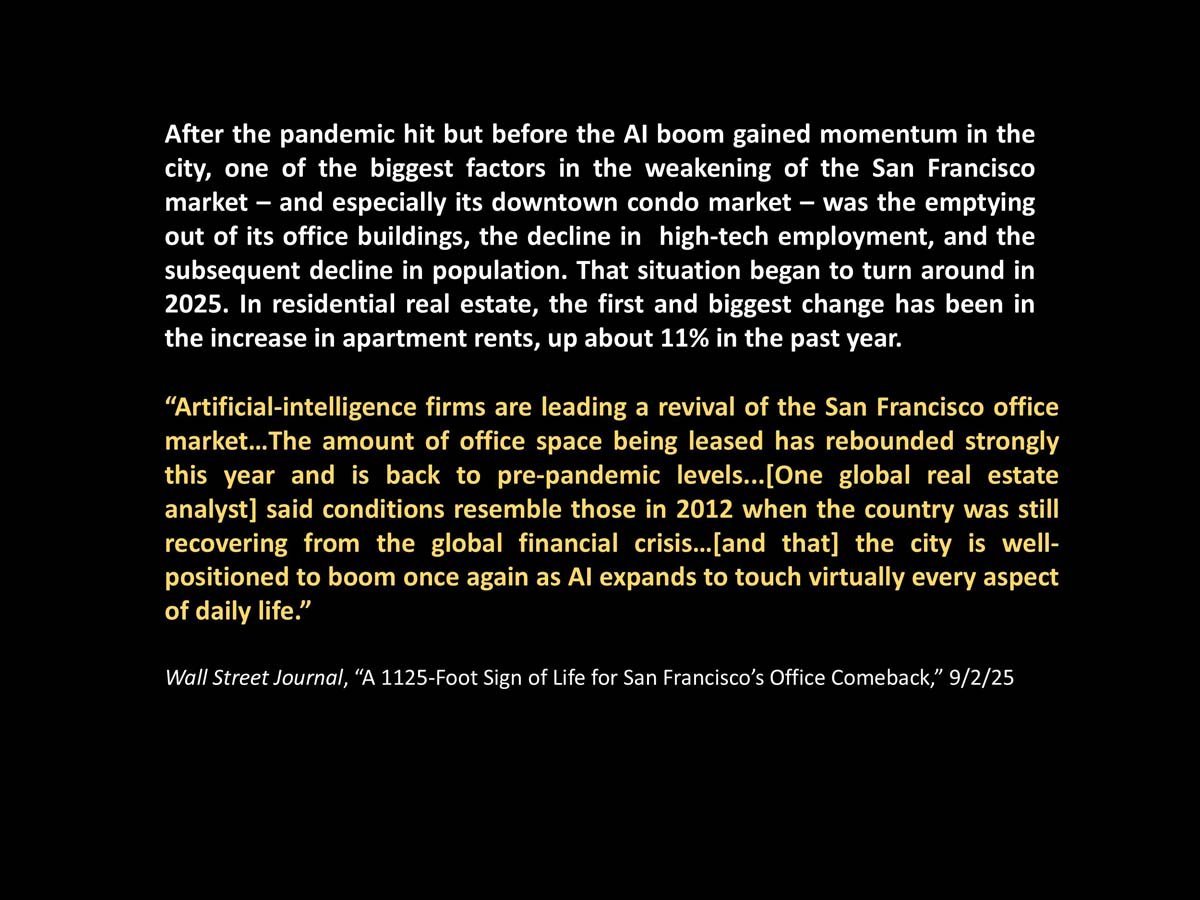
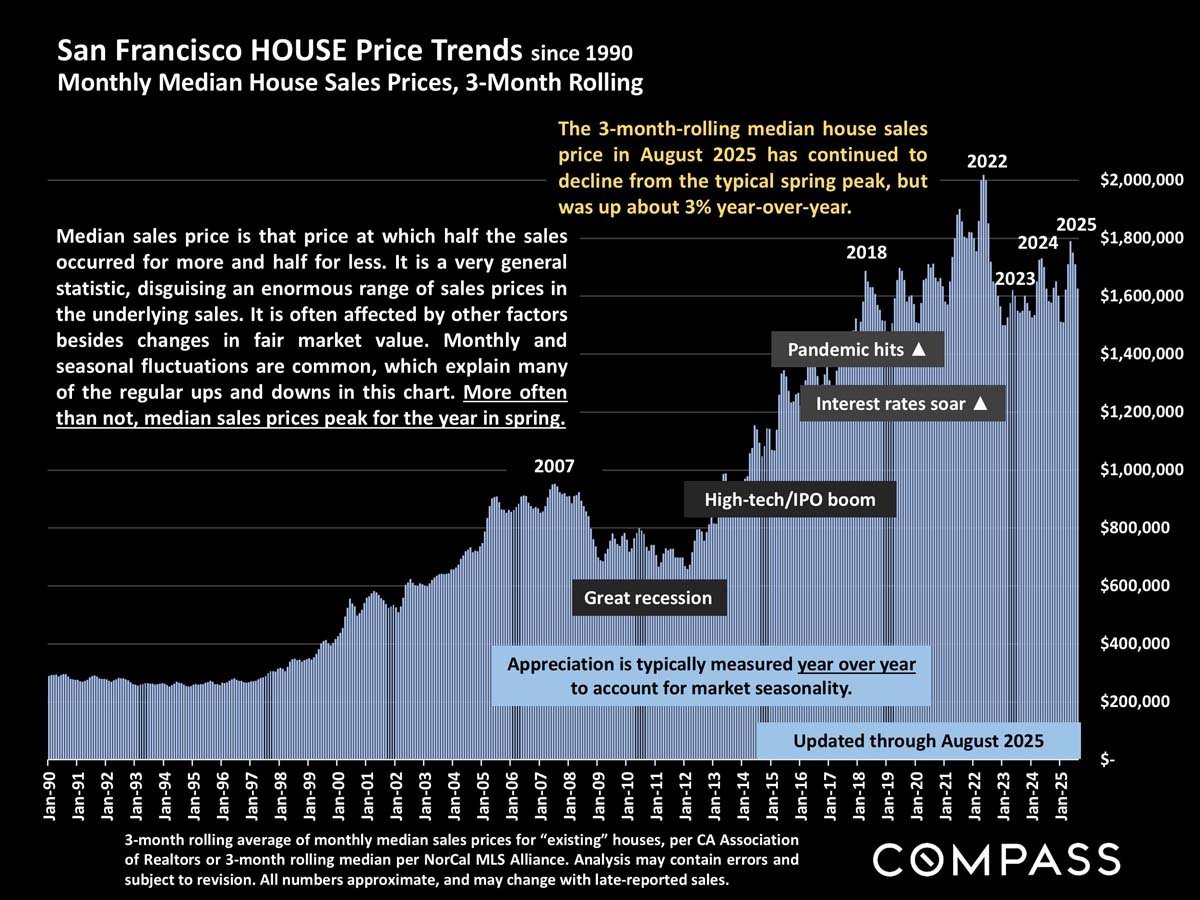
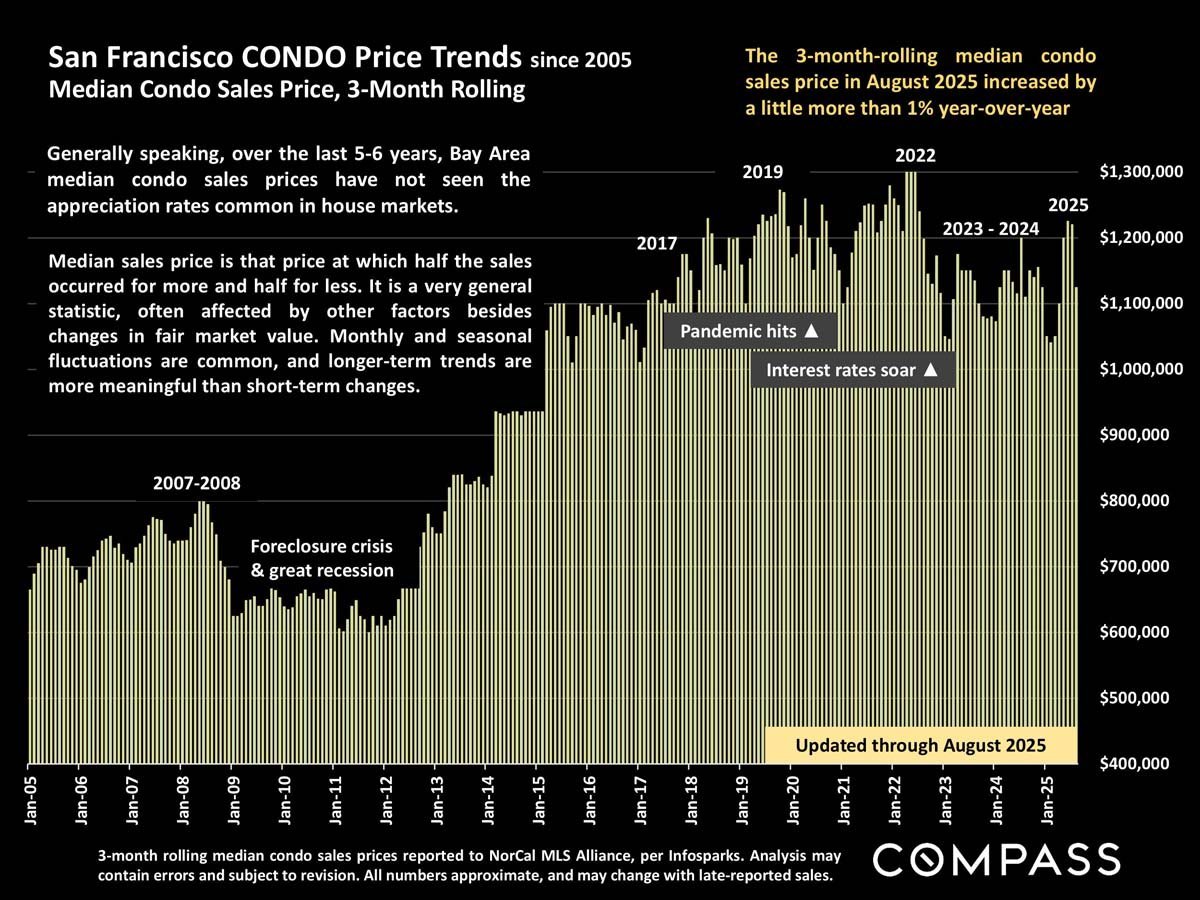
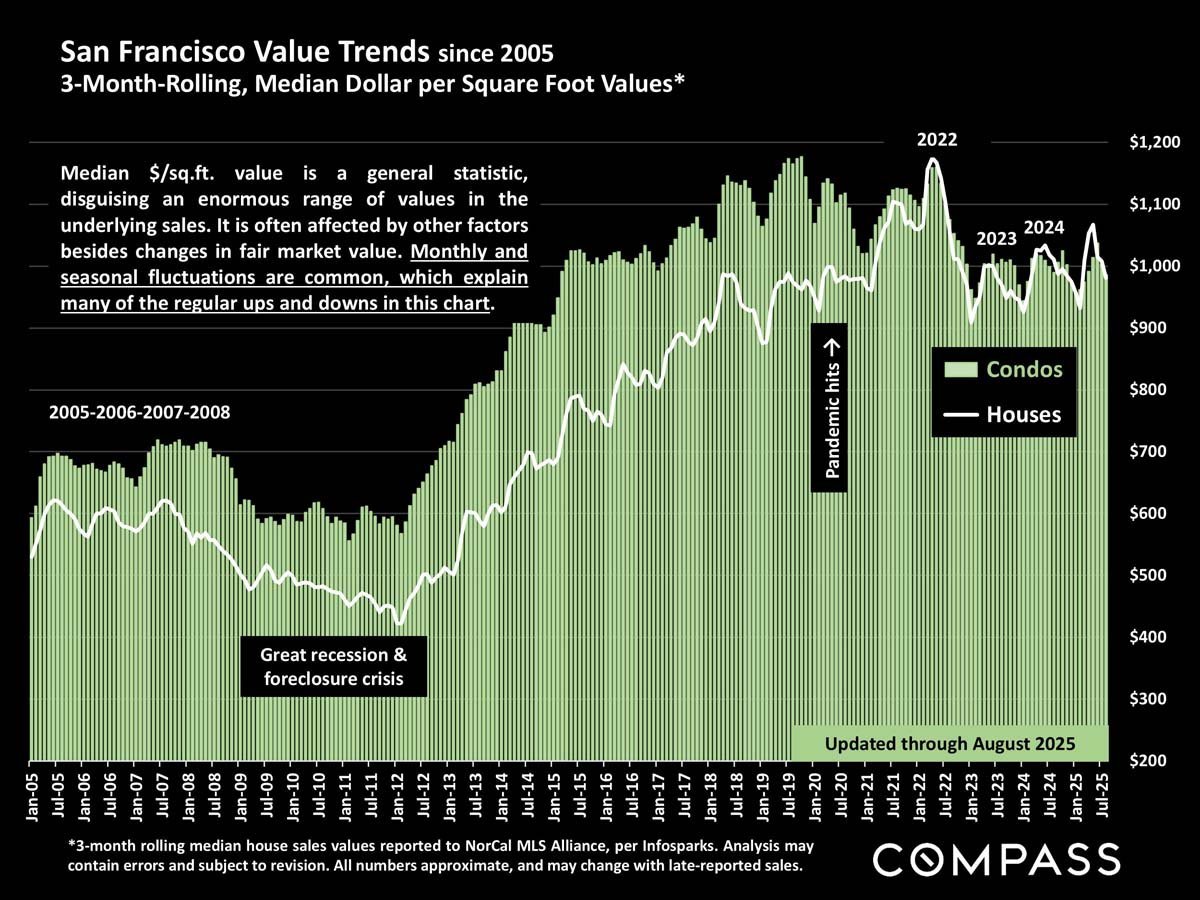
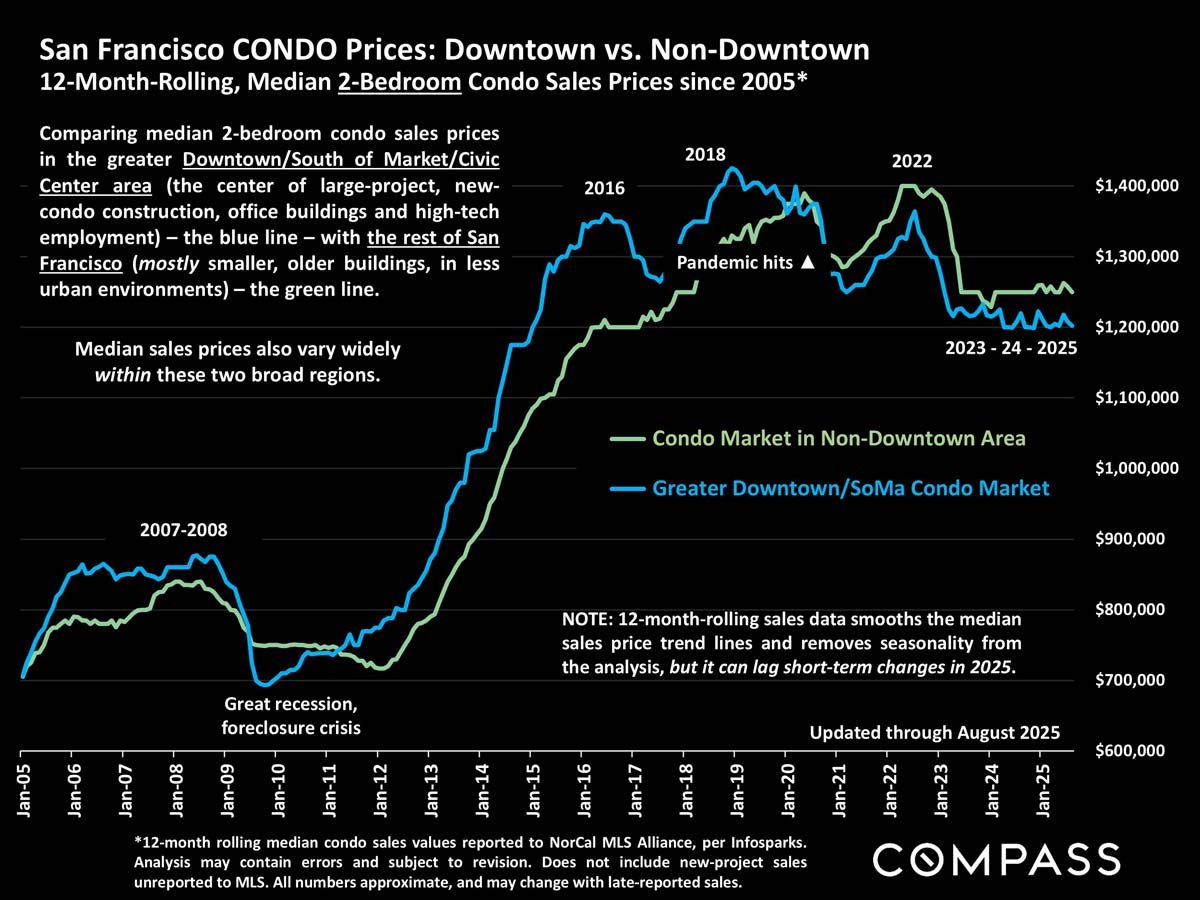
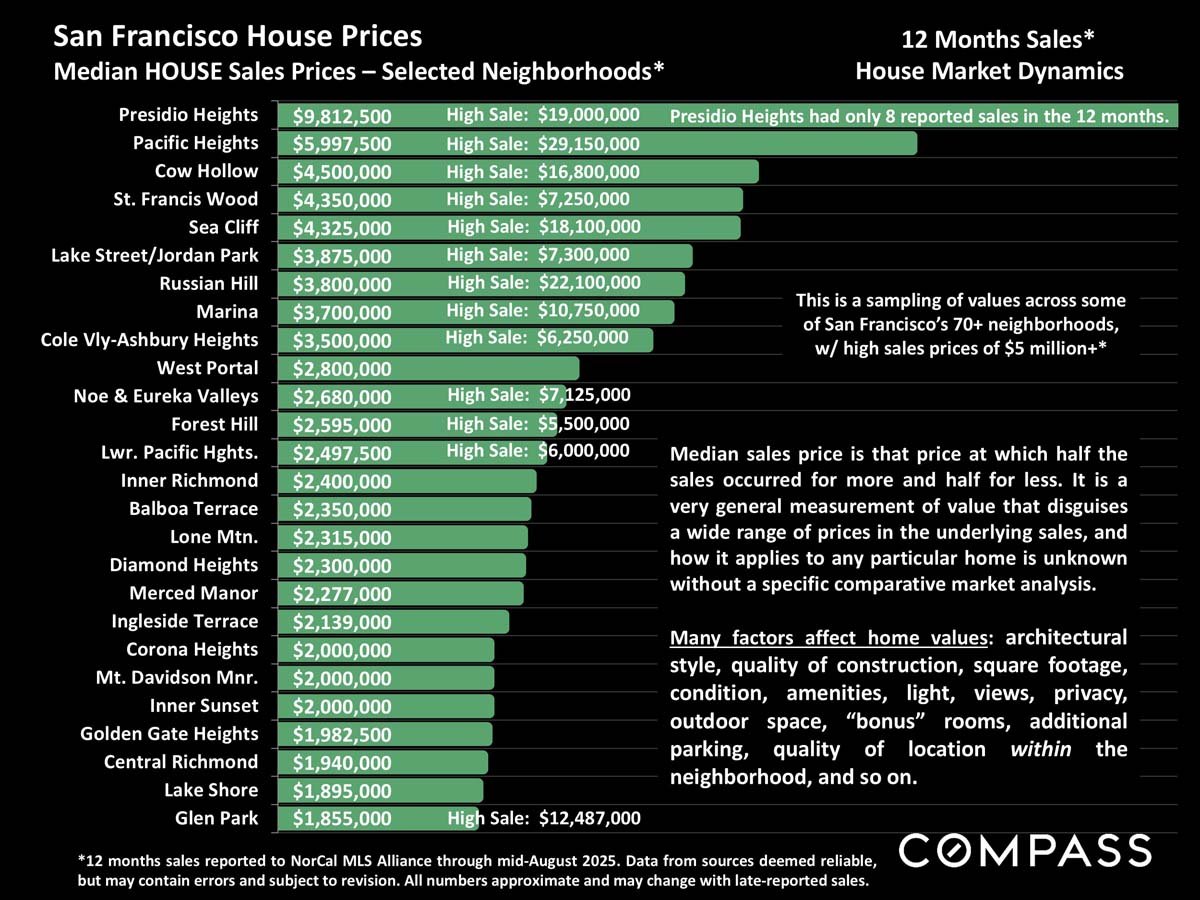
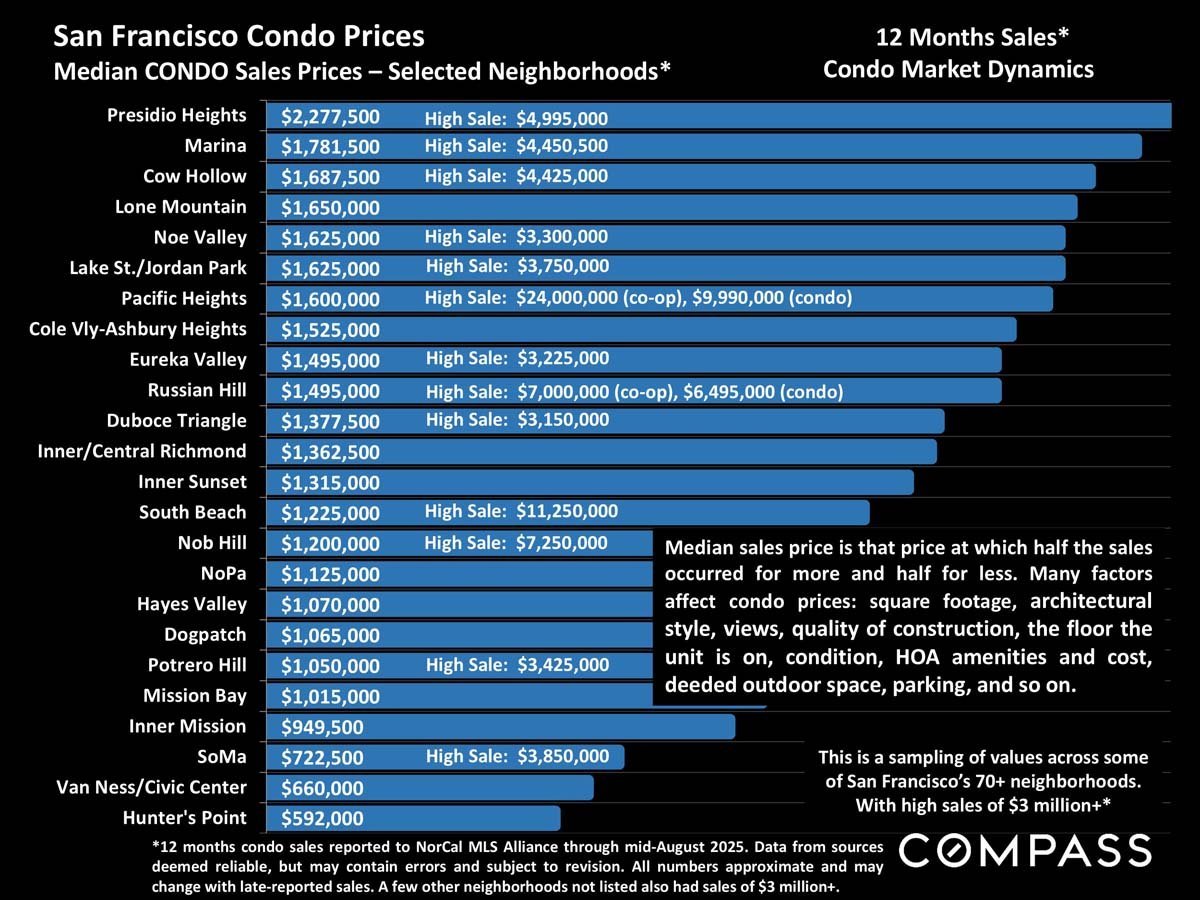
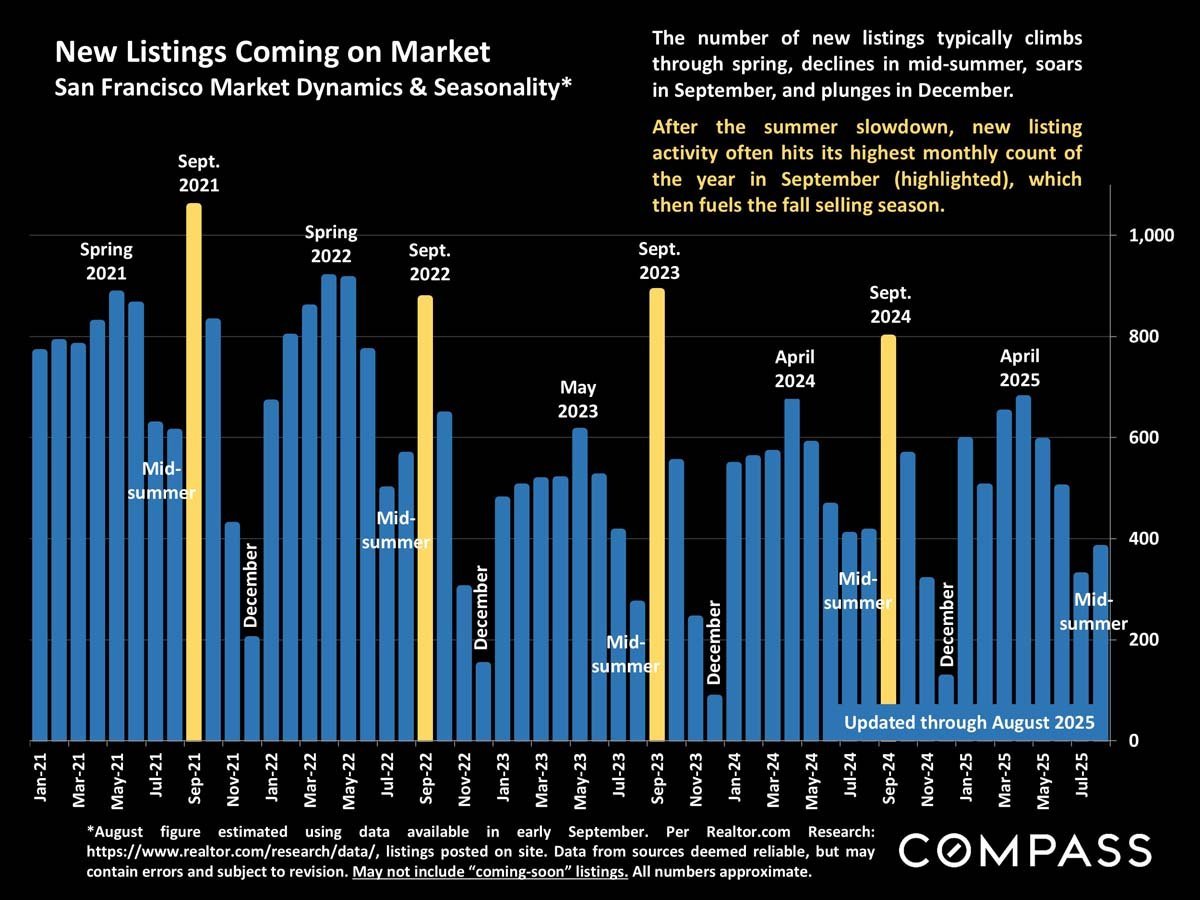
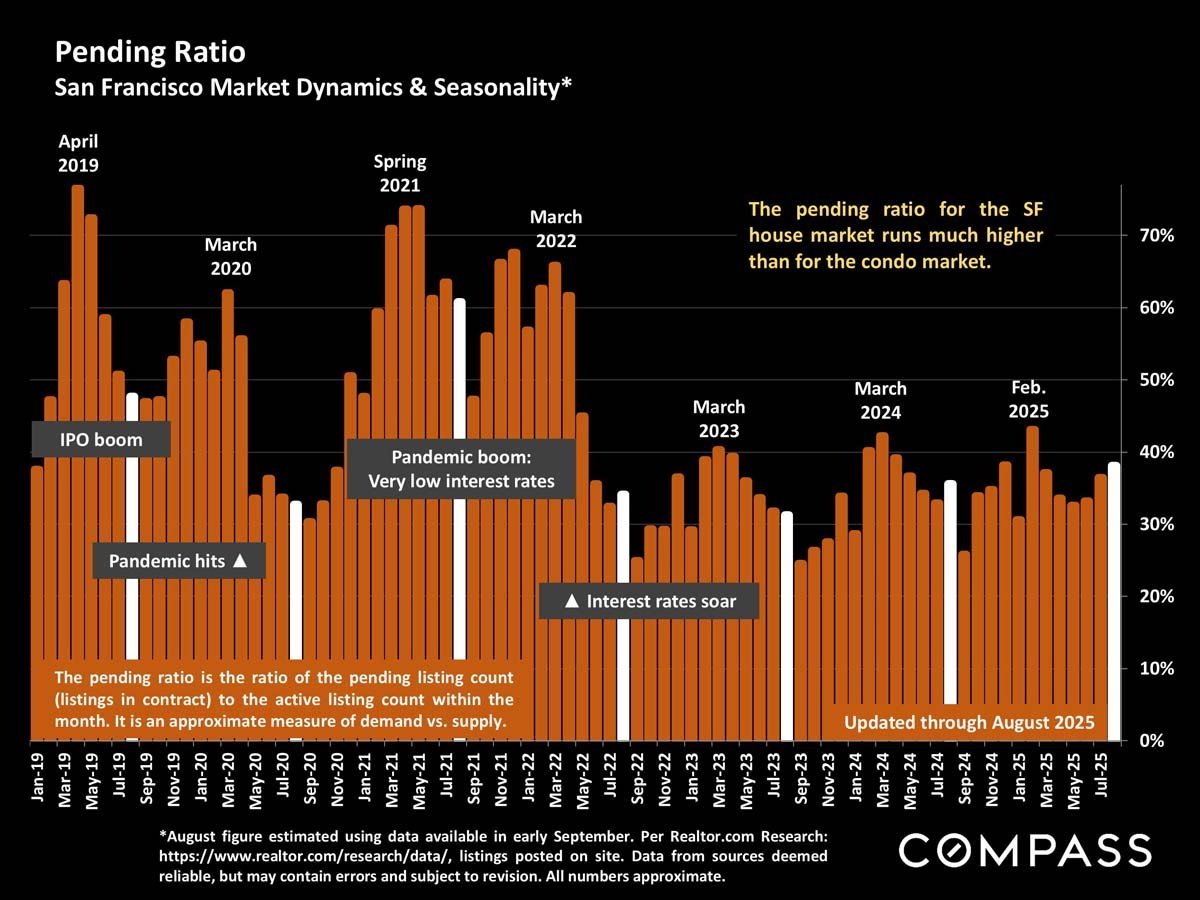
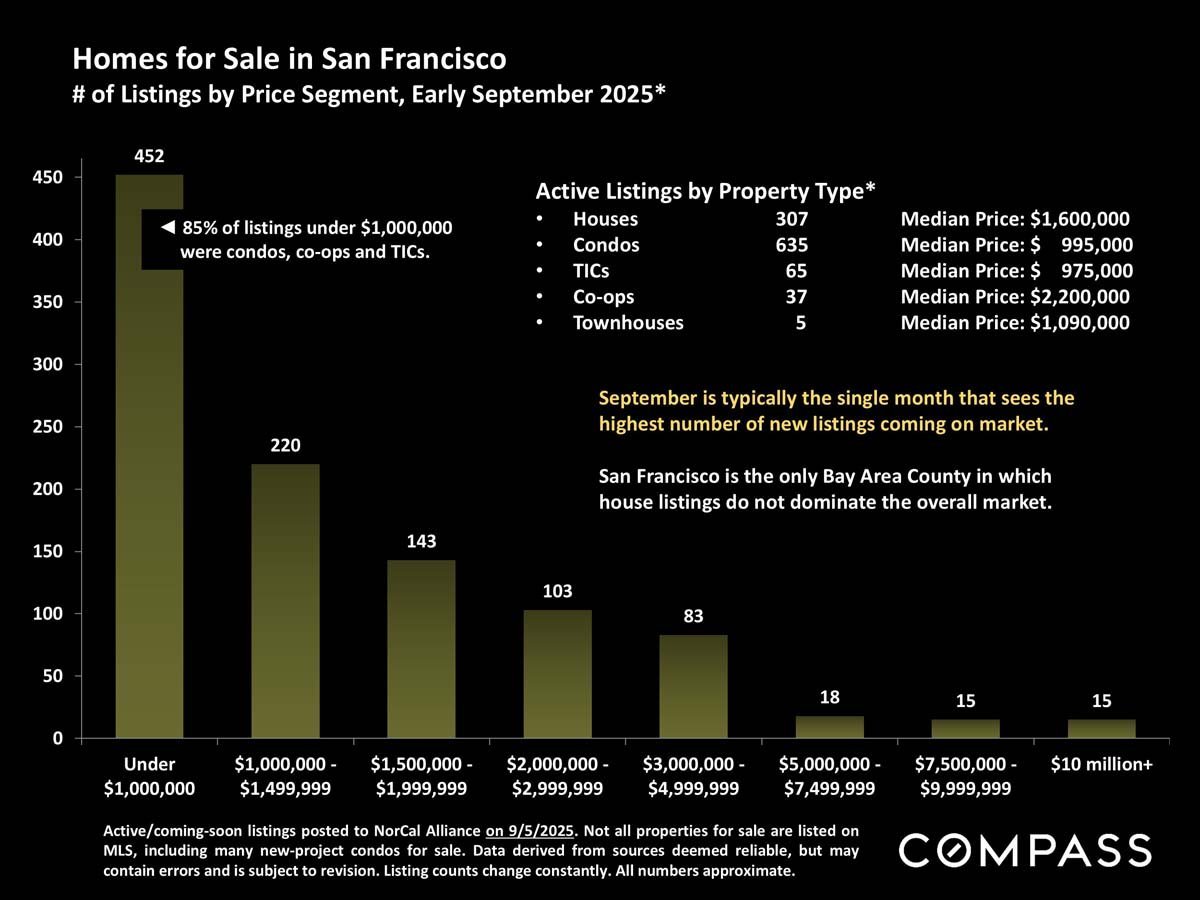
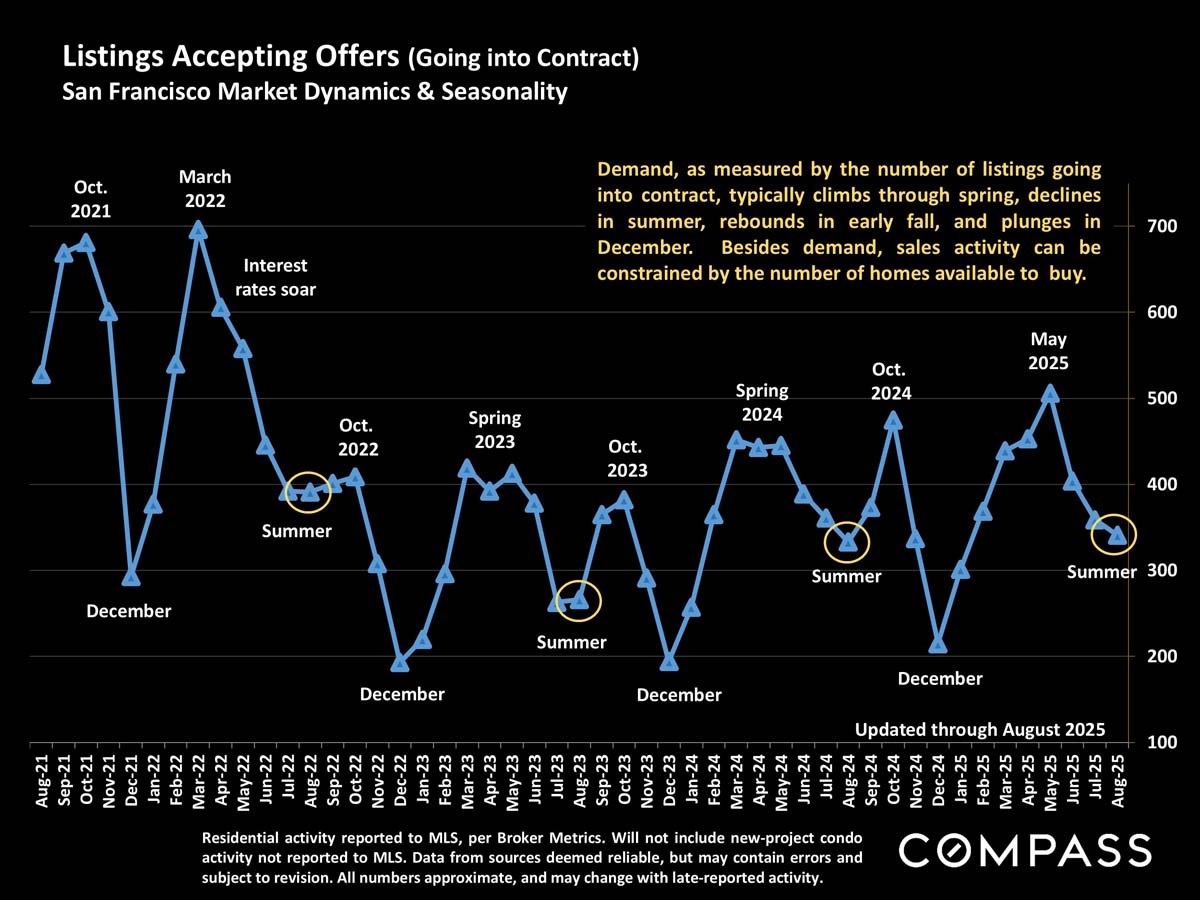
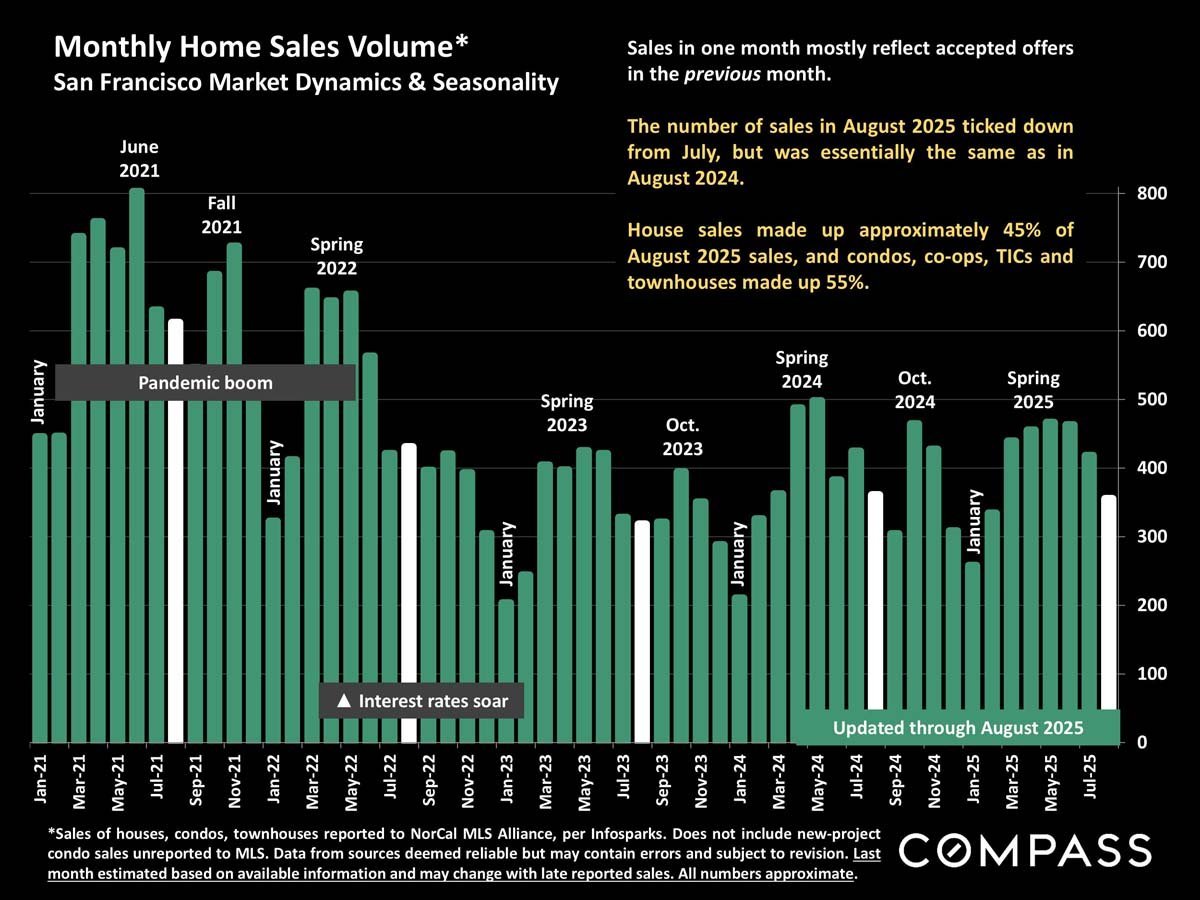
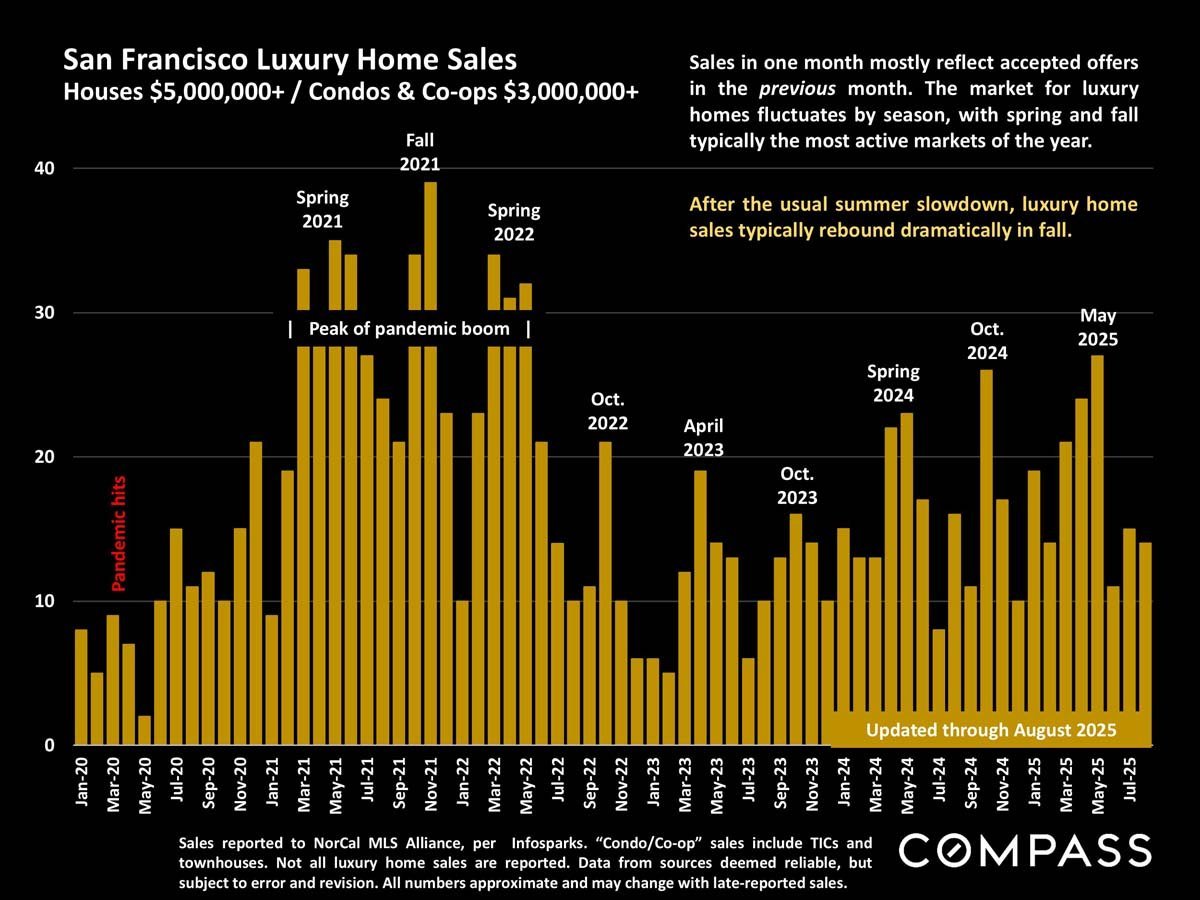
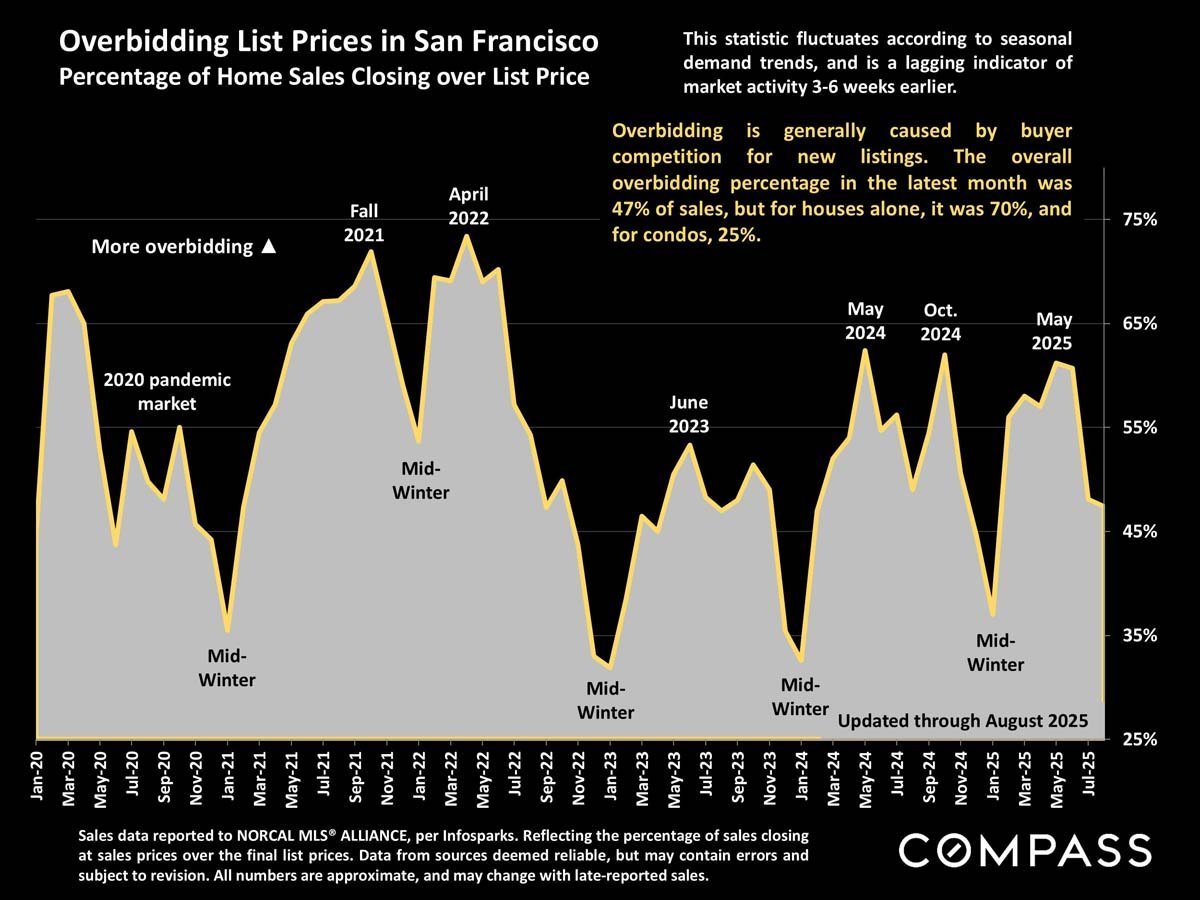
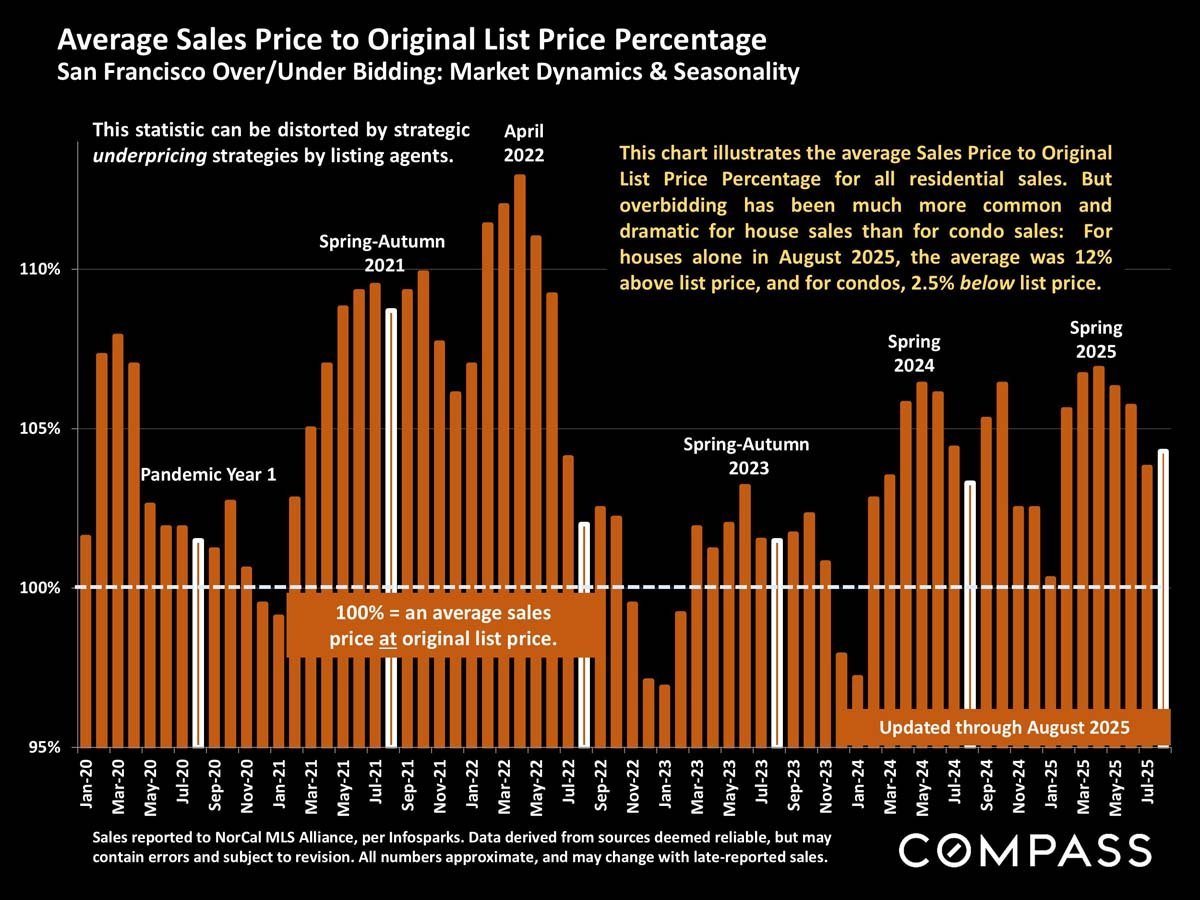
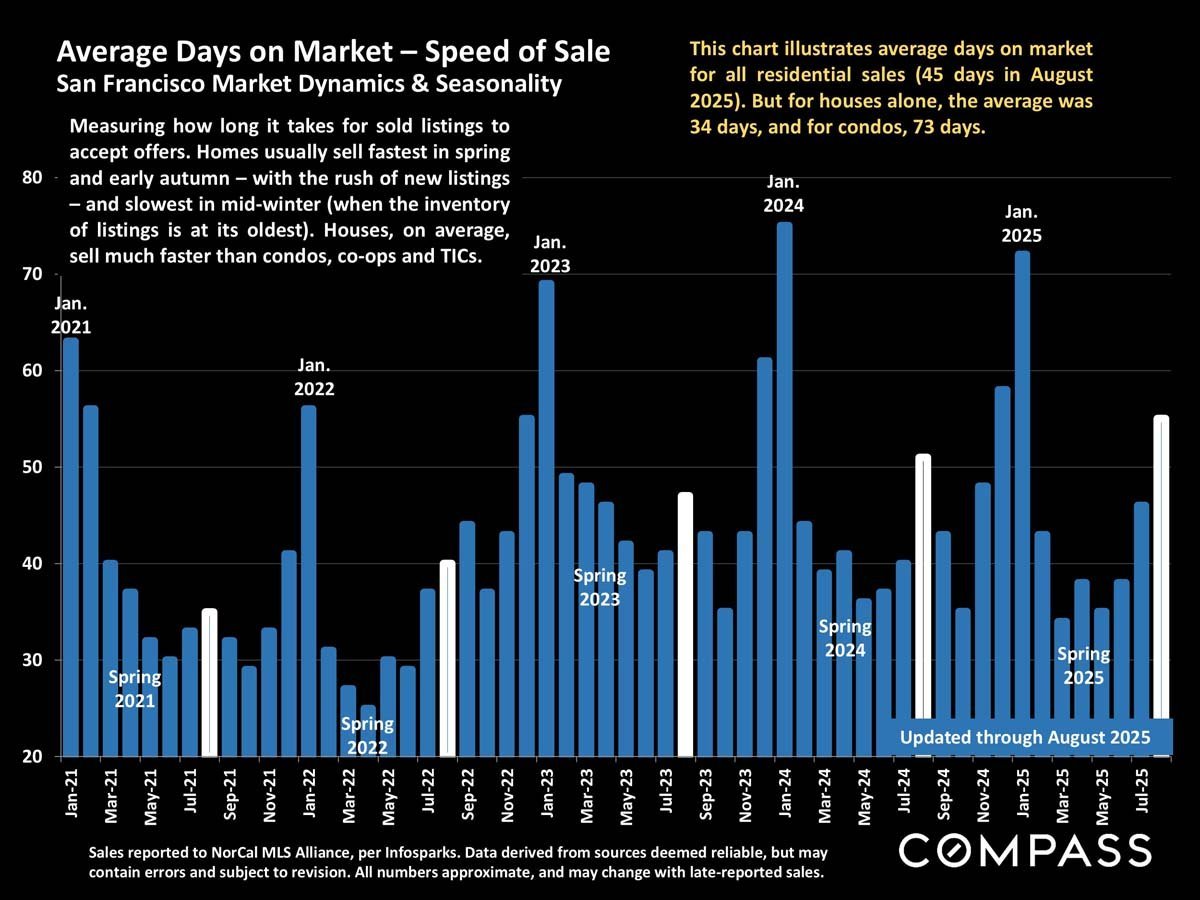
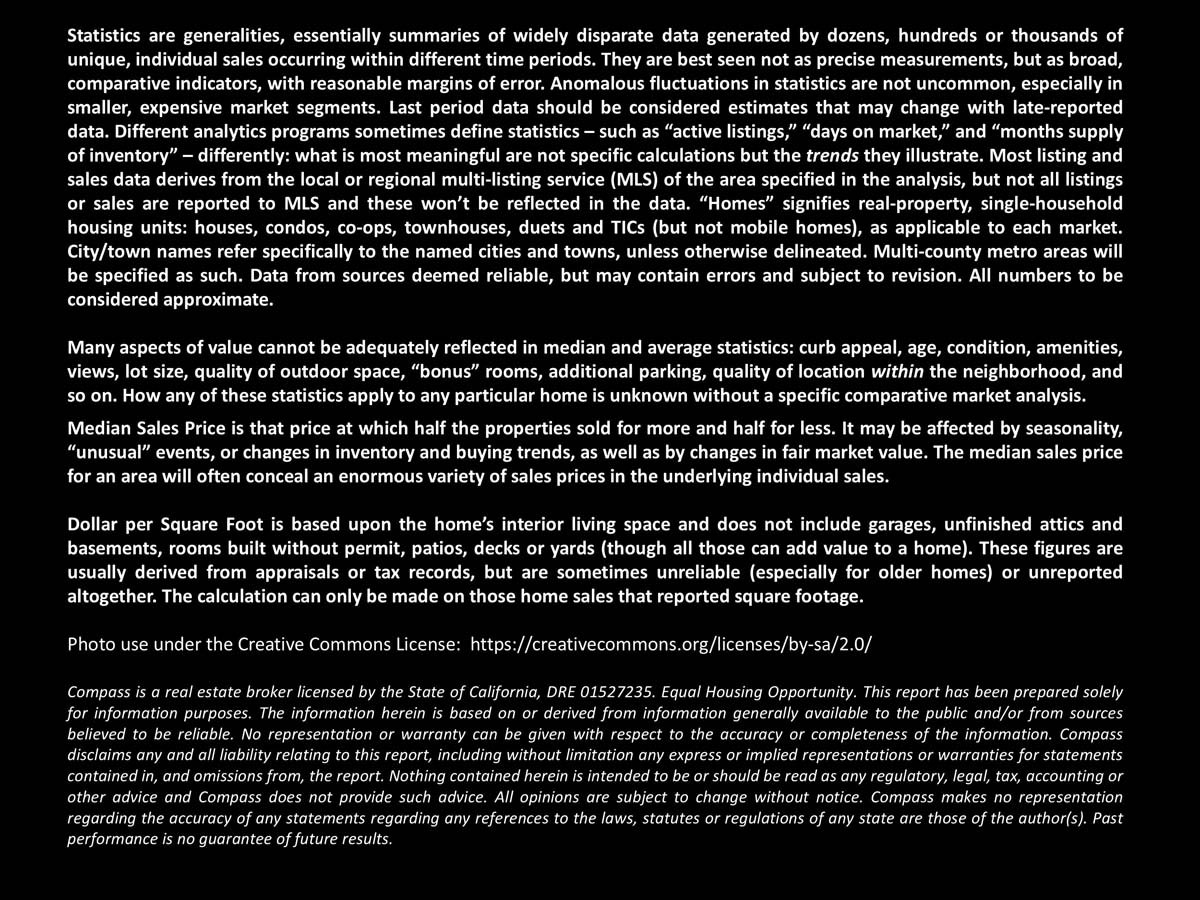
Text graphic about San Francisco’s 2025 market rebound, rising rents, and AI-driven office comeback.Chart of San Francisco median house prices, 1990–2025, with market milestones and August 2025 figures.Chart of San Francisco condo prices from 2005 to August 2025, with recession, pandemic, and interest-rate annotations.Chart of San Francisco condo and house values per square foot from 2005 to 2025, with recession and pandemic markers.Chart comparing San Francisco downtown and non-downtown two-bedroom condo prices from 2005 through August 2025.Bar chart comparing median house sale prices across selected San Francisco neighborhoods.Chart of median San Francisco condo prices by neighborhood, with selected high-sale prices.San Francisco new listings chart, January 2021–August 2025, highlighting September surges and seasonal patterns.San Francisco pending-ratio chart from 2019 to 2025, with annotations for the pandemic and changing interest rates.San Francisco home listings infographic with counts by price range and active listings and median prices by property type.Chart of San Francisco listings going into contract, showing monthly trends and seasonality from August 2021 to August 2025.Chart of monthly San Francisco home sales, January 2021–July 2025, with seasonal trends and August 2025 notes.Chart of San Francisco luxury home sales, with monthly gold bars highlighting the pandemic boom and 2025 activity.Chart of San Francisco home sales closing over list price, showing seasonal fluctuations from 2020 to 2025.Chart comparing San Francisco home sale prices with original list prices from January 2020 through August 2025.Chart of monthly San Francisco days on market from 2021 to August 2025, with seasonal trends and August 2025 averages.Real estate market report notes on statistics, valuation measures, photo licensing, and Compass legal disclosures.

Work With Jane

Get assistance in determining the current property value, crafting a competitive offer, writing and negotiating a contract, and much more. Contact me today.

Follow Me on Instagram